Number Concentration Measurements of Polystyrene Submicrometer Particles
- PMID: 36144906
- PMCID: PMC9501160
- DOI: 10.3390/nano12183118
Number Concentration Measurements of Polystyrene Submicrometer Particles
Abstract
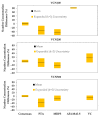
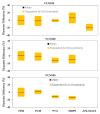
The number of techniques to measure number concentrations and size distributions of submicrometer particles has recently increased. Submicrometer particle standards are needed to improve the accuracy and reproducibility of these techniques. The number concentrations of fluorescently labeled polystyrene submicrometer sphere suspensions with nominal 100 nm, 200 nm and 500 nm diameters were measured using seven different techniques. Diameter values were also measured where possible. The diameter values were found to agree within 20%, but the number concentration values differed by as much as a factor of two. Accuracy and reproducibility related with the different techniques are discussed with the goal of using number concentration standards for instrument calibration. Three of the techniques were used to determine SI-traceable number concentration values, and the three independent values were averaged to give consensus values. This consensus approach is proposed as a protocol for certifying SI-traceable number concentration standards.
Keywords: NIST; bead; calibration; concentration; diameter; flow cytometry; nanosphere; number; reference materials; standards; submicrometer.
Conflict of interest statement
The authors declare no conflict of interest.
Figures


References
-
- Hjorth J., Annel P., Noverini P., Hooper S. GMP Implementation of Online Water Bioburden Analyzers. Pharma. Eng. 2021;41:56–62.
-
- Benkstein K., Da Silva S., Lin N., Ripple D. Evaluating changes to Ralstonia pickettii in high-purity water to guide selection of potential calibration materials for online water bioburden analyzers. J. Ind. Microbio. Biotechnol. 2019;46:1469–1478. doi: 10.1007/s10295-019-02192-4. - DOI - PMC - PubMed
LinkOut - more resources
Full Text Sources

