. 2022 Sep 10;14(18):3739.
doi: 10.3390/nu14183739.

Impact of COVID-19 Lockdown on Food Consumption and Behavior in France (COVISTRESS Study)

Affiliations

Impact of COVID-19 Lockdown on Food Consumption and Behavior in France (COVISTRESS Study)

Mélanie Pouget et al. Nutrients. .

Abstract

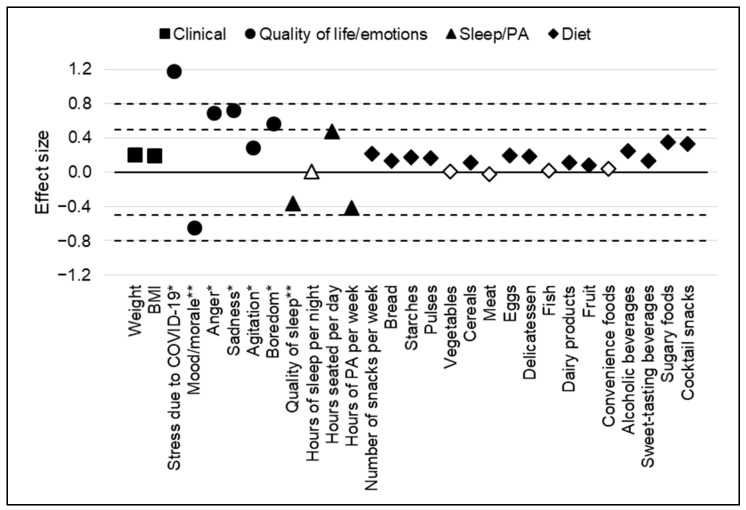
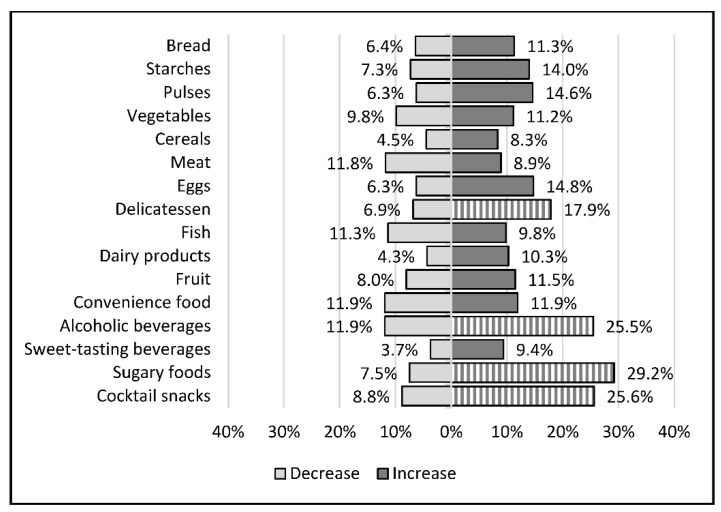
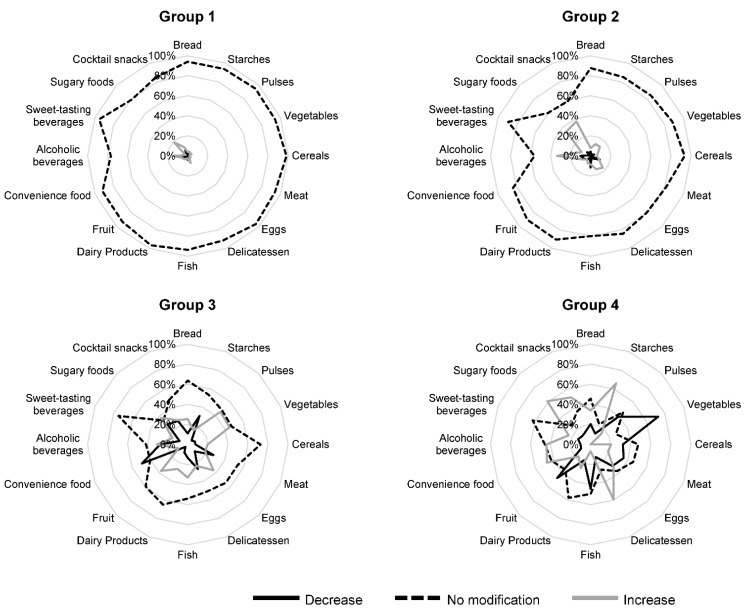
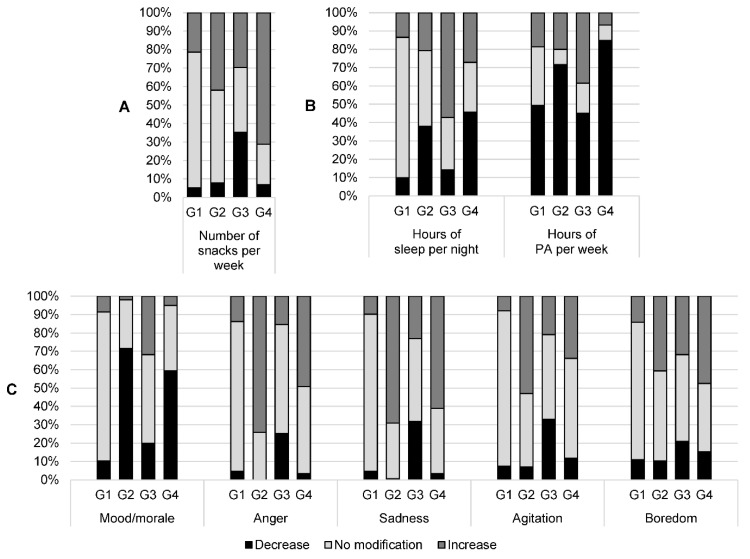
The COVID-19 pandemic and subsequent lockdowns modified work environments, lifestyles, and food consumption. Eating habits and mood changes in a French population during the first lockdown were examined using an online self-reported questionnaire with REDCap software through the COVISTRESS.ORG website. In 671 French participants, the main changes during lockdown were increased stress levels (64 [23; 86] vs. 3 [0; 18]) and sedentary behavior (7 [4; 9] vs. 5 [3; 8] hours per day), a deterioration in sleep quality (50 [27; 83] vs. 70 [48; 94]) and mood (50 [30; 76] vs. 78 [50; 92]), and less physical activity (2.0 [0.5; 5.0] vs. 3.5 [2.0; 6.0]). Mood was modified, with more anger (56 [39; 76] vs. 31 [16; 50]), more sadness (50 [34; 72] vs. 28 [16; 50]), more agitation (50 [25; 66] vs. 43 [20; 50]), and more boredom (32 [7; 60] vs. 14 [3; 29]). A total of 25% of the participants increased their consumption of alcoholic beverages, 29% their consumption of sugary foods, and 26% their consumption of cocktail snacks. A multiple-correspondence analysis highlights four different profiles according to changes in eating habits, food consumption, lifestyle, and mood. In conclusion, eating habits and lifestyle changes during lockdown periods should be carefully monitored to promote healthy behaviors.

Keywords: COVID-19; eating habits; lockdown.


Conflict of interest statement

The authors have no conflict of interest to declare.

Figures

Figure 1
Figure 1
Effect sizes of the variation of each criterion before and during the first lockdown (between 17 March and 10 May 2020). Effect sizes are interpreted according to Cohen’s recommendations: 0.2 = small effect, 0.5 = medium effect, and 0.8 = large effect. Black symbols represent statistically significant effect sizes. White symbols represent statistically non-significant effect sizes. BMI: body mass index; PA: physical activity. * Visual analogue scale from 0 “minimum” to 100 “maximum.” ** Visual analogue scale from 0 “bad” to 100 “excellent”.
Figure 2
Figure 2
Modifications in the consumption of major food groups during the first lockdown (between 17 March and 10 May 2020). Bars indicate the percentage of participants who reported having increased or decreased their consumption of the food group during lockdown (corresponding number shown on the respective bars). Hatched bars represent percentage above 15%.
Figure 3
Figure 3
Description of changes in consumption of major food groups before and during the first lockdown, according to the four groups obtained after multiple-correspondence analysis. Black lines represent participants who reported a decrease during the first lockdown compared to before; gray lines represent participants who reported an increase during the first lockdown compared to before, dashed black lines represent participants who reported no modification during the first lockdown compared to before. For food consumption (number of times per week the food is eaten), a change (increase or decrease) was defined when the number was not the same before and during the first lockdown.
Figure 4
Figure 4
Description of changes in consumption, lifestyle, and mood before and during the first lockdown, according to the four groups obtained after multiple correspondence analysis. (A) Number of snacks; (B) sleep and physical activity; (C) quality of life and mood. Black bars represent participants who reported a decrease during the first lockdown compared to before; light-gray bars represent participants who reported no modification during the first lockdown compared to before; dark-gray bars represent participants who reported an increase during the first lockdown compared to before. For the number of snacks per week, a change (increase or decrease) was defined when the number was not the same before and during the first lockdown. For the number of hours of sleep per night, a change (increase or decrease) was defined when there was a difference of at least one hour before and during the first lockdown. For the number of hours of physical activity per week, a change (increase or decrease) was defined when there was a difference of at least 30 min before and during the first lockdown. For the other variables (visual analogue scales of feelings), the distributions of the variations were divided into three parts, each containing approximately one third of the sample, to classify participants into decrease/no modification/increase. G1 to G4: Group 1 to Group 4; PA: physical activity.

Similar articles

Cited by

References

    1. Gorbalenya A.E., Baker S.C., Baric R.S., de Groot R.J., Drosten C., Gulyaeva A.A., Haagmans B.L., Lauber C., Leontovich A.M., Neuman B.W., et al. Severe Acute Respiratory Syndrome-Related Coronavirus: The Species and Its Viruses—A Statement of the Coronavirus Study Group. bioRxiv. 2020 doi: 10.1101/2020.02.07.937862. - DOI
    1. Lai C.-C., Shih T.-P., Ko W.-C., Tang H.-J., Hsueh P.-R. Severe Acute Respiratory Syndrome Coronavirus 2 (SARS-CoV-2) and Coronavirus Disease-2019 (COVID-19): The Epidemic and the Challenges. Int. J. Antimicrob. Agents. 2020;55:105924. doi: 10.1016/j.ijantimicag.2020.105924. - DOI - PMC - PubMed
    1. Mattioli A.V., Sciomer S., Cocchi C., Maffei S., Gallina S. Quarantine during COVID-19 Outbreak: Changes in Diet and Physical Activity Increase the Risk of Cardiovascular Disease. Nutr. Metab. Cardiovasc. Dis. 2020;30:1409–1417. doi: 10.1016/j.numecd.2020.05.020. - DOI - PMC - PubMed
    1. Covid-19: Une Enquête Pour Suivre L’évolution des Comportements et de la Santé Mentale Pendant l’épidémie. [(accessed on 22 September 2020)]. Available online: https://www.santepubliquefrance.fr/etudes-et-enquetes/coviprev-une-enque....
    1. Marty L., de Lauzon-Guillain B., Labesse M., Nicklaus S. Food Choice Motives and the Nutritional Quality of Diet during the COVID-19 Lockdown in France. Appetite. 2021;157:105005. doi: 10.1016/j.appet.2020.105005. - DOI - PMC - PubMed