. 2022 Aug 25;15(9):1052.
doi: 10.3390/ph15091052.

Licochalcone B, a Natural Autophagic Agent for Alleviating Oxidative Stress-Induced Cell Death in Neuronal Cells and Caenorhabditis elegans Models

Affiliations

Licochalcone B, a Natural Autophagic Agent for Alleviating Oxidative Stress-Induced Cell Death in Neuronal Cells and Caenorhabditis elegans Models

Liqun Qu et al. Pharmaceuticals (Basel). .

Abstract

Autophagy has been implicated in the regulation of neuroinflammation and neurodegenerative disorders. Licochalcone B (LCB), a chalcone from Glycyrrhiza inflata, has been reported to have anti-cancer, anti-oxidation and anti-β-amyloid fibrillation effects; however, its effect in autophagy remain un-investigated. In the current study, the potential neuro-protective role of LCB in terms of its anti-oxidative, anti-apoptotic, and autophagic properties upon oxidative stress-induced damage in neuronal cells was investigated. With the production of reactive oxygen species (ROS) as a hallmark of neuroinflammation and neurodegeneration, hydrogen peroxide (H2O2) was adopted to stimulate ROS-induced cell apoptosis in PC-12 cells. Our findings revealed that LCB reduced cell cytotoxicity and apoptosis of PC-12 cells upon H2O2-stimulation. Furthermore, LCB increased the level of the apoptosis-associated proteins caspase-3 and cleaved caspase-3 in H2O2-induced cells. LCB effectively attenuated the level of oxidative stress markers such as MDA, SOD, and ROS in H2O2-induced cells. Most importantly, LCB was confirmed to possess its anti-apoptotic effects in H2O2-induced cells through the induction of ATG7-dependent autophagy and the SIRT1/AMPK signaling pathway. As a novel autophagic inducer, LCB increased the level of autophagy-related proteins LC3-II and decreased p62 in both neuronal cells and Caenorhabditis elegans (C. elegans) models. These results suggested that LCB has potential neuroprotective effects on oxidative damage models via multiple protective pharmacological mechanisms.

Keywords: Licochalcone B; antioxidant; apoptosis; autophagy; reactive oxygen species.


Conflict of interest statement

The authors declare no conflict of interest.

Figures

Figure 1
Figure 1
Chemical structure of LCB.
Figure 2
Figure 2
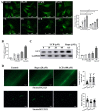
LCB attenuated H2O2-induced cellular oxidative damage in PC-12 cells. (A) The cell viability of PC-12 cells treated with 0 to 40 μM of LCB for 24 h was measured by the MTT assay. (B) Cell viability, (C) LDH level, and (D) Caspase–3 activity were measured in H2O2 (900 μM)-induced PC-12 cells for 6 h after LCB (10, 20, or 40 μM) pre-treatment for 16 h. ### p < 0.001, H2O2 group vs. control; * p < 0.05, *** p < 0.001, H2O2 + LCB group vs. H2O2 group. (E) Cellular morphological changes were evaluated in H2O2 (900 μM) -induced PC-12 cells for 6 h after pretreatment of LCB for 16 h as indicated. Scale bar = 50 μm. (F) Calcein/PI assay was adopted to perform the ICC staining in H2O2 (900 μM)-induced PC-12 cells for 6 h after pretreatment of LCB for 16 h as indicated. Scale bar = 50 μm.
Figure 3
Figure 3
Effect of LCB on H2O2-induced oxidative stress in PC-12 cells. (A) PC-12 cells were pretreated with 25 μM of LCB for 16 h before exposure to 900 μM H2O2 for 6 h. The mean fluorescence intensity of intracellular ROS was quantified using flow cytometry. ### p < 0.001, H2O2 group vs. control; *** p < 0.001, H2O2 + LCB group vs. H2O2 group. (B,C) PC-12 cells were pretreated with 10, 20, or 40 μM of LCB for 16 h before exposure to 900 μM H2O2 for 6 h. MDA and SOD levels were conducted in H2O2-induced PC-12 cells (with or without the treatment of LCB) as the indicated conditions.
Figure 4
Figure 4
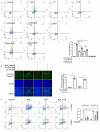
LCB protected PC-12 cells from apoptosis induced by H2O2. (A) PC-12 cells were pretreated with 10, 20, or 40 μM of LCB for 16 h before exposure to 900 μM H2O2 for 6 h. Hoechst 33342 staining was performed in cells for 10 min. Scale bar = 50 mm. *** p < 0.001 (B) PC-12 cells were pretreated with 10, 20, and 40 μM of LCB for 16 h before exposure to 900 μM H2O2 for 6 h. Apoptotic cells detected by using annexin/propidium iodide (PI) double staining were quantitated by flow cytometry. (C) PC-12 cells were pretreated with LCB (10 to 40 μM) for 16 h before being subjected to 900 μM H2O2 for 6 h. Western blot analysis was used to detect the level of cleaved or total caspase-3 protein expression, ** p < 0.01, ### p < 0.001, H2O2 group vs. control; *** p < 0.001, H2O2 + LCB group vs. H2O2 group. The original uncropped images of Western blotting are shown in Supplementary Figure S3.
Figure 5
Figure 5
LCB enhanced autophagy in GFP–LC3–U87 stable cells and C. elegans models. (A) GFP–LC3–U87 cells were exposed to various concentrations of LCB (10 to 40 μM) for 24 h or various treatment durations (3 to 24 h) of LCB (20 μM), as indicated. Punctate GFP–LC3 were calculated from the counts in five randomly selected visual fields. Representative fluorescence images with punctate GFP–LC3 are shown. Scale bar = 75 μm, *** p < 0.001. (B) Real time (RT)–PCR and (C) Western blot for the expression of LC3–II/I after treatment of LCB or rapamycin for 24 h. ** p < 0.01, *** p < 0.001. (D) Two autophagic model of C. elegans: LGG–1::GFP and SQST–1/p62::GFP. The former model shows the number of fluorescent spots (LGG–1) indicating autophagic activity (positive correlation). The latter model represents fluorescence intensity of the autophagic substrate (p62), which is negatively correlated to the autophagic activity. Rapa (rapamycin) (20 uM) was used as the positive control. *** p < 0.001. The original uncropped images of Western blotting are shown in Supplementary Figure S4.
Figure 6
Figure 6
RT–PCR array on the gene expression level of autophagy-related genes in SH–SY5Y cells with or without 20 uM LCB-treatment for 24 h. (A) Scatter plot and (B) table showing the gene expression level of SH–SY5Y cells under control or LCB treatments. (C) Heap map and (D) STRING database predicted differential autophagic genes and its possible pathway on AMPK/SIRT1 activation upon LCB treatment.
Figure 7
Figure 7
LCB activates autophagy via the SIRT1/AMPK pathway. (A) PC-12 cells were treated with LCB under the indicated concentrations for 24 h. After treatment, cell lysates were harvested for the analysis of SIRT1, P–AMPK, Beclin–1, and p62 by Western blot. (B) PC-12 cells were treated with LCB or cotreated with LCB and CC under the indicated concentrations for 24 h. After treatment, cell lysates were harvested for the analysis of SIRT1, P–AMPK, and p62 and LC3 by Western blot. Bar chart indicating the normalization of the interest proteins to β–actin. * p < 0.05, ** p < 0.01, *** p < 0.001. The original uncropped images of Western blotting are shown in Supplementary Figure S5.
Figure 8
Figure 8
LCB rescued H2O2-induced apoptosis via enhancing autophagy. (A) PC-12 cells were pretreated with CC for 1 h and then treated with LCB or Rap for 16 h in the presence or absence of CC before the addition of H2O2 for 2 h. Cells were then collected and analyzed by flow cytometry using the Annexin VFITC/PI Apoptosis Detection Kit. *** p < 0.001. (B) PC-12 cells were pretreated with CC for 1 h and then treated with LCB or Rap for 16 h in the presence or absence of CC before adding H2O2 for 2 h. Cells were then fixed with 4% PFA. The representative images with GFP–cleaved–caspase-3 were captured. Scale bar: 50 μm. *** p < 0.001. (C) Representative flow cytometric images showing the percentage of apoptotic cells in both H2O2-induced ATG7−/− and ATG7+/+ cells with or without the presence of 25 μM of LCB were presented; * p < 0.05, *** p < 0.001.
Figure 9
Figure 9
Schematic diagrams depicting the autophagic protective effects of LCB against H2O2-induced cell apoptosis via the AMPK/SIRT1 autophagy signal pathways. CC, Compound C; Rapa, rapamycin; ROS, reactive oxygen species; MDA, malondialdehyde; SOD, superoxide dismutase.

References

    1. Poprac P., Jomova K., Simunkova M., Kollar V., Rhodes C.J., Valko M. Targeting Free Radicals in Oxidative Stress-Related Human Diseases. Trends Pharm. Sci. 2017;38:592–607. doi: 10.1016/j.tips.2017.04.005. - DOI - PubMed
    1. Uttara B., Singh A.V., Zamboni P., Mahajan R.T. Oxidative stress and neurodegenerative diseases: A review of upstream and downstream antioxidant therapeutic options. Curr. Neuropharmacol. 2009;7:65–74. doi: 10.2174/157015909787602823. - DOI - PMC - PubMed
    1. Armstrong R. What causes neurodegenerative disease? Folia Neuropathol. 2020;58:93–112. doi: 10.5114/fn.2020.96707. - DOI - PubMed
    1. Blankenberg F.G. In vivo detection of apoptosis. J. Nucl. Med. 2008;49((Suppl. S2)):81S–95S. doi: 10.2967/jnumed.107.045898. - DOI - PubMed
    1. Schultz D.R., Harrington W.J. Apoptosis: Programmed cell death at a molecular level. Semin. Arthritis Rheum. 2003;32:345–369. doi: 10.1053/sarh.2003.50005. - DOI - PubMed