

Identifying the Determinants of Distribution of Oncomelania hupensis Based on Geographically and Temporally Weighted Regression Model along the Yangtze River in China
- PMID: 36145401
- PMCID: PMC9504969
- DOI: 10.3390/pathogens11090970
Identifying the Determinants of Distribution of Oncomelania hupensis Based on Geographically and Temporally Weighted Regression Model along the Yangtze River in China
Abstract
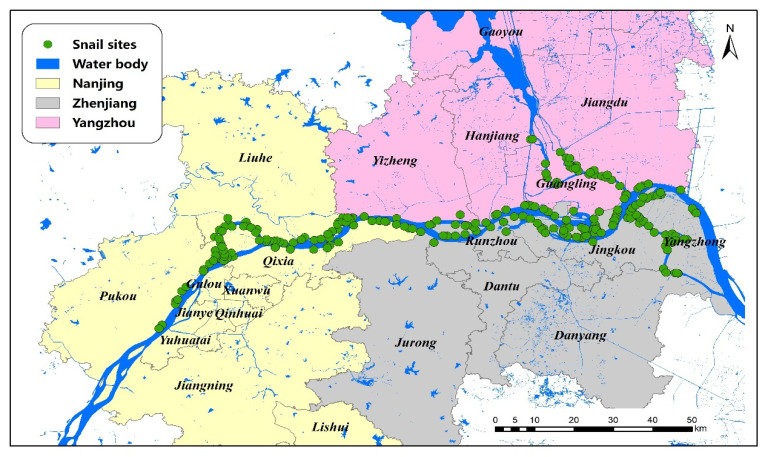
Background: As the unique intermediate host of Schistosoma japonicum, the geographical distribution of Oncomelania hupensis (O. hupensis) is an important index in the schistosomiasis surveillance system. This study comprehensively analyzed the pattern of snail distribution along the Yangtze River in Jiangsu Province and identified the dynamic determinants of the distribution of O. hupensis.
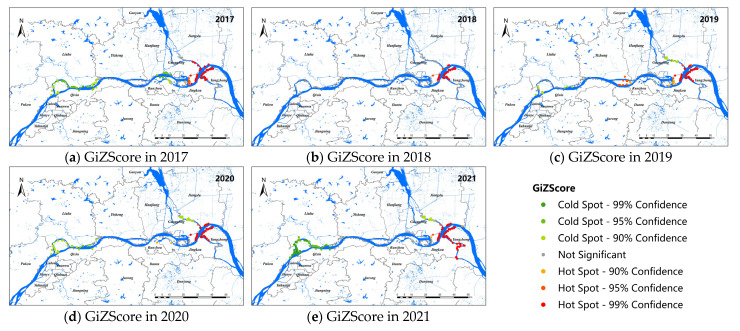
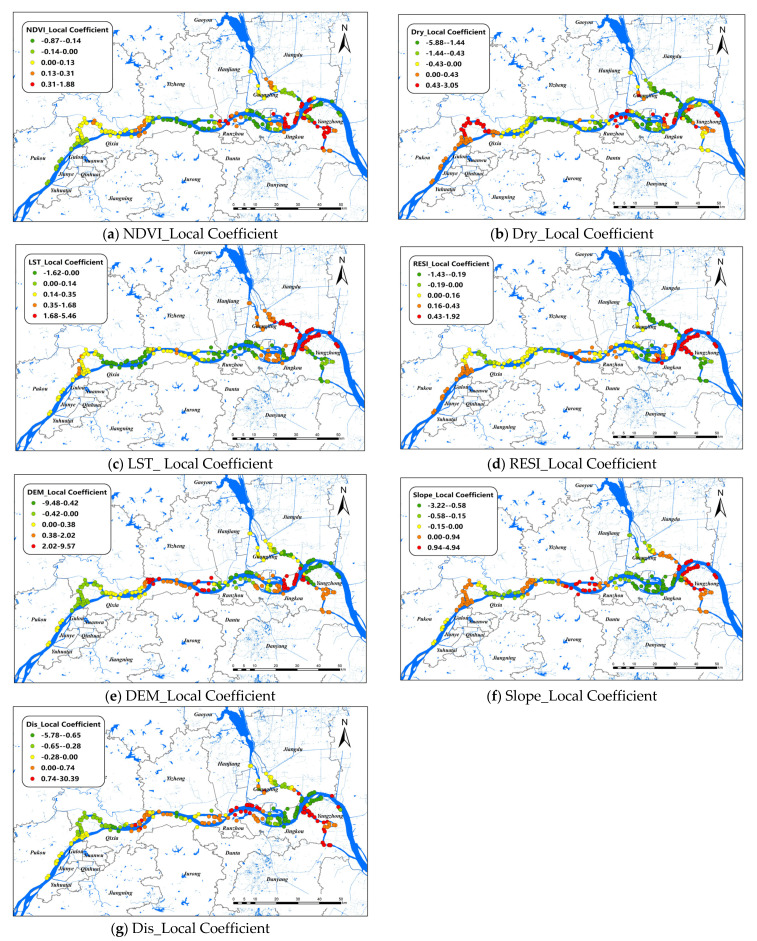
Methods: Snail data from 2017 to 2021 in three cities (Nanjing, Zhenjiang, and Yangzhou) along the Yangtze River were obtained from the annual cross-sectional survey produced by the Jiangsu Institute of Parasitic Diseases. Spatial autocorrelation and hot-spot analysis were implemented to detect the spatio-temporal dynamics of O. hupensis distribution. Furthermore, 12 factors were used as independent variables to construct an ordinary least squares (OLS) model, a geographically weighted regression (GWR) model, and a geographically and temporally weighted regression (GTWR) model to identify the determinants of the distribution of O. hupensis. The adjusted coefficients of determination (adjusted R2, AICc, RSS) were used to evaluate the performance of the models.
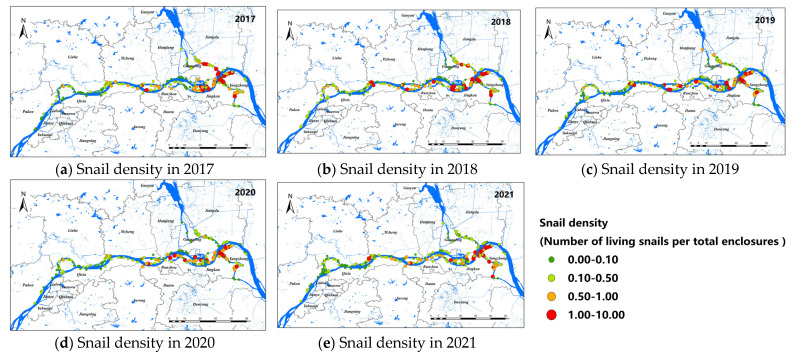
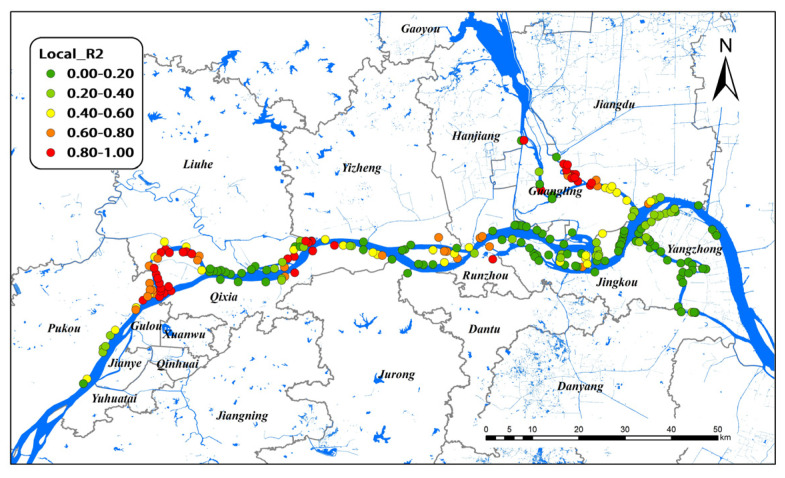
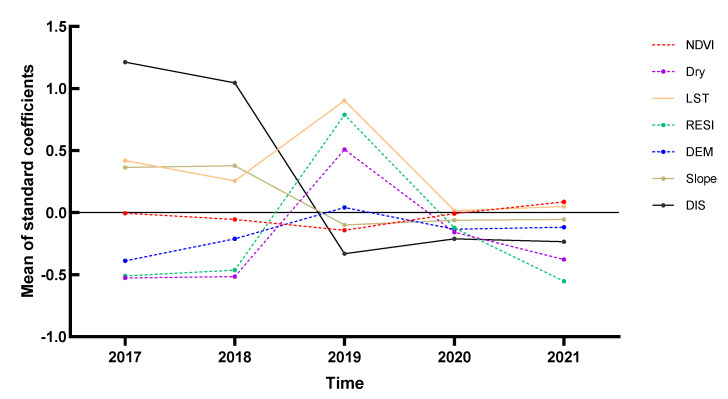
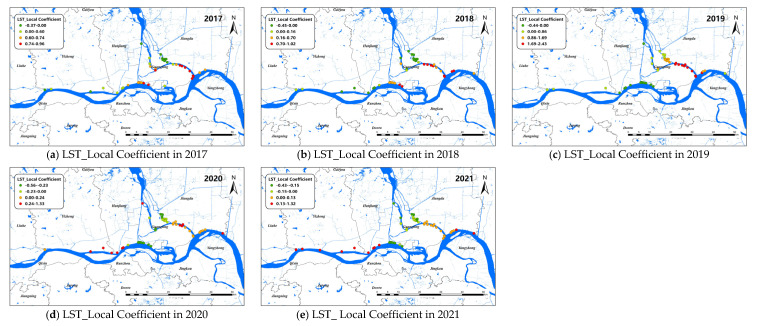
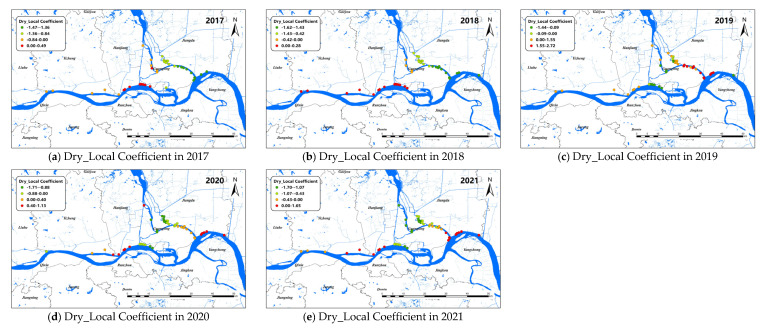
Results: In general, the distribution of O. hupensis had significant spatial aggregation in the past five years, and the density of O. hupensis increased eastwards in the Jiangsu section of the lower reaches of the Yangtze River. Relatively speaking, the distribution of O. hupensis wase spatially clustered from 2017 to 2021, that is, it was found that the border between Yangzhou and Zhenjiang was the high density agglomeration area of O. hupensis snails. According to the GTWR model, the density of O. hupensis was related to the normalized difference vegetation index, wetness, dryness, land surface temperature, elevation, slope, and distance to nearest river, which had a good explanatory power for the snail data in Yangzhou City (adjusted R2 = 0.7039, AICc = 29.10, RSS = 6.81).
Conclusions: The distribution of O. hupensis and the environmental factors in the Jiangsu section of the lower reaches of the Yangtze River had significant spatial aggregation. In different areas, the determinants affecting the distribution of O. hupensis were different, which could provide a scientific basis for precise prevention and control of O. hupensis. A GTWR model was prepared and used to identify the dynamic determinants for the distribution of O. hupensis and contribute to the national programs of control of schistosomiasis and other snail-borne diseases.
Keywords: Oncomelania hupensis; Yangtze River; geographical and temporal weighted regression; heterogeneity; spatial autocorrelation.
Conflict of interest statement
The authors declare no conflict of interest.
Figures
Similar articles
-
[Spatio-temporal analysis of Oncomelania hupensis along Jiangsu section of the Yangtze River from 2015 to 2017].Zhongguo Xue Xi Chong Bing Fang Zhi Za Zhi. 2019 Oct 15;31(6):603-606. doi: 10.16250/j.32.1374.2018175. Zhongguo Xue Xi Chong Bing Fang Zhi Za Zhi. 2019. PMID: 32064803 Chinese.
-
Assessment of the influence of levees along Yangtze River on Oncomelania hupensis, the intermediate host of Schistosoma japonicum.Parasit Vectors. 2024 Jul 7;17(1):291. doi: 10.1186/s13071-024-06318-1. Parasit Vectors. 2024. PMID: 38972983 Free PMC article.
-
[Spatio-temporal distribution characteristics of Oncomelania hupensis in Anhui Province from 2011 to 2020].Zhongguo Xue Xi Chong Bing Fang Zhi Za Zhi. 2022 Jun 24;34(3):252-258. doi: 10.16250/j.32.1374.2021288. Zhongguo Xue Xi Chong Bing Fang Zhi Za Zhi. 2022. PMID: 35896488 Chinese.
-
[Spatio-temporal variations of origin, distribution and diffusion of Oncomelania hupensis in Yangtze River Basin].Zhongguo Xue Xi Chong Bing Fang Zhi Za Zhi. 2017 Oct 24;29(6):802-806. doi: 10.16250/j.32.1374.2017156. Zhongguo Xue Xi Chong Bing Fang Zhi Za Zhi. 2017. PMID: 29469472 Review. Chinese.
-
Impact of micro-environmental factors on survival, reproduction and distribution of Oncomelania hupensis snails.Infect Dis Poverty. 2021 Apr 7;10(1):47. doi: 10.1186/s40249-021-00826-3. Infect Dis Poverty. 2021. PMID: 33827710 Free PMC article. Review.
Cited by
-
Predicting Climate Change Impact on the Habitat Suitability of the Schistosoma Intermediate Host Oncomelania hupensis in the Yangtze River Economic Belt of China.Biology (Basel). 2024 Jun 27;13(7):480. doi: 10.3390/biology13070480. Biology (Basel). 2024. PMID: 39056675 Free PMC article.
-
Factors affecting the incidence of pulmonary tuberculosis based on the GTWR model in China, 2004-2021.Epidemiol Infect. 2024 Feb 29;152:e65. doi: 10.1017/S0950268824000335. Epidemiol Infect. 2024. PMID: 38418421 Free PMC article.
-
Effects of land use change on runoff depth in the Songnen Plain, China.Sci Rep. 2024 Oct 18;14(1):24464. doi: 10.1038/s41598-024-75469-z. Sci Rep. 2024. PMID: 39424904 Free PMC article.
-
Identification of optimum scopes of environmental drivers for schistosome-transmitting Oncomelania hupensis using agent-based model in Dongting Lake Region, China.Parasitology. 2024 Oct;151(12):1355-1363. doi: 10.1017/S0031182024001306. Epub 2024 Nov 11. Parasitology. 2024. PMID: 39523644 Free PMC article.
-
Risk Prediction of Emerging Sites Infested with Schistosome-Transmitting Oncomelania hupensis in Shanghai, China.Am J Trop Med Hyg. 2025 Feb 4;112(4):804-815. doi: 10.4269/ajtmh.24-0200. Print 2025 Apr 2. Am J Trop Med Hyg. 2025. PMID: 39903930
References
-
- Lackey E.K., Horrall S. StatPearls. StatPearls Publishing LLC.; Treasure Island, FL, USA: 2022. Schistosomiasis. - PubMed
-
- World Health Organization . Ending the Neglect to Attain the Sustainable Development Goals: A Road Map for Neglected Tropical Diseases 2021–2030. World Health Organization; Geneva, Switzerland: 2020.
Grants and funding
LinkOut - more resources
Full Text Sources
Research Materials
Miscellaneous
