. 2022 Sep 3;11(9):1007.
doi: 10.3390/pathogens11091007.

Spatial and Seasonal Patterns of the Mosquito Community in Central Oklahoma

Affiliations

Spatial and Seasonal Patterns of the Mosquito Community in Central Oklahoma

David Hoekman et al. Pathogens. .

Abstract

Mosquitoes (Culicidae) are ubiquitous flying insects that function as vectors for several viruses that cause disease in humans. Mosquito abundance and diversity are influenced by landscape features and environmental factors such as temperature and precipitation and vary across seasons and years. The range and phenology of many mosquito species that vector viruses relevant to human health are changing. We sampled mosquito communities in central Oklahoma for four years at thirteen sites, collecting over 25,000 mosquitoes; among these, we identified 27 different species, including several that transmit human pathogens and were collected in suburban backyards. Community composition differed across the landscape and changed from early season to late season and year to year. This effort to describe mosquito communities in Oklahoma is a first step toward assessing and predicting arbovirus risk, an ongoing and dynamic public health challenge.

Keywords: Aedes; CDC light trap; Culex; Oklahoma; community composition; mosquito; surveillance; vectors.


Conflict of interest statement

The authors declare no conflict of interest.

Figures
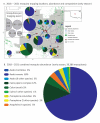
Figure 1
Figure 1
Mosquito species composition, abundance and trapping locations (2018–2021) divided into early (May–June, (A,B)) and late (July–November, (C,D)) season sampling. In panels (A,C), thirteen trapping sites in the greater Oklahoma City metro area, the red box in the Oklahoma state outline, are marked with red dots, and the mosquito relative abundance and species composition of each site are represented with pie graphs. Mosquito collection totals, scaled by collection effort, are represented by the size of the pie graphs and slices represent the proportion of the top-five species at each site. Local municipalities, reservoirs and highways are noted. In panels (B,D), combined mosquito abundance (total 25,656: about 20,000 from early season sampling and 5000 from late season sampling) from all sites and all four years are displayed by species from the most abundant to the least. Species are color-coded by genus. Species that represent less than 2% of total abundance are pooled at the genus level for clarity. All species totals and percentages are listed in Table 1, and site abundance, species richness and sampling effort are listed in Table 2. A detailed list of sites sampled in this study is provided in the Supplementary Materials (Table S1).
Figure 1
Figure 1
Mosquito species composition, abundance and trapping locations (2018–2021) divided into early (May–June, (A,B)) and late (July–November, (C,D)) season sampling. In panels (A,C), thirteen trapping sites in the greater Oklahoma City metro area, the red box in the Oklahoma state outline, are marked with red dots, and the mosquito relative abundance and species composition of each site are represented with pie graphs. Mosquito collection totals, scaled by collection effort, are represented by the size of the pie graphs and slices represent the proportion of the top-five species at each site. Local municipalities, reservoirs and highways are noted. In panels (B,D), combined mosquito abundance (total 25,656: about 20,000 from early season sampling and 5000 from late season sampling) from all sites and all four years are displayed by species from the most abundant to the least. Species are color-coded by genus. Species that represent less than 2% of total abundance are pooled at the genus level for clarity. All species totals and percentages are listed in Table 1, and site abundance, species richness and sampling effort are listed in Table 2. A detailed list of sites sampled in this study is provided in the Supplementary Materials (Table S1).
Figure 2
Figure 2
Mosquito abundance by genus throughout the trapping seasons (2018–2021 data combined). Panel (A) is the raw number (logarithmic y-axis) of mosquitoes per trapping event while (B) is the relative abundance from the same dataset. Date range is from 15 May to 16 November, but the length of the sampling season varied among years. The early/late-season dividing line is drawn at 1 July.
Figure 3
Figure 3
Non-metric multidimensional scaling ordination of mosquito communities trapped in the Oklahoma City metro area in the early season (May–June) 2018–2021. Each point represents the early season mosquito community from a particular site–year combination. Point symbols represent the year of trapping and site numbers are noted (see Figure 1 for locations). Stress is an index of fit between the actual BrayCurtis distance matrix and its representation in two-dimensional ordination space. A stress value of 0.17 is considered low to moderate [16]. The mosquito species assemblages are statistically distinct between years (ANOSIM results in text).

References

    1. Rosenberg R., Lindsey N.P., Fischer M., Gregory C.J., Hinckley A.F., Mead P.S., Paz-Bailey G., Waterman S.H., Drexler N.A., Kersh G.J., et al. Vital Signs: Trends in Reported Vectorborne Disease Cases-United States and Territories, 2004–2016. MMWR Morb. Mortal. Wkly. Rep. 2018;67:496–501. doi: 10.15585/mmwr.mm6717e1. - DOI - PMC - PubMed
    1. Leta S., Beyene T.J., De Clercq E.M., Amenu K., Kraemer M.U.G., Revie C.W. Global risk mapping for major diseases transmitted by Aedes aegypti and Aedes albopictus. Int. J. Infect. Dis. 2018;67:25–35. doi: 10.1016/j.ijid.2017.11.026. - DOI - PMC - PubMed
    1. Beard C.B., Visser S.N., Petersen L.R. The Need for a National Strategy to Address Vector-Borne Disease Threats in the United States. J. Med. Èntomol. 2019;56:1199–1203. doi: 10.1093/jme/tjz074. - DOI - PMC - PubMed
    1. Johnson M.G., Adams J., McDonald-Hamm C., Wendelboe A., Bradley K.K. Seasonality and survival associated with three outbreak seasons of West Nile virus disease in Oklahoma-2003, 2007, and 2012. J. Med. Virol. 2015;87:1633–1640. doi: 10.1002/jmv.24235. - DOI - PubMed
    1. Caldwell J.M., LaBeaud A.D., Lambin E.F., Stewart-Ibarra A.M., Ndenga B.A., Mutuku F.M., Krystosik A.R., Ayala E.B., Anyamba A., Borbor-Cordova M.J., et al. Climate predicts geographic and temporal variation in mosquito-borne disease dynamics on two continents. Nat. Commun. 2021;12:1233. doi: 10.1038/s41467-021-21496-7. - DOI - PMC - PubMed

LinkOut - more resources