. 2022 Aug 23;14(9):1759.
doi: 10.3390/pharmaceutics14091759.

Two-in-One Nanoparticle Formulation to Deliver a Tyrosine Kinase Inhibitor and microRNA for Targeting Metabolic Reprogramming and Mitochondrial Dysfunction in Gastric Cancer

Affiliations

Two-in-One Nanoparticle Formulation to Deliver a Tyrosine Kinase Inhibitor and microRNA for Targeting Metabolic Reprogramming and Mitochondrial Dysfunction in Gastric Cancer

Yu-Li Lo et al. Pharmaceutics. .

Abstract

Dysregulational EGFR, KRAS, and mTOR pathways cause metabolic reprogramming, leading to progression of gastric cancer. Afatinib (Afa) is a broad-spectrum tyrosine kinase inhibitor that reduces cancer growth by blocking the EGFR family. MicroRNA 125 (miR-125) reportedly diminishes EGFRs, glycolysis, and anti-apoptosis. Here, a one-shot formulation of miR-125 and Afa was presented for the first time. The formulation comprised solid lipid nanoparticles modified with mitochondrial targeting peptide and EGFR-directed ligand to suppress pan-ErbB-facilitated epithelial-mesenchymal transition and mTOR-mediated metabolism discoordination of glycolysis-glutaminolysis-lipids. Results showed that this cotreatment modulated numerous critical proteins, such as EGFR/HER2/HER3, Kras/ERK/Vimentin, and mTOR/HIF1-α/HK2/LDHA pathways of gastric adenocarcinoma AGS cells. The combinatorial therapy suppressed glutaminolysis, glycolysis, mitochondrial oxidative phosphorylation, and fatty acid synthesis. The cotreatment also notably decreased the levels of lactate, acetyl-CoA, and ATP. The active involvement of mitophagy supported the direction of promoting the apoptosis of AGS cells, which subsequently caused the breakdown of tumor-cell homeostasis and death. In vivo findings in AGS-bearing mice confirmed the superiority of the anti-tumor efficacy and safety of this combination nanomedicine over other formulations. This one-shot formulation disturbed the metabolic reprogramming; alleviated the "Warburg effect" of tumors; interrupted the supply of fatty acid, cholesterol, and triglyceride; and exacerbated the energy depletion in the tumor microenvironment, thereby inhibiting tumor proliferation and aggressiveness. Collectively, the results showed that the two-in-one nanoparticle formulation of miR-125 and Afa was a breakthrough in simplifying drug preparation and administration, as well as effectively inhibiting tumor progression through the versatile targeting of pan-ErbB- and mTOR-mediated mitochondrial dysfunction and dysregulated metabolism.

Keywords: microRNA; mitochondrial dysfunction; mitochondrial targeting; nanoparticle; tumor metabolism reprogramming; tyrosine kinase inhibitor.


Conflict of interest statement

The authors declare no conflict of interest. The funders had no role in the design of the study; in the collection, analyses, or interpretation of data; in the writing of the manuscript, or in the decision to publish the results.

Figures

Figure 1
Figure 1
Rationale and physicochemical characterization of different miR-125 and/or Afa formulations. (A) Rationale of reprogramming metabolic dysregulation and dysfunctional mitochondria in AGS cells by miR-125 + Afa/SLN-KL. (B) Conjugation of DSPE-PEG to (up) K peptide and (down) L peptide. (C) Sizes and zeta potential of (left) miR-125/SLN-KL, (middle) Afa/SLN-KL, and (right) miR-125 + Afa/SLN-KL, as measured by Malvern Zetasizer. (D) TEM images of (left) miR-125/SLN-KL, (middle) Afa/SLN-KL, and (right) miR-125 + Afa/SLN-KL, as observed using JEM-2000EXII TEM. Scale bar, 100 nm. (E) In vitro release profiles of miR-125 and/or Afa from SLN-KL.
Figure 1
Figure 1
Rationale and physicochemical characterization of different miR-125 and/or Afa formulations. (A) Rationale of reprogramming metabolic dysregulation and dysfunctional mitochondria in AGS cells by miR-125 + Afa/SLN-KL. (B) Conjugation of DSPE-PEG to (up) K peptide and (down) L peptide. (C) Sizes and zeta potential of (left) miR-125/SLN-KL, (middle) Afa/SLN-KL, and (right) miR-125 + Afa/SLN-KL, as measured by Malvern Zetasizer. (D) TEM images of (left) miR-125/SLN-KL, (middle) Afa/SLN-KL, and (right) miR-125 + Afa/SLN-KL, as observed using JEM-2000EXII TEM. Scale bar, 100 nm. (E) In vitro release profiles of miR-125 and/or Afa from SLN-KL.
Figure 2
Figure 2
Cytotoxicity, cellular uptake, and intracellular trafficking of different Afa and/or miR-125 formulations. (A) Cytotoxicity of Afa and/or miR-125 formulations on (left) AGS cells and (right) IEC-6 cells for 48 h at IC30 dose of Afa (300 nM). Cell viability was determined by sulforhodamine B (SRB) assay (NS, not significant; statistical significance at * p < 0.05; ** p < 0.01; *** p < 0.001). (B) Measurement of intracellular intensity of (left) FAM-miR-125 (100 nM) and (right) DiI-Afa (100 ng/mL) in various formulations for 24 h in AGS cells by flow cytometry. (C) Intracellular trafficking of FAM-miR-125 + Afa/SLN-KL in AGS cells for 0/0.5, 3, and 24 h. FAM-miR-125: 100 nM; Afa: 300 nM. Blue: DAPI (a nuclear dye); red: MitoRed (a mitochondrial dye); green: FAM-miR-125 (a fluorescent miR-125); gray: Cy5-Anti-EGFR. Scale Bar, 20 µm. (D) Intracellular trafficking of miR-125 + DiI/SLN-KL in AGS cells for 3, 8, and 24 h. MiR-125: 100 nM; DiI: 100 ng/mL. Blue: DAPI (a nuclear dye); green: MitoGreen (a mitochondrial dye); red: DiI (a probe of Afa); gray: Cy5-Anti-EGFR. Scale bar, 20 µm.
Figure 2
Figure 2
Cytotoxicity, cellular uptake, and intracellular trafficking of different Afa and/or miR-125 formulations. (A) Cytotoxicity of Afa and/or miR-125 formulations on (left) AGS cells and (right) IEC-6 cells for 48 h at IC30 dose of Afa (300 nM). Cell viability was determined by sulforhodamine B (SRB) assay (NS, not significant; statistical significance at * p < 0.05; ** p < 0.01; *** p < 0.001). (B) Measurement of intracellular intensity of (left) FAM-miR-125 (100 nM) and (right) DiI-Afa (100 ng/mL) in various formulations for 24 h in AGS cells by flow cytometry. (C) Intracellular trafficking of FAM-miR-125 + Afa/SLN-KL in AGS cells for 0/0.5, 3, and 24 h. FAM-miR-125: 100 nM; Afa: 300 nM. Blue: DAPI (a nuclear dye); red: MitoRed (a mitochondrial dye); green: FAM-miR-125 (a fluorescent miR-125); gray: Cy5-Anti-EGFR. Scale Bar, 20 µm. (D) Intracellular trafficking of miR-125 + DiI/SLN-KL in AGS cells for 3, 8, and 24 h. MiR-125: 100 nM; DiI: 100 ng/mL. Blue: DAPI (a nuclear dye); green: MitoGreen (a mitochondrial dye); red: DiI (a probe of Afa); gray: Cy5-Anti-EGFR. Scale bar, 20 µm.
Figure 3
Figure 3
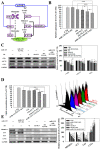
Effects of various miR-125 and/or Afa formulations on EGFR pathway in AGS cells. (A) Scheme of EGFR pathway. (B) (Left) Effect of various formulations of miR-125 (100 nM) and/or Afa (IC30: 300 nM) on expression of PI3K/Akt/mTOR pathway after treatment for 24 h on AGS cells. (Right) Quantification of relative protein levels of PI3K/Akt/mTOR pathway. (C) (Left) Effect of various formulations of miR-125 (100 nM) and/or Afa (IC30: 300 nM) on expression of Kras/Erk pathway after treatment for 24 h on AGS cells. (Right) Quantification of the relative protein levels of Kras/Erk pathway. (B,C) * p < 0.05 compared with control (CTR),  p < 0.05 compared with miR-125/SLN-KL,  p < 0.05 compared with Afa,  p < 0.05 compared with Afa/SLN, and § p < 0.05 compared with Afa/SLN-KL by using Student’s t-test analysis. (D) (Right) Migration assay after treatment of various formulations for 15 h. (Left) Quantification of relative percentages of cell-migration area. Migration area (% of area at 0 h) = 100% − (Blank area (15 h)/Blank area (0 h) × 100% (NS, not significant; statistical significance at ** p < 0.01; *** p < 0.001).
Figure 4
Figure 4
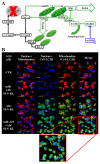
Effects of miR-125 (100 nM)- and/or Afa (300 nM)-loaded formulations on glycolysis pathway-related factors in AGS cells after 24 h treatment. (A) Scheme of glycolysis pathway. (B) Measurement of relative levels of acetyl-CoA, lactate, and ATP by using a multifunctional microplate reader. (C) (Left) Measurement of glucose uptake by detecting fluorescent analog of glucose (2-NBDG, 2-deoxy-2-[(7-nitro-2,1,3-benzoxadiazol-4-yl)amino]-D-glucose; 20 mM) with the use of a flow cytometer (statistical significance at *** p < 0.001). (Right) Histogram plots of fluorescent 2-NBDG after various treatments in AGS cells. (D) (Left) Effect of various formulations on the expression of proteins in glycolysis-related pathway. (Right) Quantification of relative protein levels in glycolysis-related pathway. (B,D) * p < 0.05: compared with CTR,  p < 0.05 compared with miR-125/SLN-KL,  p < 0.05 compared with Afa,  p < 0.05 compared with Afa/SLN, and § p < 0.05 compared with Afa/SLN-KL via Student’s t-test analysis. (E) Measurement of (left) oxygen consumption rate (OCR) and (right) extracellular acidification rate (ECAR) by using an XFe24 analyzer.
Figure 5
Figure 5
Effects of various formulations of miR-125 (100 nM) and/or Afa (300 nM) for 24 h on the pathways of glutaminolysis and fatty acid metabolism in AGS cells. (A) Scheme of glutaminolysis and fatty acid metabolism. (B) Measurement of relative glutamate levels by using a multifunctional microplate reader (statistical significance at * p < 0.05; *** p < 0.001). (C) (Left) Effect of various formulations of Afa and/or miR-125 on the expression of glutaminolysis pathway. (Right) Quantification of relative protein levels of glutaminolysis pathway. (D) (Left) Measurement of lipid accumulation by measuring a fluorescent lipid probe (4,4-Difluoro-1,3,5,7,8-Pentamethyl-4-Bora-3a,4a-Diaza-s-Indacene; BODIPY™; 100 mM) using a flow cytometer (statistical significance at *** p < 0.001). (Right) Histogram plots of fluorescence distribution of BODIPY™ after various treatments in AGS cells. (E) (Left) Effect of various formulations on protein expression in the pathway of fatty acid metabolism. (Right) Quantification of relative protein levels of fatty acid metabolism pathway. (C,E) * p < 0.05 compared with CTR,  p < 0.05 compared with miR-125/SLN-KL,  p < 0.05 compared with Afa,  p < 0.05 compared with Afa/SLN, and § p < 0.05 compared with Afa/SLN-KL via Student’s t-test analysis.
Figure 6
Figure 6
Effects of various miR-125 (100 nM) and/or Afa (300 nM) formulations on mitophagy and mitochondrion-mediated apoptosis pathway after 24 h treatment in AGS cells. (A) Scheme of mitophagy and mitochondrion-mediated apoptosis pathway (↑: increase; ↓: decrease). (B) Images of various formulations on mitophagy by using confocal laser scanning microscopy (CLSM). Blue: DAPI (a nuclear dye); red: MitoRed (a mitochondrial dye); green: Cy5-LC3II (a marker of autophagy). Scale bar, 20 µm. (C) Measurement of mitochondrial membrane potential (MMP; ΔΨm) by using MMP kit (JC-1; 5,5′,6,6′-tetrachloro-1,1′,3,3′-tetraethyl benzimidazolo-carbocyanine iodide; 5 mg/mL) by flow cytometry (statistical significance at *** p < 0.001). (D) Measurement of mitochondrial reactive oxygen species (ROS by using a fluorescent kit (mitoSOX™) by flow cytometry (statistical significance at *** p < 0.001). (E) (Up) Effect of various formulations on the expression of mitophagy and mitochondrion-mediated apoptosis pathway. (Down) Quantification of relative protein levels of mitophagy and mitochondrion-mediated apoptosis pathway. * p < 0.05 compared with CTR,  p < 0.05 compared with miR-125/SLN-KL,  p < 0.05 compared with Afa,  p < 0.05 compared with Afa/SLN, and § p < 0.05 compared with Afa/SLN-KL via Student’s t-test analysis. (F) (Left) Measurement of apoptosis percentages by detecting Annexin V/PI kit with the use of a flow cytometer. (Right) Quantification of relative cell population percentages from Annexin V/PI assay. * p < 0.05 compared with CTR, # p < 0.05 compared with SLN-KL,  p < 0.05 compared with miR-125/SLN-KL,  p < 0.05 compared with Afa,  p < 0.05 compared with Afa/SLN, & p < 0.05 compared with Afa/SLN-KL, and § p < 0.05 compared with miR-125/SLN-KL + Afa/SLN-KL via Student’s t-test analysis.
Figure 6
Figure 6
Effects of various miR-125 (100 nM) and/or Afa (300 nM) formulations on mitophagy and mitochondrion-mediated apoptosis pathway after 24 h treatment in AGS cells. (A) Scheme of mitophagy and mitochondrion-mediated apoptosis pathway (↑: increase; ↓: decrease). (B) Images of various formulations on mitophagy by using confocal laser scanning microscopy (CLSM). Blue: DAPI (a nuclear dye); red: MitoRed (a mitochondrial dye); green: Cy5-LC3II (a marker of autophagy). Scale bar, 20 µm. (C) Measurement of mitochondrial membrane potential (MMP; ΔΨm) by using MMP kit (JC-1; 5,5′,6,6′-tetrachloro-1,1′,3,3′-tetraethyl benzimidazolo-carbocyanine iodide; 5 mg/mL) by flow cytometry (statistical significance at *** p < 0.001). (D) Measurement of mitochondrial reactive oxygen species (ROS by using a fluorescent kit (mitoSOX™) by flow cytometry (statistical significance at *** p < 0.001). (E) (Up) Effect of various formulations on the expression of mitophagy and mitochondrion-mediated apoptosis pathway. (Down) Quantification of relative protein levels of mitophagy and mitochondrion-mediated apoptosis pathway. * p < 0.05 compared with CTR,  p < 0.05 compared with miR-125/SLN-KL,  p < 0.05 compared with Afa,  p < 0.05 compared with Afa/SLN, and § p < 0.05 compared with Afa/SLN-KL via Student’s t-test analysis. (F) (Left) Measurement of apoptosis percentages by detecting Annexin V/PI kit with the use of a flow cytometer. (Right) Quantification of relative cell population percentages from Annexin V/PI assay. * p < 0.05 compared with CTR, # p < 0.05 compared with SLN-KL,  p < 0.05 compared with miR-125/SLN-KL,  p < 0.05 compared with Afa,  p < 0.05 compared with Afa/SLN, & p < 0.05 compared with Afa/SLN-KL, and § p < 0.05 compared with miR-125/SLN-KL + Afa/SLN-KL via Student’s t-test analysis.
Figure 7
Figure 7
Anti-tumor efficacy of different Afa and/or miR-125 formulations on AGS-bearing mice. (A) Measurement of tumor volume by digital calipers every 4 days in mice treated with various formulations of Afa (5 mg/kg) and/or miR-125 (1.25 mg/kg) during 14-day therapy (statistical significance at * p < 0.05; ** p < 0.01). (B) PET/CT images of AGS-bearing mice by using a radiant PET/CT probe ([18F]-2-deoxy-2-fluoro-D-glucose; 18F-FDG; 0.282 mCi). (C) TUNEL analysis of AGS-bearing mice after completing 14-day therapy. In vivo apoptosis in tumor cells was marked (green) and the nuclei (blue) were stained with Hoechst. Scale bar, 200 µm.
Figure 8
Figure 8
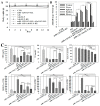
Biosafety and biodistribution studies of various formulations of Afa (5 mg/kg) and/or miR-125 (1.25 mg/kg) in AGS-bearing mice. (A) Measurement of body weight of AGS-bearing mice every 4 days after treatment with various formulations for 14 days. (B) Biodistribution study of different formulations after completion of 14-day therapy. (C) Blood biochemical indices of glucose (GLU), cholesterol (CHO), and triglycerides (TGs) and functions of liver by glutamic pyruvic transaminase (GPT), kidney by blood urea nitrogen (BUN), and heart by creatine kinase-MB (CK-MB) after finishing 14-day therapy. For (B, C): NS, not significant; statistical significance at * p < 0.05; ** p < 0.01; *** p < 0.001. (D) Histological photomicrographs of the tumor, stomach, kidneys, liver, heart, and intestinal sections in AGS-bearing mice after completion of 14-day therapy, as stained by H&E. Red circles indicated regions of necrosis or apoptosis, and yellow arrows denoted signs of inflammation. Scale bar, 200 μm. (E) Overall scheme of reprograming of dysregulated metabolism and dysfunctional mitochondria in AGS cells by miR-125 + Afa/SLN-KL (↑: increase; ↓: decrease).
Figure 8
Figure 8
Biosafety and biodistribution studies of various formulations of Afa (5 mg/kg) and/or miR-125 (1.25 mg/kg) in AGS-bearing mice. (A) Measurement of body weight of AGS-bearing mice every 4 days after treatment with various formulations for 14 days. (B) Biodistribution study of different formulations after completion of 14-day therapy. (C) Blood biochemical indices of glucose (GLU), cholesterol (CHO), and triglycerides (TGs) and functions of liver by glutamic pyruvic transaminase (GPT), kidney by blood urea nitrogen (BUN), and heart by creatine kinase-MB (CK-MB) after finishing 14-day therapy. For (B, C): NS, not significant; statistical significance at * p < 0.05; ** p < 0.01; *** p < 0.001. (D) Histological photomicrographs of the tumor, stomach, kidneys, liver, heart, and intestinal sections in AGS-bearing mice after completion of 14-day therapy, as stained by H&E. Red circles indicated regions of necrosis or apoptosis, and yellow arrows denoted signs of inflammation. Scale bar, 200 μm. (E) Overall scheme of reprograming of dysregulated metabolism and dysfunctional mitochondria in AGS cells by miR-125 + Afa/SLN-KL (↑: increase; ↓: decrease).

Similar articles

Cited by

References

    1. Ebert K., Zwingenberger G., Barbaria E., Keller S., Heck C., Arnold R., Hollerieth V., Mattes J., Geffers R., Raimúndez E., et al. Determining the effects of trastuzumab, cetuximab and afatinib by phosphoprotein, gene expression and phenotypic analysis in gastric cancer cell lines. BMC Cancer. 2020;20:1039. - PMC - PubMed
    1. Corso S., Pietrantonio F., Apicella M., Migliore C., Conticelli D., Petrelli A., D’Errico L., Durando S., Moya-Rull D., Bellomo S.E., et al. Optimized EGFR blockade strategies in EGFR addicted gastroesophageal adenocarcinomas. Clin. Cancer Res. 2021;27:3126–3140. doi: 10.1158/1078-0432.CCR-20-0121. - DOI - PubMed
    1. Liu Z., Shi M., Li X., Song S., Liu N., Du H., Ye J., Li H., Zhang Z., Zhang L. HER2 copy number as predictor of disease-free survival in HER2-positive resectable gastric adenocarcinoma. J. Cancer Res. Clin. Oncol. 2021;147:1315–1324. doi: 10.1007/s00432-021-03522-9. - DOI - PMC - PubMed
    1. Ricci A.D., Rizzo A., Rojas Llimpe F.L., Di Fabio F., De Biase D., Rihawi K. Novel HER2-Directed Treatments in Advanced Gastric Carcinoma: AnotHER Paradigm Shift. Cancers. 2021;13:1664. doi: 10.3390/cancers13071664. - DOI - PMC - PubMed
    1. Chen Z., Liu Z., Zhang M., Huang W., Li Z., Wang S., Zhang C., Dong B., Gao J., Shen L. EPHA2 blockade reverses acquired resistance to afatinib induced by EPHA2-mediated MAPK pathway activation in gastric cancer cells and avatar mice. Int. J. Cancer. 2019;145:2440–2449. doi: 10.1002/ijc.32313. - DOI - PubMed