

A GBS-Based GWAS Analysis of Leaf and Stripe Rust Resistance in Diverse Pre-Breeding Germplasm of Bread Wheat (Triticum aestivum L.)
- PMID: 36145764
- PMCID: PMC9504680
- DOI: 10.3390/plants11182363
A GBS-Based GWAS Analysis of Leaf and Stripe Rust Resistance in Diverse Pre-Breeding Germplasm of Bread Wheat (Triticum aestivum L.)
Abstract
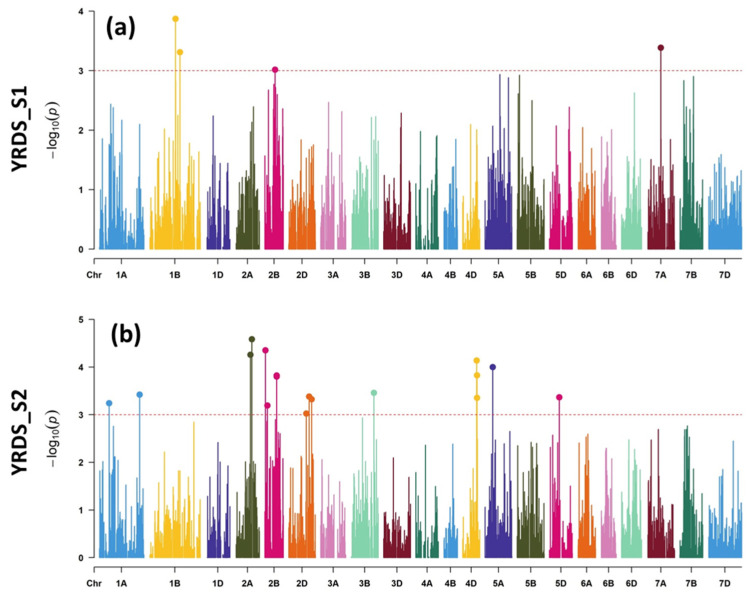
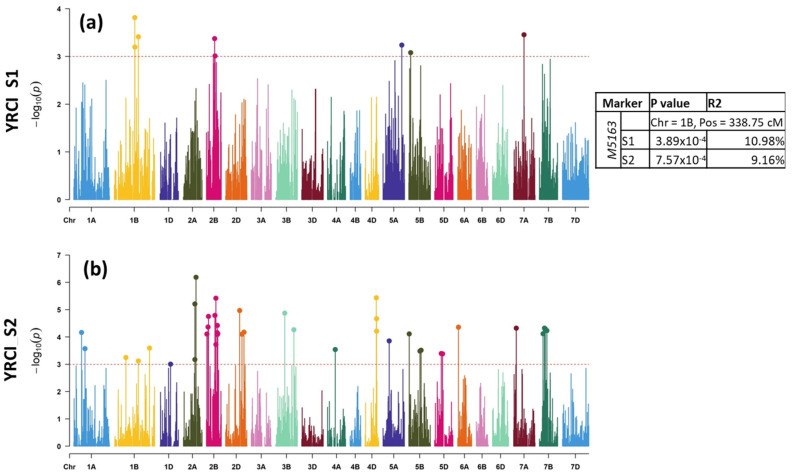
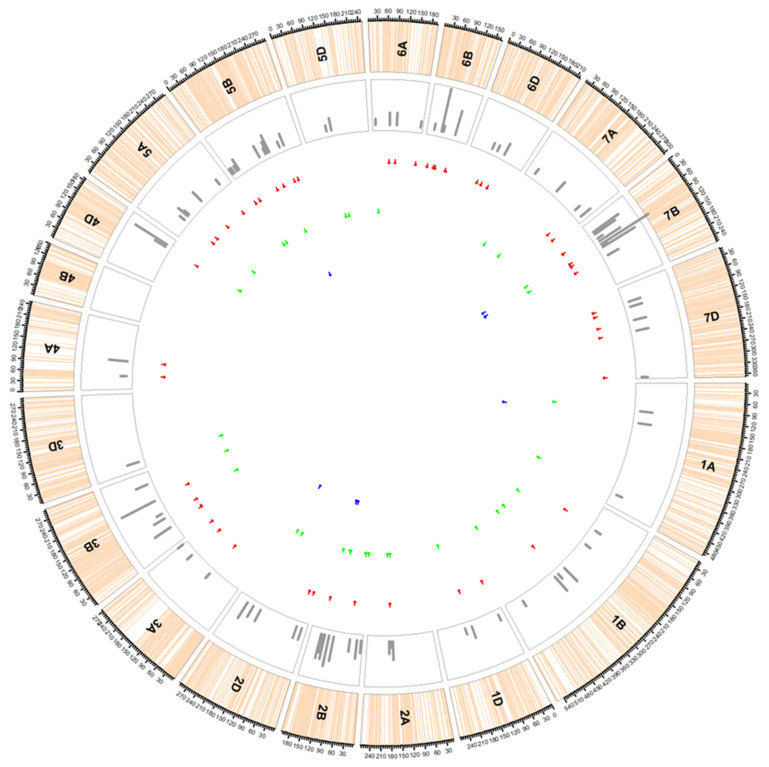
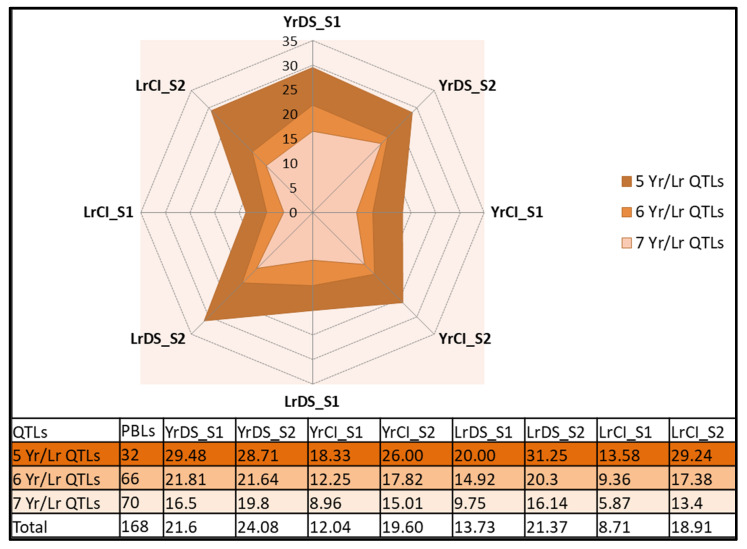
Yellow (YR) and leaf (LR) rusts caused by Puccinia striiformis f. sp. tritici (Pst) and Puccinia triticina, respectively, are of utmost importance to wheat producers because of their qualitative and quantitative effect on yield. The search for new loci resistant to both rusts is an ongoing challenge faced by plant breeders and pathologists. Our investigation was conducted on a subset of 168 pre-breeding lines (PBLs) to identify the resistant germplasm against the prevalent local races of LR and YR under field conditions followed by its genetic mapping. Our analysis revealed a range of phenotypic responses towards both rusts. We identified 28 wheat lines with immune response and 85 resistant wheat genotypes against LR, whereas there were only eight immune and 52 resistant genotypes against YR. A GWAS (genome-wide association study) identified 190 marker-trait associations (MTAs), where 120 were specific to LR and 70 were specific to YR. These MTAs were confined to 86 quantitative trait loci (QTLs), where 50 QTLs carried MTAs associated with only LR, 29 QTLs carried MTAs associated with YR, and seven QTLs carried MTAs associated with both LR and YR. Possible candidate genes at the site of these QTLs are discussed. Overall, 70 PBLs carried all seven LR/YR QTLs. Furthermore, there were five PBLs with less than five scores for both LR and YR carrying positive alleles of all seven YR/LR QTLs, which are fit to be included in a breeding program for rust resistance induction.
Keywords: GWAS; breeding; leaf rust; resistance; wheat; yellow rust.
Conflict of interest statement
The authors declare no conflict of interest.
Figures
Similar articles
-
Genome-Wide Mapping of Adult Plant Resistance to Leaf Rust and Stripe Rust in CIMMYT Wheat Line Arableu#1.Plant Dis. 2020 May;104(5):1455-1464. doi: 10.1094/PDIS-10-19-2198-RE. Epub 2020 Mar 20. Plant Dis. 2020. PMID: 32196419
-
Genome-wide association study of common resistance to rust species in tetraploid wheat.Front Plant Sci. 2024 Jan 3;14:1290643. doi: 10.3389/fpls.2023.1290643. eCollection 2023. Front Plant Sci. 2024. PMID: 38235202 Free PMC article.
-
Genome-wide association mapping for resistance to leaf, stem, and yellow rusts of common wheat under field conditions of South Kazakhstan.PeerJ. 2020 Aug 31;8:e9820. doi: 10.7717/peerj.9820. eCollection 2020. PeerJ. 2020. PMID: 32944423 Free PMC article.
-
Fusarium Head Blight and Rust Diseases in Soft Red Winter Wheat in the Southeast United States: State of the Art, Challenges and Future Perspective for Breeding.Front Plant Sci. 2020 Jul 16;11:1080. doi: 10.3389/fpls.2020.01080. eCollection 2020. Front Plant Sci. 2020. PMID: 32765563 Free PMC article. Review.
-
Wheat stripe (yellow) rust caused by Puccinia striiformis f. sp. tritici.Mol Plant Pathol. 2014 Jun;15(5):433-46. doi: 10.1111/mpp.12116. Mol Plant Pathol. 2014. PMID: 24373199 Free PMC article. Review.
Cited by
-
Broad-spectrum resistance to fungal foliar diseases in wheat: recent efforts and achievements.Front Plant Sci. 2024 Dec 13;15:1516317. doi: 10.3389/fpls.2024.1516317. eCollection 2024. Front Plant Sci. 2024. PMID: 39735771 Free PMC article. Review.
-
The Integration of Genome-Wide Association Study and Homology Analysis to Explore the Genomic Regions and Candidate Genes for Panicle-Related Traits in Foxtail Millet.Int J Mol Sci. 2022 Nov 25;23(23):14735. doi: 10.3390/ijms232314735. Int J Mol Sci. 2022. PMID: 36499063 Free PMC article.
-
Genetic Analyses of Seed Longevity in Capsicum annuum L. in Cold Storage Conditions.Plants (Basel). 2023 Mar 14;12(6):1321. doi: 10.3390/plants12061321. Plants (Basel). 2023. PMID: 36987009 Free PMC article.
References
-
- Savadi S., Prasad P., Kashyap P.L., Bhardwaj S.C. Molecular breeding technologies and strategies for rust resistance in wheat (Triticum aestivum) for sustained food security. Plant Pathol. 2018;67:771–791. doi: 10.1111/ppa.12802. - DOI
-
- Chen X. Epidemiology and control of stripe rust [Puccinia striiformis f. sp. tritici] on wheat. Can. J. Plant Pathol. 2005;27:314–337. doi: 10.1080/07060660509507230. - DOI
-
- Chen X., Kang Z. Stripe Rust. Springer; Berlin/Heidelberg, Germany: 2017. Introduction: History of research, symptoms, taxonomy of the pathogen, host range, distribution, and impact of stripe rust; pp. 1–33.
Grants and funding
LinkOut - more resources
Full Text Sources
