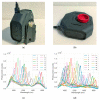
Handheld NIR Spectral Sensor Module Based on a Fully-Integrated Detector Array
- PMID: 36146377
- PMCID: PMC9501814
- DOI: 10.3390/s22187027
Handheld NIR Spectral Sensor Module Based on a Fully-Integrated Detector Array
Abstract
For decades, near-infrared (NIR) spectroscopy has been a valuable tool for material analysis in a variety of applications, ranging from industrial process monitoring to quality assessment. Traditional spectrometers are typically bulky, fragile and expensive, which makes them unsuitable for portable and in-field use. Thus, there is a growing interest for miniaturized, robust and low-cost NIR sensors. In this study, we demonstrate a handheld NIR spectral sensor module, based on a fully-integrated multipixel detector array, sensitive in the 850-1700 nm wavelength range. Differently from a spectrometer, the spectral sensor measures a limited number of NIR spectral bands. The capabilities of the spectral sensor module were evaluated alongside a commercially available portable spectrometer for two application cases: to quantify the moisture content in rice grains and to classify plastic types. Both devices achieved the two sensing tasks with comparable performance. Moisture quantification was achieved with a root mean square error (RMSE) prediction of 1.4% and 1.1% by the spectral sensor and spectrometer, respectively. Classification of the plastic type was achieved with a prediction accuracy on unknown samples of 100% and 96.4% by the spectral sensor and spectrometer, respectively. The results from this study are promising and demonstrate the potential for the compact NIR modules to be used in a variety of NIR sensing applications.
Keywords: integrated photonics; near-infrared; portable devices; sensors; spectral sensing.
Conflict of interest statement
F.O., P.S., M.P., K.D.H. and F.P. are employees and M.P., F.P. and A.F. are shareholders and co-founders of MantiSpectra B.V., the company commercializing the sensor. The remaining authors declare no competing interests.
Figures


Similar articles
-
Application of near-infrared handheld spectrometers to predict semolina quality.J Sci Food Agric. 2021 Jan 15;101(1):151-157. doi: 10.1002/jsfa.10625. Epub 2020 Aug 3. J Sci Food Agric. 2021. PMID: 32613617
-
Sequential fusion of information from two portable spectrometers for improved prediction of moisture and soluble solids content in pear fruit.Talanta. 2021 Feb 1;223(Pt 2):121733. doi: 10.1016/j.talanta.2020.121733. Epub 2020 Oct 13. Talanta. 2021. PMID: 33298261
-
Insect Protein Content Analysis in Handcrafted Fitness Bars by NIR Spectroscopy. Gaussian Process Regression and Data Fusion for Performance Enhancement of Miniaturized Cost-Effective Consumer-Grade Sensors.Molecules. 2021 Oct 22;26(21):6390. doi: 10.3390/molecules26216390. Molecules. 2021. PMID: 34770798 Free PMC article.
-
Miniaturized NIR Spectroscopy in Food Analysis and Quality Control: Promises, Challenges, and Perspectives.Foods. 2022 May 18;11(10):1465. doi: 10.3390/foods11101465. Foods. 2022. PMID: 35627034 Free PMC article. Review.
-
Recent Advances in Portable and Handheld NIR Spectrometers and Applications in Milk, Cheese and Dairy Powders.Foods. 2021 Oct 8;10(10):2377. doi: 10.3390/foods10102377. Foods. 2021. PMID: 34681426 Free PMC article. Review.
Cited by
-
Using Fuzzy Logic to Increase Accuracy in Mango Maturity Index Classification: Approach for Developing a Portable Near-Infrared Spectroscopy Device.Sensors (Basel). 2022 Dec 11;22(24):9704. doi: 10.3390/s22249704. Sensors (Basel). 2022. PMID: 36560072 Free PMC article.
-
LED-Based Desktop Analyzer for Fat Content Determination in Milk.Sensors (Basel). 2023 Aug 1;23(15):6861. doi: 10.3390/s23156861. Sensors (Basel). 2023. PMID: 37571644 Free PMC article.
-
Machine Learning-Based Identification of Plastic Types Using Handheld Spectrometers.Sensors (Basel). 2025 Jun 17;25(12):3777. doi: 10.3390/s25123777. Sensors (Basel). 2025. PMID: 40573663 Free PMC article.
-
Quantum dot-enabled infrared hyperspectral imaging with single-pixel detection.Light Sci Appl. 2024 May 28;13(1):121. doi: 10.1038/s41377-024-01476-4. Light Sci Appl. 2024. PMID: 38802359 Free PMC article.
-
Portable NIR spectroscopy: the route to green analytical chemistry.Front Chem. 2023 Sep 25;11:1214825. doi: 10.3389/fchem.2023.1214825. eCollection 2023. Front Chem. 2023. PMID: 37818482 Free PMC article. Review.
References
-
- Heinrich Grüger T., Knobbe J., Pügner T., Grüger H. MEMS based NIR spectrometer with extended spectral range. Proc. SPIE. 2019;10931:45–54.
-
- Peter Reinig S., Grüger H., Knobbe J., Pügner T., Meyer S. Bringing NIR spectrometers into mobile phones. Proc. SPIE. 2018;10545:97–104.
MeSH terms
Substances
Grants and funding
LinkOut - more resources
Full Text Sources
Miscellaneous

