. 2022 Sep 3;10(9):1459.
doi: 10.3390/vaccines10091459.

Longitudinal Comparison of Neutralizing Antibody Responses to COVID-19 mRNA Vaccines after Second and Third Doses

Affiliations

Longitudinal Comparison of Neutralizing Antibody Responses to COVID-19 mRNA Vaccines after Second and Third Doses

Alexa J Roeder et al. Vaccines (Basel). .

Abstract

COVID-19 mRNA vaccines protect against severe disease and hospitalization. Neutralizing antibodies (NAbs) are a first-line defense mechanism, but protective NAb responses are variable. Currently, NAb testing is not widely available. This study employed a lateral flow assay for monitoring NAb levels postvaccination and natural infection, using a finger-stick drop of blood. We report longitudinal NAb data from BNT162b2 (Pfizer) and mRNA-1273 (Moderna) recipients after second and third doses. Results demonstrate a third dose of mRNA vaccine elicits higher and more durable NAb titers than the second dose, independent of manufacturer, sex, and age. Our analyses also revealed that vaccinated individuals could be categorized as strong, moderate, and poorly neutralizing responders. After the second dose, 34% of subjects were classified as strong responders, compared to 79% after the third dose. The final months of this study coincided with the emergence of the SARS-CoV-2 Omicron variant and symptomatic breakthrough infections within our study population. Lastly, we show that NAb levels sufficient for protection from symptomatic infection with early SARS-CoV-2 variants were not protective against Omicron infection and disease. This work highlights the need for accessible vaccine response monitoring for use in healthcare, such that individuals, particularly those in vulnerable populations, can make informed vaccination decisions.

Keywords: SARS-CoV-2; lateral flow assay; mRNA vaccines; neutralizing antibody.


Conflict of interest statement

D.F.L. and S.S. are co-founders of Sapphire, the research division of AXIM Biotechnologies. S.S., M.G.M., and A.S.-N. are employed by AXIM. All other authors have no competing interests to declare, and no financial relationships with any organizations that might have an interest in the submitted work in the previous three years.

Figures

Figure 1
Figure 1
Schematic diagram of NAb LFA principle/mechanism. (1) Fingerstick blood is obtained using a pressure-activated safety lancet. (2) Ten microliters of blood are transferred to the sample port on a test cassette. (3) Buffer is applied to the sample port. (Left to right) RBD of spike (blue) is shown coupled to a green-gold nanoshell (green-GNS). Non-neutralizing antibodies (gold) are shown to bind outside of the RBD, such that in outcome (A) RBD-GNS is available to bind ACE2, seen as a strong test line. Neutralizing antibodies (maroon) are shown binding to RBD, obstructing the interaction between antigen and receptor, such that in outcome (B) RBD does not bind to ACE2, observed as a faint or absent test line.
Figure 2
Figure 2
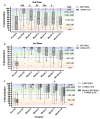
Overall comparison of second- and third-dose COVID-19 mRNA vaccine-induced NAb durability. (A) Second dose; (B) third dose. Gray circles represent percent neutralization from each study participant vaccinated with either BNT162b2 or mRNA-1273 within one week prior to vaccination (Pre-2nd), 2–4 weeks postvaccination (Post-2nd), then monthly after either second or third doses. The horizontal black lines with error bars represent mean with 95% confidence intervals. Dotted line is 50% neutralization. Numbers above each x-axis time point indicate the number of participants. Reciprocal titer ranges corresponding to % neutralization are shown on the graphs as shaded purple (≥1:640), blue (<1:640, ≥1:320), green (<1:320, >1:160), light grey (<1:160, ≥1:80), orange (<1:80, ≥1:40), and red (<1:40) as reported in [18]. Percent neutralization was calculated as 1-(test line density/limit of detection) x100% (limit of detection test line density = 942,481), as detailed previously [18].
Figure 3
Figure 3
NAb durability of second and third mRNA vaccine doses by manufacturer. NAb test timepoints represented as percent neutralization are pre-2nd/3rd (within one week), post-2nd/3rd (2–4 weeks after second or third dose), and monthly for 6–8 months after vaccination. (A) Longitudinal 2nd-dose data of BNT162b2 (Pfizer) in comparison to mRNA-1273 (Moderna). (B) Longitudinal 3rd-dose data. (C) Longitudinal 3rd-dose data of individuals that received the same vaccine type for all three vaccine doses, in comparison to individuals that received two Pfizer doses and a Moderna booster dose. Data are shown as grouped box and whisker plots with error bars representing 5th–95th percentile of each population. Outliers outside of the 5th–95th percentile are shown as circular symbols above or below error bars. Graphs A and B data were analyzed using nonparametric Mann–Whitney test to evaluate mean rank between groups with a two-tailed p-value (p < 0.05) and 95% confidence interval (CI). Graph C data were analyzed using a nonparametric Kruskal–Wallis test to evaluate mean rank between groups using multiple comparisons (two-tailed p < 0.05 and 95% CI). Titers corresponding to percent neutralization ranges are described (see Figure 2 legend). * p < 0.05, ** p <0.005, *** p < 0.0005.
Figure 4
Figure 4
Second and third vaccine dose grouping analyses of unpaired longitudinal NAb data. (A,B) Unsupervised hierarchical clustering analysis performed using (A) 265 s dose subjects with percent neutralization data collected at pre-2nd dose, post-2nd dose, month 2, month 3, month 4, month 5, and months 6–8, and (B) 142 third-dose subjects with percent neutralization data collected at pre-3rd dose, post-3rd dose, month 2, month 3, month 4, month 5, and months 6–8. Dendrograms from both (A,B) show that the data are best classified as two groups such that within-group covariance is greater than between-group variance. In (A), 201 subjects were grouped as “vaccine moderate responders” while 64 subjects were classified as “vaccine strong responders” (VSR), while in (B), 30 subjects were classified as “vaccine moderate responders” (VMR) and 112 subjects were classified as “vaccine strong responders” (see (C,D)). (C,D) Line graphs showing percent neutralization by time following (C) 2nd dose and (D) 3rd dose between VSR and VMR. Data were grouped as indicated by unsupervised clustering (A,B). Error bars represent standard error. Significance determined by Mann–Whitney U test; FDR-controlled q values shown. * q < 0.05, *** q < 0.001. (E,F) PCA performed using percent neutralization values from (E) pre-2nd dose to months 6–8, and (F) pre-3rd dose to months 6–8. For both PCA score plots, subjects were classified as VSR or VMR via unsupervised clustering and significance analysis of measured differences in percent neutralization at each timepoint.
Figure 4
Figure 4
Second and third vaccine dose grouping analyses of unpaired longitudinal NAb data. (A,B) Unsupervised hierarchical clustering analysis performed using (A) 265 s dose subjects with percent neutralization data collected at pre-2nd dose, post-2nd dose, month 2, month 3, month 4, month 5, and months 6–8, and (B) 142 third-dose subjects with percent neutralization data collected at pre-3rd dose, post-3rd dose, month 2, month 3, month 4, month 5, and months 6–8. Dendrograms from both (A,B) show that the data are best classified as two groups such that within-group covariance is greater than between-group variance. In (A), 201 subjects were grouped as “vaccine moderate responders” while 64 subjects were classified as “vaccine strong responders” (VSR), while in (B), 30 subjects were classified as “vaccine moderate responders” (VMR) and 112 subjects were classified as “vaccine strong responders” (see (C,D)). (C,D) Line graphs showing percent neutralization by time following (C) 2nd dose and (D) 3rd dose between VSR and VMR. Data were grouped as indicated by unsupervised clustering (A,B). Error bars represent standard error. Significance determined by Mann–Whitney U test; FDR-controlled q values shown. * q < 0.05, *** q < 0.001. (E,F) PCA performed using percent neutralization values from (E) pre-2nd dose to months 6–8, and (F) pre-3rd dose to months 6–8. For both PCA score plots, subjects were classified as VSR or VMR via unsupervised clustering and significance analysis of measured differences in percent neutralization at each timepoint.
Figure 5
Figure 5
Line graph of measured percent neutralization between 2nd and 3rd vaccine dose recipients from pre-2nd and -3rd doses to months 6–8 follow-up. Error bars represent standard error. Significance determined by Mann–Whitney U test; FDR-controlled q values shown.
Figure 6
Figure 6
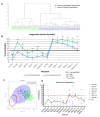
Grouping analyses of paired longitudinal NAb data. (A) Unsupervised hierarchical clustering analysis performed using 105 subjects with percent neutralization data collected at pre- and post-2nd dose, month 2, month 3, month 4, month 5, months 6–8, pre- and post-3rd dose, month 10, month 11, month 12, month 13, and months 14–16. Subjects were grouped as indicated by dendrogram and analysis of line graphs revealed the nature of two distinct groups (see (B)): VSRs (n = 42), VMRs (n = 63). (B) Line graph showing longitudinal vaccine durability (i.e., percent neutralization by time in response to 2nd and 3rd doses) between VSRs (n = 42) and VMRs (n = 63). Data were grouped as indicated by unsupervised clustering (A). Error bars represent standard error. Significance determined by Mann–Whitney U test; FDR-controlled q values shown. Referent line placed at 50% neutralization. (C) PCA performed using percent neutralization values from 105 subjects with longitudinal data from pre-2nd dose to months 14–16. Subjects were classified as VSR (green) or VMR (blue) via unsupervised clustering and significance analysis of measured differences in percent neutralization at each timepoint. A subgroup of the VMR population with poor neutralizing responses to mRNA vaccination, VPRs (n = 7), are shown outlined in red and loosely clustered within the VMR group (blue). (D) Paired longitudinal 2nd- and 3rd-dose data for VPR subjects identified in (C).

Similar articles

Cited by

References

    1. Baden L.R., El Sahly H.M., Essink B., Kotloff K., Frey S., Novak R., Diemert D., Spector S.A., Rouphael N., Creech C.B., et al. Efficacy and Safety of the mRNA-1273 SARS-CoV-2 Vaccine. N. Engl. J. Med. 2021;384:403–416. doi: 10.1056/NEJMoa2035389. - DOI - PMC - PubMed
    1. Polack F.P., Thomas S.J., Kitchin N., Absalon J., Gurtman A., Lockhart S., Perez J.L., Pérez Marc G., Moreira E.D., Zerbini C., et al. Safety and Efficacy of the BNT162b2 mRNA COVID-19 Vaccine. N. Engl. J. Med. 2020;383:2603–2615. doi: 10.1056/NEJMoa2034577. - DOI - PMC - PubMed
    1. Grifoni A., Weiskopf D., Ramirez S.I., Mateus J., Dan J.M., Moderbacher C.R., Rawlings S.A., Sutherland A., Premkumar L., Jadi R.S., et al. Targets of T Cell Responses to SARS-CoV-2 Coronavirus in Humans with COVID-19 Disease and Unexposed Individuals. Cell. 2020;181:1489–1501.e15. doi: 10.1016/j.cell.2020.05.015. - DOI - PMC - PubMed
    1. Le Bert N., Tan A.T., Kunasegaran K., Tham C.Y.L., Hafezi M., Chia A., Chng M.H.Y., Lin M., Tan N., Linster M., et al. SARS-CoV-2-specific T cell immunity in cases of COVID-19 and SARS, and uninfected controls. Nature. 2020;584:457–462. doi: 10.1038/s41586-020-2550-z. - DOI - PubMed
    1. Sekine T., Perez-Potti A., Rivera-Ballesteros O., Strålin K., Gorin J.-B., Olsson A., Llewellyn-Lacey S., Kamal H., Bogdanovic G., Muschiol S., et al. Robust T cell immunity in convalescent individuals with asymptomatic or mild COVID-19. Cell. 2020;183:158–168.e14. doi: 10.1016/j.cell.2020.08.017. - DOI - PMC - PubMed

LinkOut - more resources