

Development of an ELISA-Based Potency Assay for Inactivated Influenza Vaccines Using Cross-Reactive Nanobodies
- PMID: 36146550
- PMCID: PMC9503116
- DOI: 10.3390/vaccines10091473
Development of an ELISA-Based Potency Assay for Inactivated Influenza Vaccines Using Cross-Reactive Nanobodies
Abstract
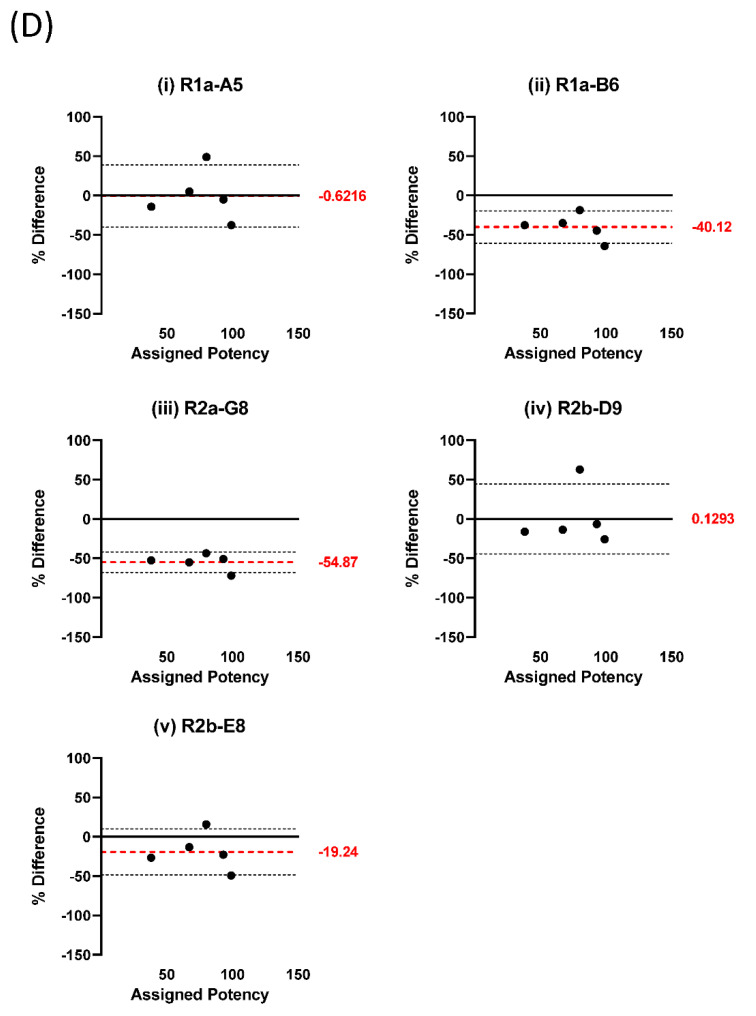
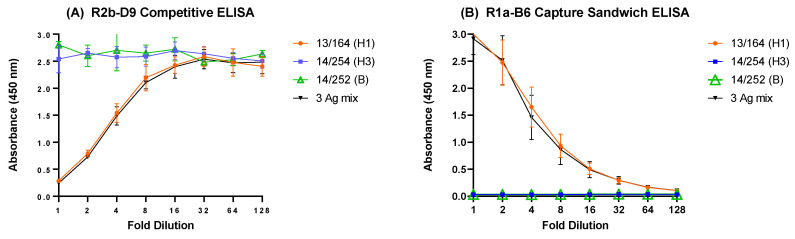
Inactivated vaccines are the main influenza vaccines used today; these are usually presented as split (detergent-disrupted) or subunit vaccines, while whole-virus-inactivated influenza vaccines are rare. The single radial immune diffusion (SRD) assay has been used as the gold standard potency assay for inactivated influenza vaccines for decades; however, more recently, various alternative potency assays have been proposed. A new potency test should be able to measure the amount of functional antigen in the vaccine, which in the case of influenza vaccines is the haemagglutinin (HA) protein. Potency tests should also be able to detect the loss of potency caused by changes to the structural and functional integrity of HA. To detect such changes, most alternative potency tests proposed to date use antibodies that react with native HA. Due to the frequent changes in influenza vaccine composition, antibodies may need to be updated in line with changes in vaccine viruses. We have developed two ELISA-based potency assays for group 1 influenza A viruses using cross-reactive nanobodies. The nanobodies detect influenza viruses of subtype H1N1 spanning more than three decades, as well as H5N1 viruses, in ELISA. We found that the new ELISA potency assays are sensitive to the nature of the reference antigen (standard) used to quantify vaccine antigens; using standards matched in their presentation to the vaccine type improved correspondence between the ELISA and SRD assays.
Keywords: ELISA; cross-reactive; influenza; nanobodies; potency test; vaccine.
Conflict of interest statement
O.G.E. reports funding from IFPMA outside the area of this work. The other authors declare no conflict of interest. One funder (BARDA) interacted regularly with the funded scientists during the period the research was carried out. The funders had no role in the writing of the manuscript.
Figures


Similar articles
-
A novel approach for preparation of the antisera reagent for potency determination of inactivated H7N9 influenza vaccines.Influenza Other Respir Viruses. 2016 Mar;10(2):134-40. doi: 10.1111/irv.12365. Epub 2016 Jan 29. Influenza Other Respir Viruses. 2016. PMID: 26616263 Free PMC article.
-
A monoclonal antibody-based immunoassay for measuring the potency of 2009 pandemic influenza H1N1 vaccines.Influenza Other Respir Viruses. 2014 Sep;8(5):587-95. doi: 10.1111/irv.12272. Epub 2014 Aug 2. Influenza Other Respir Viruses. 2014. PMID: 25087462 Free PMC article.
-
An alternative method for preparation of pandemic influenza strain-specific antibody for vaccine potency determination.Vaccine. 2010 Mar 11;28(12):2442-9. doi: 10.1016/j.vaccine.2009.12.079. Epub 2010 Jan 12. Vaccine. 2010. PMID: 20074687
-
Prepandemic influenza vaccine H5N1 (split virion, inactivated, adjuvanted) [Prepandrix]: a review of its use as an active immunization against influenza A subtype H5N1 virus.BioDrugs. 2008;22(5):279-92. doi: 10.2165/00063030-200822050-00001. BioDrugs. 2008. PMID: 18778110 Review.
-
New strategies for the development of H5N1 subtype influenza vaccines: progress and challenges.BioDrugs. 2011 Oct 1;25(5):285-98. doi: 10.1007/BF03256169. BioDrugs. 2011. PMID: 21942913 Review.
Cited by
-
Non-animal testing of Iranian enterotoxemia vaccine: cell culture assay for Clostridium perfringens epsilon toxin.In Vitro Cell Dev Biol Anim. 2025 Aug;61(7):862-870. doi: 10.1007/s11626-025-01069-4. Epub 2025 Jul 2. In Vitro Cell Dev Biol Anim. 2025. PMID: 40603752
-
Strategy and Application of Viral Potency Assays in Cell and Gene Therapy.Methods Mol Biol. 2025;2940:215-240. doi: 10.1007/978-1-0716-4615-1_20. Methods Mol Biol. 2025. PMID: 40515915 Review.
References
-
- Wood J.M., Schild G.C., Newman R.W., Seagroatt V. Application of an improved single-Radial-Immunodiffusion technique for the assay of haemagglutinin antigen content of whole virus and subunit influenza vaccines. Dev. Biol. Stand. 1977;39:193–200. - PubMed
-
- Wood J., Schild G., Newman R., Seagroatt V. An improved single-Radial-Immunodiffusion technique for the assay of influenza haemagglutinin antigen: Application for potency determinations of inactivated whole virus and subunit vaccines. J. Biol. Stand. 1977;5:237–247. doi: 10.1016/S0092-1157(77)80008-5. - DOI - PubMed
-
- Hardy S., Eichelberger M., Griffiths E., Weir J.P., Wood D., Alfonso C. Confronting the next pandemic-Workshop on lessons learned from potency testing of pandemic (H1N1) 2009 influenza vaccines and considerations for future potency tests, Ottawa, Canada, July 27–29, 2010. Influenza Other Respir. Viruses. 2011;5:438–442. doi: 10.1111/j.1750-2659.2011.00250.x. - DOI - PMC - PubMed
Grants and funding
LinkOut - more resources
Full Text Sources
