. 2022 Aug 28;14(9):1903.
doi: 10.3390/v14091903.

CAPG Is Required for Ebola Virus Infection by Controlling Virus Egress from Infected Cells

Affiliations

CAPG Is Required for Ebola Virus Infection by Controlling Virus Egress from Infected Cells

Hiroyuki Mori et al. Viruses. .

Abstract

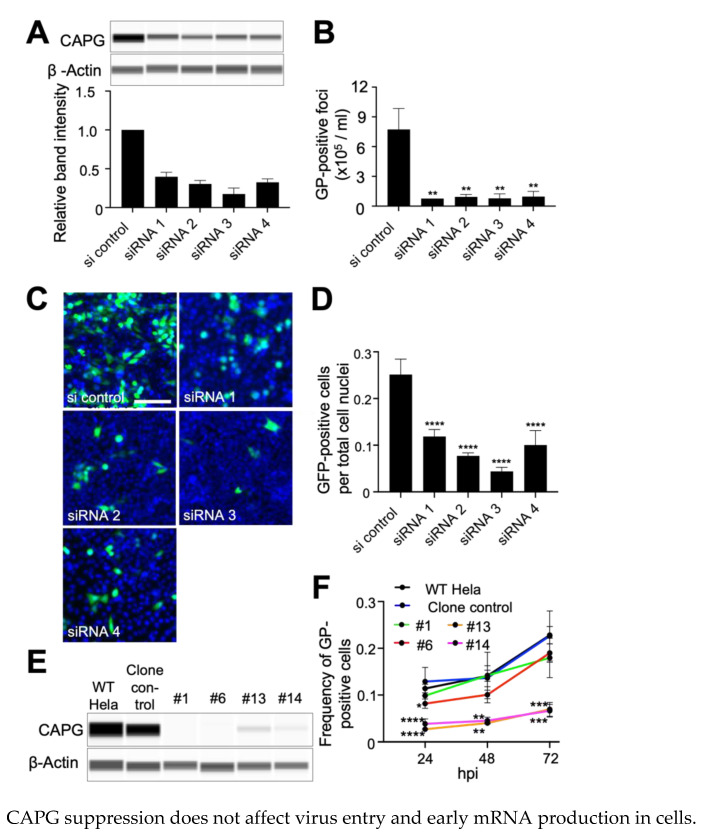
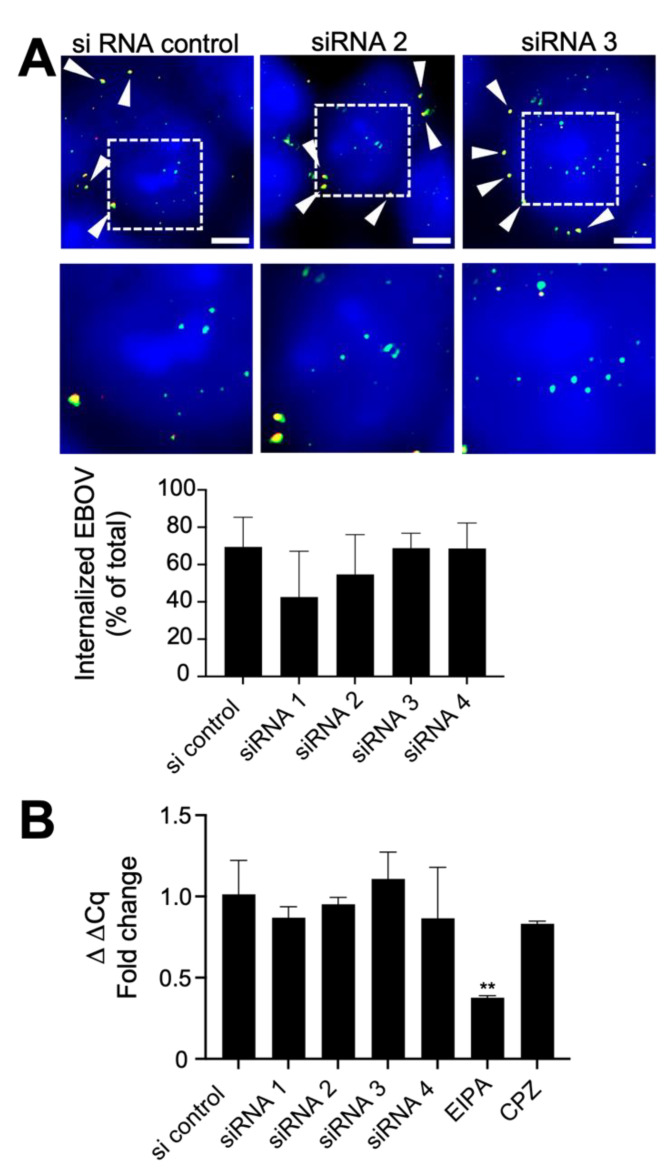
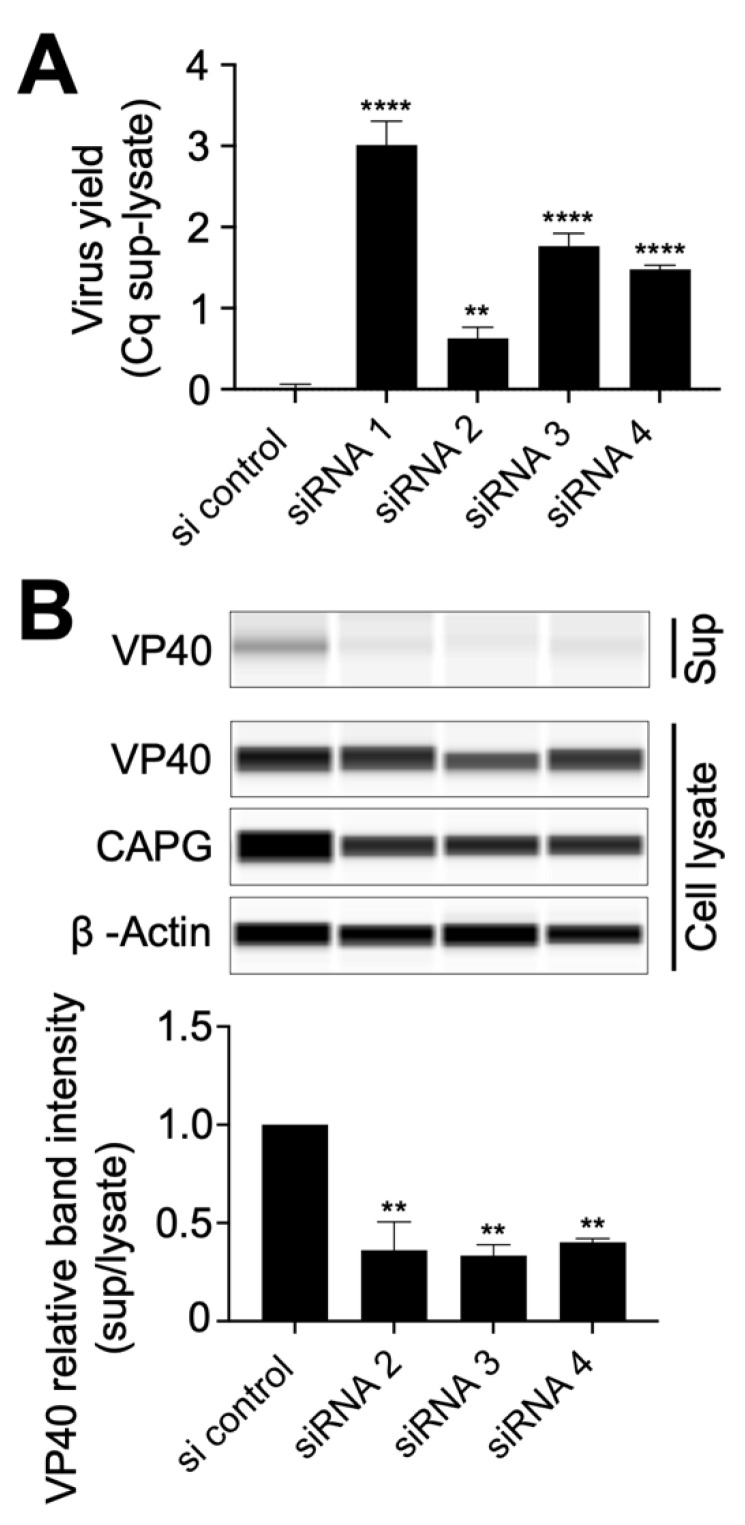
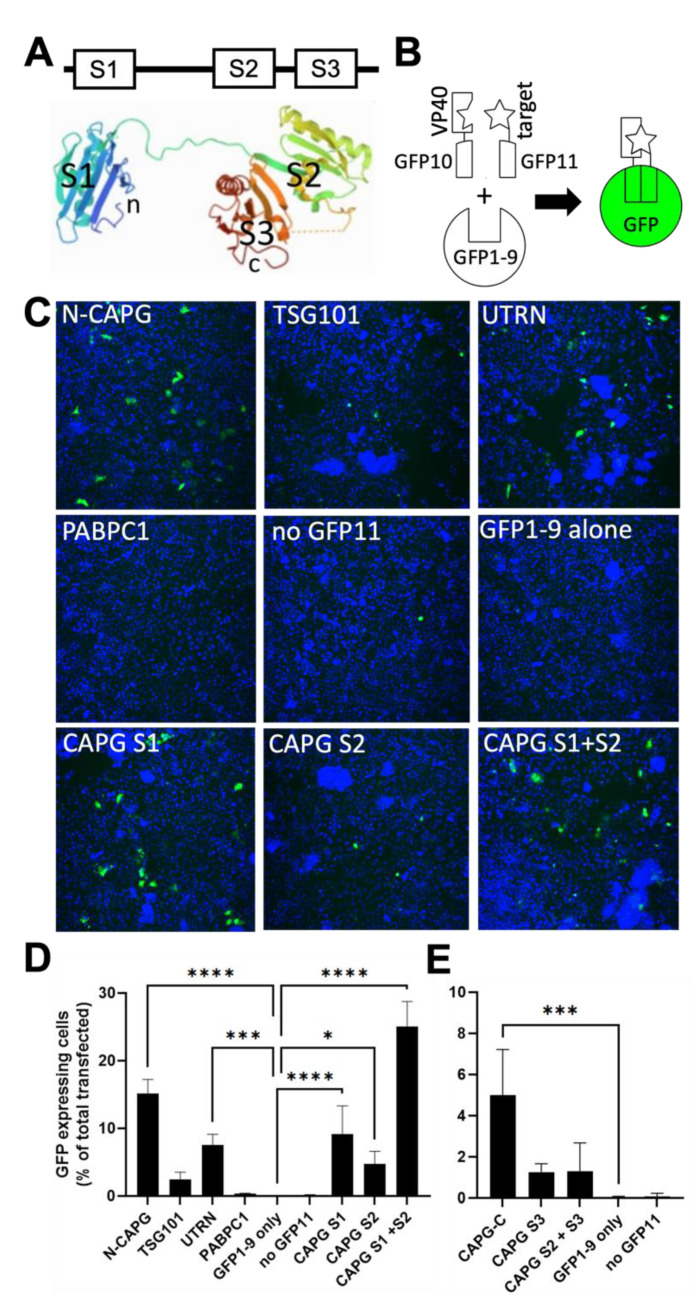
The replication of Ebola virus (EBOV) is dependent upon actin functionality, especially at cell entry through macropinocytosis and at release of virus from cells. Previously, major actin-regulatory factors involved in actin nucleation, such as Rac1 and Arp2/3, were shown important in both steps. However, downstream of nucleation, many other cell factors are needed to control actin dynamics. How these regulate EBOV infection remains largely unclear. Here, we identified the actin-regulating protein, CAPG, as important for EBOV replication. Notably, knockdown of CAPG specifically inhibited viral infectivity and yield of infectious particles. Cell-based mechanistic analysis revealed a requirement of CAPG for virus production from infected cells. Proximity ligation and split-green fluorescent protein reconstitution assays revealed strong association of CAPG with VP40 that was mediated through the S1 domain of CAPG. Overall, CAPG is a novel host factor regulating EBOV infection through connecting actin filament stabilization to viral egress from cells.

Keywords: Ebola virus; actin; assembly; egress; host interaction; trafficking.


Conflict of interest statement

The authors declare no conflict of interest. The funders had no role in the design of the study; in the collection, analyses, or interpretation of data; in the writing of the manuscript, or in the decision to publish the results.

Figures

Figure 1
Figure 1
Suppression of CAPG impairs EBOV infection. (A) CAPG knockdown (KD) was confirmed by immunoblot assay. Four siRNA targeting different regions of human CAPG were transfected into Hela cells at 40 nM. After 48 h, cells were challenged with virus and a replicate set were lysed for protein expression analysis by immunoblot (a representative blot is shown). β-actin was used as a loading control. Band intensity from triplicate samples was calculated using ImageJ, and normalized to the β-actin loading control. (B) Yield of infectious particles in the supernatant was measured by counting GP positive foci on VeroE6 cells. Cells were inoculated with the supernatant from wild-type EBOV-infected cells by limiting dilution. At 48 h after inoculation, cells were fixed and stained with anti-GP antibody and foci counted. (C) siRNA treated cells were challenged with GFP-EBOV with representative images shown from 48 hpi. Infected cells expressing GFP (green) and nuclei stained with Hoechst 33342 (blue) are visible. Scale bar = 500 µm. (D) Count of GFP-positive cells. The numbers of GFP-positive cells and the nuclei in each image were counted by CellProfiler software and infection efficiency was calculated by dividing the number of GFP-positive cells by that of the nuclei. (E) CAPG expression in each knockout (KO) and KD clones was detected by immunoblot. β-actin was used as a loading control. WT Hela = parental WT Hela cells and clones are indicated. (F) Time-course analysis of virus spread for each clone. At each indicated time point after infection with WT-EBOV, the cells were fixed and stained with anti-GP antibody. The number of GP-positive cells were counted by CellProfiler software, then normalized to that of the nuclei count in the same image. All data are means of three independent experiments +/− SDs. One-way ANOVA with Dunnett’s multiple comparisons test was used for statistical analysis relative to non-targeting siRNA treated control samples or the CRISPR clone control. *, p < 0.05; **, p < 0.01; ***, p < 0.001; ****, p < 0.0001.
Figure 2
Figure 2
Effect of CAPG suppression on EBOV uptake into cells. (A) Hela cells were treated with siRNA for 48 h, incubated with WT-EBOV at 14 °C for 1 h to allow binding without uptake and then temperature raised 37 °C to obtain synchronized virus uptake. Cells were then fixed and stained with anti-GP and Alexa Flour 594 antibody (red). Subsequently, cells were permeabilized with 0.2% Triton X-100 detergent and restained with anti-GP and Alexa Fluor 488 antibody (green). CellMask Blue was used for staining both the cell cytoplasm and nucleus (blue). Arrowheads show double stained puncta (uninternalized virus on the cell surface). Scale bars = 5 µm. Images below are magnified images indicated by dotted lines in areas where fluorescent green stained (internalized) virus particles are evident. The percentage of internalized virus was calculated as the ratio of green foci to total foci and shown in the graph below the images. (B) RT-qPCR detection of viral RNA during early infection. siRNA-treated Hela cells were incubated with WT-EBOV for 1 h, then the cells were washed and fresh medium was added onto the cells. The cells were lysed at 4 hpi for RNA extraction. Viral RNA was detected using a primer and probe set targeting NP gene (see Supplementary Table S2. ΔΔCq was calculated using GAPDH as a reference control in each sample. The data are shown as fold change relative to siRNA non-targeting control. A 1 h pre-treatment with 50 µM of the amiloride, EIPA, or chlorpromazine (CPZ) were used as macropinocytosis and clathrin-dependent endocytosis inhibitors, respectively. One-way ANOVA with Dunnett’s multiple comparisons test was used for statistical analysis relative to control samples. The means of at least 2 independent experiments are shown ± SD. **, p < 0.01.
Figure 3
Figure 3
Effect of CAPG suppression on EBOV release from cells. (A) Measurement of the quantity of viral RNA released from siRNA treated cells. At 48 hpi, RNA was extracted from the supernatant (sup) and the remaining cells (cell lysate), then virus RNA levels measured by RT-qPCR using primers for NP. The graph indicates Cq supernatant-cell lysate signals in each sample relative to the siRNA control. (B) The efficiency of VLP formation from cells treated with each indicated siRNA. Hela cells seeded in a 6 well plate were transduced with siRNA (40 nM each) and pCAGGS-Ebola VP40 plasmid (0.5 µg). At 48 h post transfection, the supernatant was collected and centrifuged to remove cell debris. VLPs were collected by pelleting through a 20% sucrose cushion. VLP pellets and cell lysates were analyzed by immunoblot. Band intensity from each sample is shown relative to siRNA non-targeting control. All assays were repeated at least twice and the representative data sets are shown. One-way ANOVA with Dunnett’s multiple comparisons test was used for statistical analysis relative to control samples. One-way ANOVA with Dunnett’s multiple comparisons test was used for statistical analysis relative to control samples. The means at least two independent experiments ± SDs are shown. **, p < 0.01; ****, p < 0.0001.
Figure 4
Figure 4
EBOV proteins localize in close proximity to CAPG in the cell cytoplasm. (A) Proximity ligation assays were used to detect CAPG and viral protein association. Hela cells were infected with WT-EBOV for 24 h, then fixed and permeabilized. Cells were treated with the indicated antibodies specific for each native protein and detected protein complexes stained red. Cell nuclei were stained with Hoechst 33342 (blue). The lower set of images from infected cells are magnified from the indicated sections of images (dotted squares). Scale bars = 50 µm, and 10 µm in magnified images. (B) A representative image (left) of amplified signal (red) of VP40-CAPG and phalloidin (green). The images were taken from the middle z-plane from an image stack. A magnified image (right) is shown for a region indicated by the dotted square. Arrowheads indicate sites where CAPG-VP40 complexes and phalloidin staining (F-actin) overlap. Scale bar = 10 µm and 2 µm in the magnified images.
Figure 5
Figure 5
Identification of CAPG subdomains important for interaction with VP40. (A) Schematic representation of the CAPG protein. Each gelsolin domain is indicated by S1, S2 and S3. The 3D structure of CAPG is shown and was derived from PDB 1JHW. (B) Shows the arrangement of the tripartite split GFP system. For this assay, the GFP10 peptide was used to tag VP40 and the GFP11 peptide was used for the indicated host cell protein targets. When each part is brought together with the remainder, GFP1-9, cells fluoresce green through formation of mature GFP. (C) Representative images showing cell nuclei stained with Hoechst 33342 (blue) and GFP positive cells (green), representing reconstituted GFP, for the indicated host protein tagged to GFP11 peptide and VP40 tagged to the GFP10 peptide. (D) Quantitation of image sets for N-terminus tagged proteins with GFP11. Sets of 4 wells were transfected with each tagged construct and GFP1-9 expression plasmid that also encoded mCherry as a marker of transfection efficiency. The number of GFP-expressing cells was counted using CellProfiler and expressed as the fraction of transfected cells. (E) Quantitation of image sets for C-terminus tagged domains. The S3 domain of CAPG was expressed as a C-terminal fusion with GFP11. Despite lower efficiency of mature GFP formation, significant activity allowed comparison to full length CAPG. Mean ± SD are shown with *, p < 0.05; ***, p < 0.001; ****, p < 0.0001 by One-way ANOVA with Dunnet’s multiple comparisons test.

Similar articles

References

    1. Baseler L., Chertow D.S., Johnson K.M., Feldmann H., Morens D.M. The Pathogenesis of Ebola Virus Disease. Annu. Rev. Pathol. Mech. Dis. 2017;12:387–418. doi: 10.1146/annurev-pathol-052016-100506. - DOI - PubMed
    1. Feldmann H., Sprecher A., Geisbert T.W. Ebola. N. Engl. J. Med. 2020;382:1832–1842. doi: 10.1056/NEJMra1901594. - DOI - PubMed
    1. Geisbert T.W., Jahrling P.B. Differentiation of Filoviruses by Electron Microscopy. Virus Res. 1995;39:129–150. doi: 10.1016/0168-1702(95)00080-1. - DOI - PubMed
    1. Elliott L.H., Kiley M.P., McCormick J.B. Descriptive Analysis of Ebola Virus Proteins. Virology. 1985;147:169–176. doi: 10.1016/0042-6822(85)90236-3. - DOI - PubMed
    1. Noda T., Hagiwara K., Sagara H., Kawaoka Y. Characterization of the Ebola Virus Nucleoprotein-RNA Complex. J. Gen. Virol. 2010;91:1478–1483. doi: 10.1099/vir.0.019794-0. - DOI - PMC - PubMed

Publication types

MeSH terms