. 2022 Aug 28;14(9):1906.
doi: 10.3390/v14091906.

Heterogenous CD8+ T Cell Maturation and 'Polarization' in Acute and Convalescent COVID-19 Patients

Affiliations

Heterogenous CD8+ T Cell Maturation and 'Polarization' in Acute and Convalescent COVID-19 Patients

Igor V Kudryavtsev et al. Viruses. .

Abstract

Background: The adaptive antiviral immune response requires interaction between CD8+ T cells, dendritic cells, and Th1 cells for controlling SARS-CoV-2 infection, but the data regarding the role of CD8+ T cells in the acute phase of COVID-19 and post-COVID-19 syndrome are still limited.

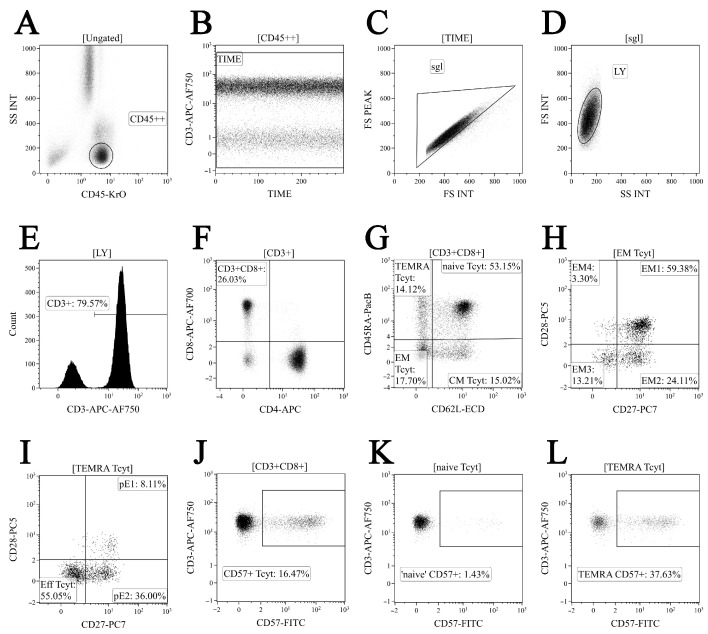
Methods: . Peripheral blood samples collected from patients with acute COVID-19 (n = 71), convalescent subjects bearing serum SARS-CoV-2 N-protein-specific IgG antibodies (n = 51), and healthy volunteers with no detectable antibodies to any SARS-CoV-2 proteins (HC, n = 46) were analyzed using 10-color flow cytometry.

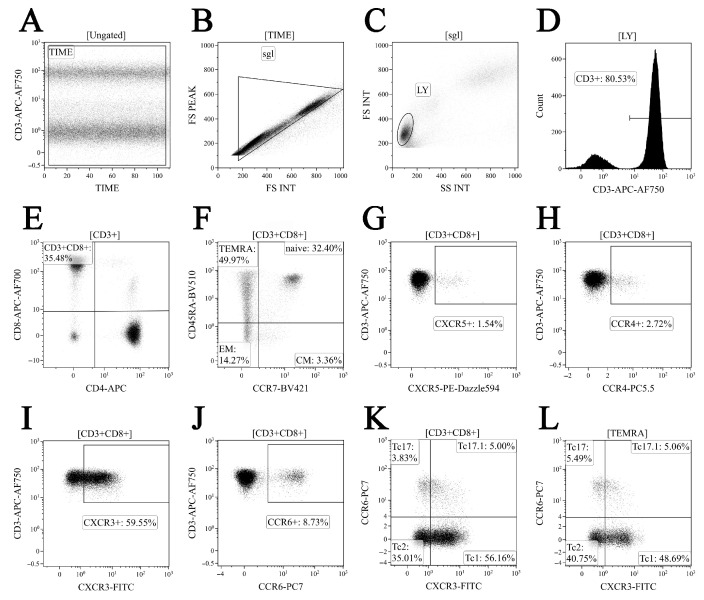
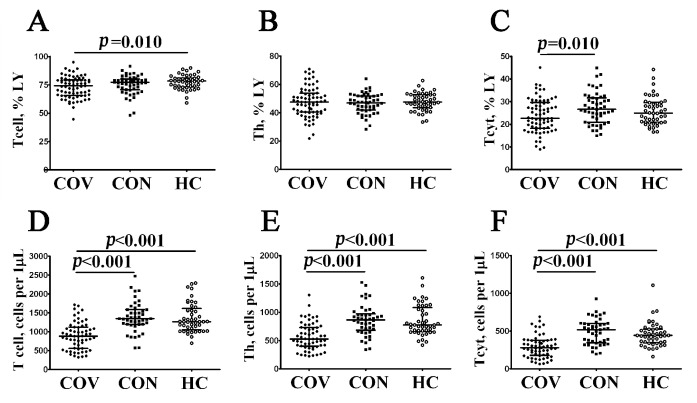
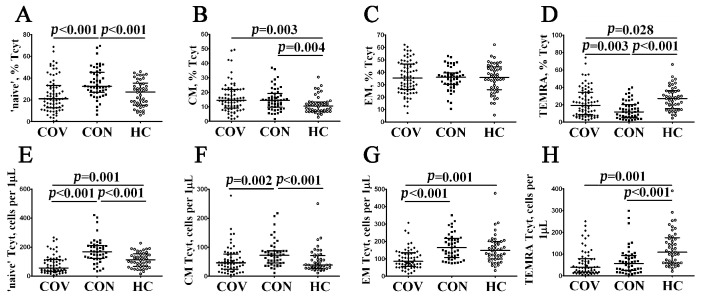
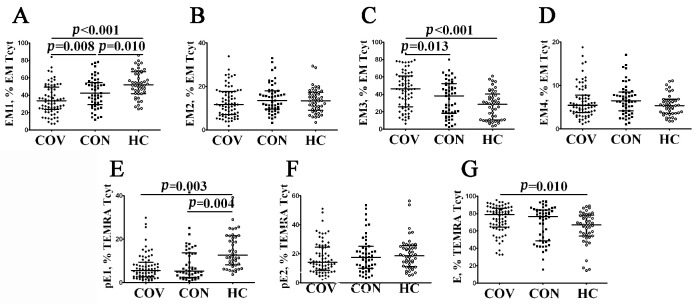
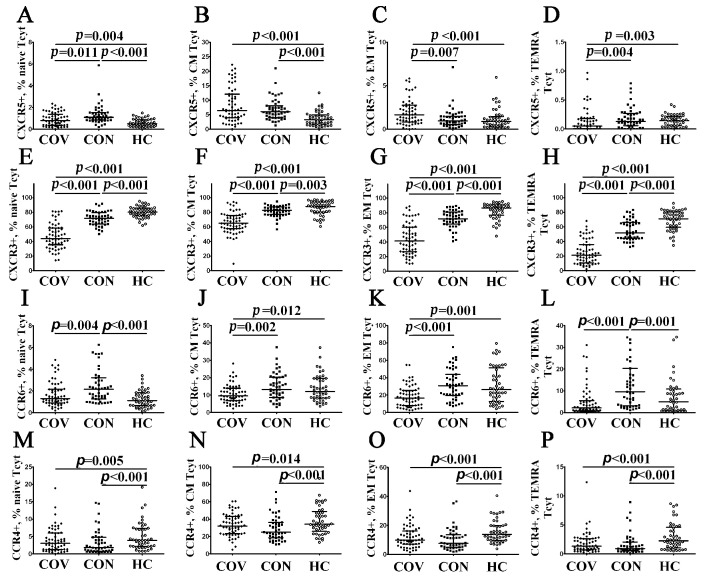
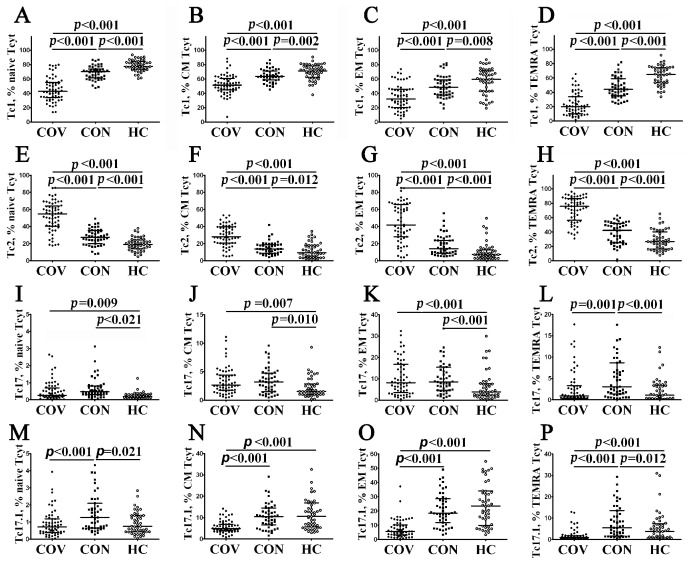
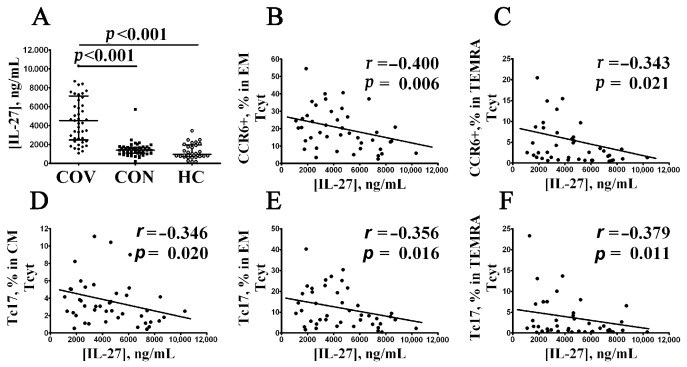
Results: Patients with acute COVID-19 vs. HC and COVID-19 convalescents showed decreased absolute numbers of CD8+ T cells, whereas the frequency of CM and TEMRA CD8+ T cells in acute COVID-19 vs. HC was elevated. COVID-19 convalescents vs. HC had increased naïve and CM cells, whereas TEMRA cells were decreased compared to HC. Cell-surface CD57 was highly expressed by the majority of CD8+ T cells subsets during acute COVID-19, but convalescents had increased CD57 on 'naïve', CM, EM4, and pE1 2-3 months post-symptom onset. CXCR5 expression was altered in acute and convalescent COVID-19 subjects, whereas the frequencies of CXCR3+ and CCR4+ cells were decreased in both patient groups vs. HC. COVID-19 convalescents had increased CCR6-expressing CD8+ T cells. Moreover, CXCR3+CCR6- Tc1 cells were decreased in patients with acute COVID-19 and COVID-19 convalescents, whereas Tc2 and Tc17 levels were increased compared to HC. Finally, IL-27 negatively correlated with the CCR6+ cells in acute COVID-19 patients.

Conclusions: We described an abnormal CD8+ T cell profile in COVID-19 convalescents, which resulted in lower frequencies of effector subsets (TEMRA and Tc1), higher senescent state (upregulated CD57 on 'naïve' and memory cells), and higher frequencies of CD8+ T cell subsets expressing lung tissue and mucosal tissue homing molecules (Tc2, Tc17, and Tc17.1). Thus, our data indicate that COVID-19 can impact the long-term CD8+ T cell immune response.

Keywords: CD3+CD8+; COVID-19; COVID-19 convalescent; IL-27; SARS-CoV-2; Tc1; Tc17; Tc2; chemokine receptors; memory CD8+ T cells; post-COVID-19 syndrome.


Conflict of interest statement

The authors declare no conflict of interest.

Figures

Figure 1
Figure 1
Flow cytometry immunophenotyping gating strategy for CD8+ T cell subset maturation stages and assessing CD57 expression level (shown in dot plots). (A) Total lymphocyte subset purification based on side scatter and bright CD45 expression; (B) artifact exclusion included time gating; (C) doublets exclusion from the analysis by using the ratio between integral and peak forward scatter signals; (D) discrimination between lymphocytes and cell debris; (E) total CD3 expression-based T cell subset gaiting; (F) CD8+ T cells detected within total CD3+ T cell population; (G) CD45RA and CD62L co-expression in identifying the four major CD8+ T cell maturation subsets: ‘naïve’ CD45RA+CD62L+ (naïve), central memory CD45RA-CD62L+ (CM), effector memory CD45RA−CD62L− (EM), and terminally differentiated CD45RA-positive effector memory CD45RA+CD62L− (TEMRA) CD8+ T cells; (H) EM1 (CD27+CD28+), EM2 (CD27+CD28−), EM3 (CD27−CD28−), and EM4 (CD27−CD28+) subsets were identified within total effector memory CD45RA−CD62L− CD8+ T cells; (I) differentiation of terminally differentiated CD8+ T cells (TEMRA) by assessing CD27 and CD28 expression allowed us to subdivide CD8+ T cells into pre-effector type 1 cells (pE1, CD27+CD28+), pre-effector type 2 cells (pE2, CD27+CD28-), and effector cells (E, CD27−CD28−); (JL) CD57 expression by total CD8+ T cell population, naïve, and TEMRA CD8+ T cell subsets, respectively.
Figure 2
Figure 2
Gating and analysis strategy for ‘polarized’ CD8+ T cell subsets immunophenotyping using flow cytometry. Dot plot (A)—artifact exclusion included time gating; dot plot (B)—doublets exclusion from the analysis using the ratio between integral and peak forward scatter signals; dot plot (C)—total lymphocyte subset purification based on side scatter and forward scatter; dot plot (D)—total T cell subset gaiting based on CD3 expression; dot plot (E)—detection of CD8+ T cells within total CD3+ T cell subset; dot plot (F)—identification of four main CD8+ T cell maturation subsets: ‘naïve’, central memory (CM), effector memory (EM), and TEMRA CD8+ T cells; dot plots (GL)—examples of CXCR5, CCR4, CXCR3, and CCR expression by total CD8+ T cells; dot plots—examples of Tc1 (CCR6−CXCR3+), Tc2 (CCR6−CXCR3−), Tc17 (CCR6+CXCR3−), and double-positive Tc17.1 (CCR6+CXCR3+) detection within total CD8+ T cell subset and TEMRA CD8+ T cell, respectively.
Figure 3
Figure 3
Comparison of relative and absolute frequencies of major T cell subsets in patient with acute COVID-19 and convalescent COVID-19 individuals. Scatter plots (AC) and (DF) showing the percentages (the percentage of T cell subset within total lymphocyte population) and absolute numbers (number of cells per 1 μL of peripheral blood) of T cells (CD3+), T-helpers (Th, CD3+CD4+), and CD8+ T cells (Tcyt, CD3+CD8+), respectively. Black circles denote patients with acute COVID-19 (COV, n = 71); black squares—convalescent COVID-19 individuals (CON, n = 51); white circles—healthy control (HC, n = 46). Each dot represents individual subject, and horizontal bars depict the group medians and quartile ranges (Med (Q25; Q75). In Figure 3, the statistical analysis was performed with the Mann–Whitney U test.
Figure 4
Figure 4
Alteration in relative and absolute numbers of major CD8+ T cell subsets with varying patterns of CD45RA and CD62L expression in acute and convalescent COVID-19 patients. Scatter plots (AD) and (EH) show the percentages and absolute numbers of ‘naïve’ (CD45RA+CD62L+), central memory (CM, CD45RA−CD62L+), effector memory (EM, CD45RA−CD62L−), and terminally differentiated CD45RA-positive effector memory (TEMRA, CD45RA+CD62L−) CD8+ T cells, respectively. Black circles denote patients with acute COVID-19 (COV, n = 71); black squares—convalescent COVID-19 individuals (CON, n = 51); white circles—healthy control (HC, n = 46). Each dot represents individual subjects, and horizontal bars depict the group medians and quartile ranges (Med (Q25; Q75)). In Figure 4, the statistical analysis was performed with the Mann–Whitney U test.
Figure 5
Figure 5
Alterations in relative number of EM and TEMRA CD8+ T cell subsets with different patterns of CD27 and CD28 expression in acute and convalescent COVID-19 patients w. Scatter plots (AD)—EM CD8+ T cell were subdivided into EM1 (CD27+CD28+), EM2 (CD27+CD28−), EM3 (CD27−CD28−), and EM4 (CD27−CD28+) subsets, respectively. Scatter plots (EG)—TEMRA CD8+ T cells were subdivided into CD27+CD28+ pE1, CD27+CD28− pE2, and CD27–CD28– E subsets, respectively. Black circles denote patients with acute COVID-19 (COV, n = 71); black squares—convalescent COVID-19 individuals (CON, n = 51); white circles—healthy control (HC, n = 46). Each dot represents individual subjects, and horizontal bars depict the group medians and quartile ranges (Med (Q25; Q75)). In Figure 5, the statistical analysis was performed with the Mann–Whitney U test.
Figure 6
Figure 6
Chemokine receptor profiles for major CD8+ T cell subsets with varying patterns of CD45RA and CD62L expression in acute and convalescent COVID-19 patients. Scatter plots (AD), (EH), (IL) and (MP) show the percentages of ‘naïve’ (CD45RA+CD62L+), central memory (CM, CD45RA−CD62L+), effector memory (EM, CD45RA−CD62L−), and terminally differentiated CD45RA-positive effector memory (TEMRA, CD45RA+CD62L−) CD8+ T cells, respectively, expressing CXCR5, CXCR3, CCR6, and CCR4, respectively. Black circles denote patients with acute COVID-19 (COV, n = 71); black squares—convalescent COVID-19 individuals (CON, n = 51); white circles—healthy control (HC, n = 46). Each dot represents individual subjects, and horizontal bars depict the group medians and quartile ranges (Med (Q25; Q75). In Figure 6, the statistical analysis was performed with the Mann–Whitney U test.
Figure 7
Figure 7
Imbalance in peripheral blood Tc1, Tc2, Tc17, and Tc17.1 cells in major CD8+ T cell subsets with varying patterns of CD45RA and CD62L expression in acute and convalescent COVID-19 patients. Scatter plots (AD), (EH), (IL), and (MP) show the relative numbers of Tc1 (CCR6−CXCR3+), Tc2 (CCR6−CXCR3−), Tc17 (CCR6+CXCR3−), and double-positive Tc17.1 (CCR6+CXCR3+) cells within ‘naïve’ (CD45RA+CCR7+), central memory (CM, CD45RA−CCR7+), effector memory (EM, CD45RA−CCR7−), and terminally differentiated CD45RA-positive effector memory (TEMRA, CD45RA+CCR7−) CD8+ T cells, respectively. Black circles denote patients with acute COVID-19 (COV, n = 71); black squares—convalescent COVID-19 individuals (CON, n = 51); white circles—healthy control (HC, n = 46). Each dot represents individual subjects, and horizontal bars depict the group medians and quartile ranges (Med (Q25; Q75)). In Figure 7, the statistical analysis was performed with the Mann–Whitney U test.
Figure 8
Figure 8
Correlation between elevated serum IL-27 level and CCR6+CD8+ T cells in acute COVID-19 patients. Comments: (A) IL-27 concentration (ng/mL) in patients with acute COVID-19 (black circles, COV, n = 45); convalescent COVID-19 individuals (black squares, CON, n = 48), and healthy control (white circles, HC, n = 30). Each dot represents individual subjects, and horizontal bars depict the group medians and quartile ranges (Med (Q25; Q75)). (BF) Spearman correlation coefficient between serum IL-27 concentration and level of peripheral blood CCR6+ EM and CCR6+ TEMRA CD8+ T cells, as well as Tc17 CD8+ T cell subsets within CM, EM, and TEMRA CD8+ T cells, respectively. In Figure 8, the statistical analysis was performed with the Mann–Whitney U test.

Similar articles

Cited by

References

    1. Annunziato F., Romagnani C., Romagnani S. The 3 major types of innate and adaptive cell-mediated effector immunity. J. Allergy Clin. Immunol. 2015;135:626–635. doi: 10.1016/j.jaci.2014.11.001. - DOI - PubMed
    1. Zhu X., Zhu J. CD4 T Helper Cell Subsets and Related Human Immunological Disorders. Int. J. Mol. Sci. 2020;21:8011. doi: 10.3390/ijms21218011. - DOI - PMC - PubMed
    1. Taefehshokr N., Taefehshokr S., Heit B. Mechanisms of Dysregulated Humoral and Cellular Immunity by SARS-CoV-2. Pathogens. 2020;9:1027. doi: 10.3390/pathogens9121027. - DOI - PMC - PubMed
    1. Sette A., Crotty S. Adaptive immunity to SARS-CoV-2 and COVID-19. Cell. 2021;184:861–880. doi: 10.1016/j.cell.2021.01.007. - DOI - PMC - PubMed
    1. Shafqat A., Shafqat S., Salameh S.A., Kashir J., Alkattan K., Yaqinuddin A. Mechanistic Insights Into the Immune Pathophysiology of COVID-19; An In-Depth Review. Front. Immunol. 2022;13:835104. doi: 10.3389/fimmu.2022.835104. - DOI - PMC - PubMed

Publication types