

Selective Electrochemical Detection of SARS-CoV-2 Using Deep Learning
- PMID: 36146738
- PMCID: PMC9502341
- DOI: 10.3390/v14091930
Selective Electrochemical Detection of SARS-CoV-2 Using Deep Learning
Abstract
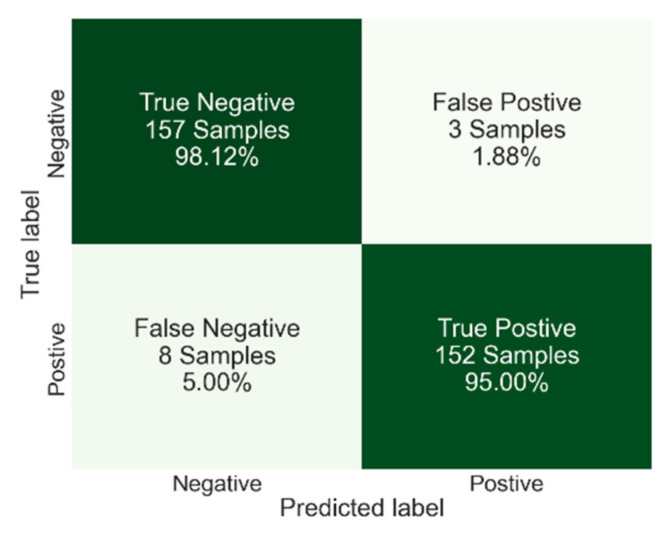
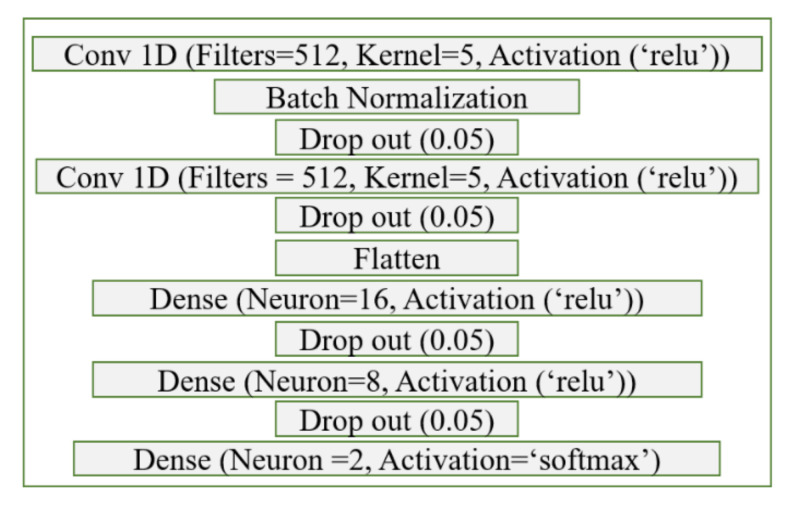
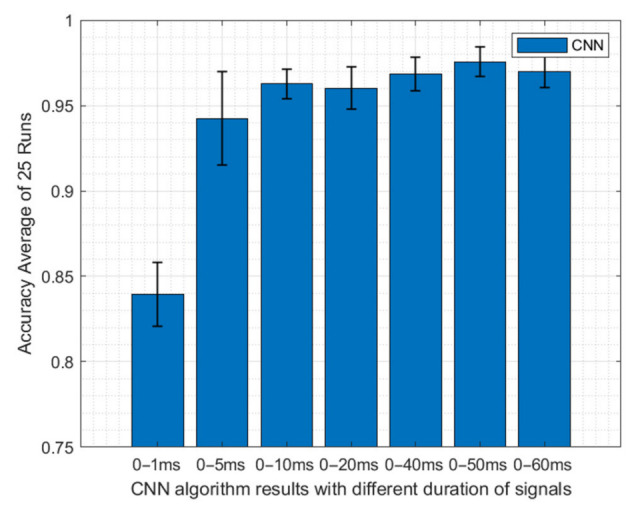
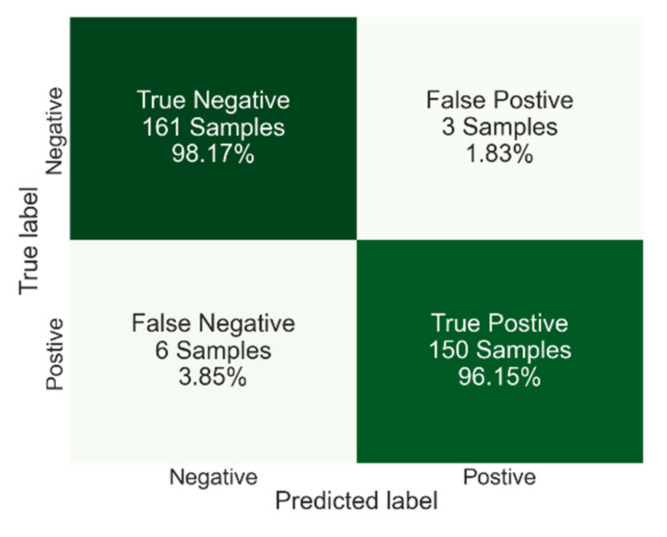
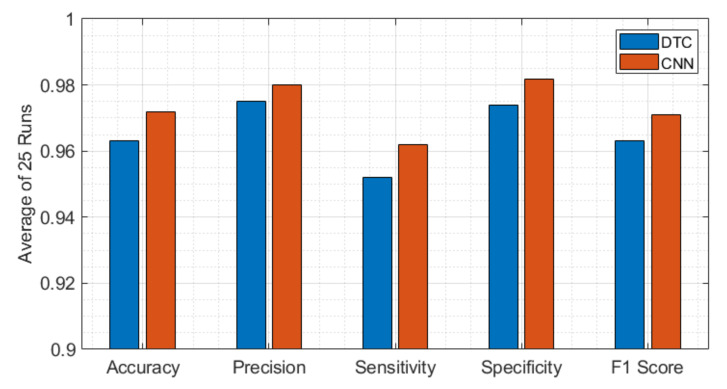
COVID-19 has been in the headlines for the past two years. Diagnosing this infection with minimal false rates is still an issue even with the advent of multiple rapid antigen tests. Enormous data are being collected every day that could provide insight into reducing the false diagnosis. Machine learning (ML) and deep learning (DL) could be the way forward to process these data and reduce the false diagnosis rates. In this study, ML and DL approaches have been applied to the data set collected using an ultra-fast COVID-19 diagnostic sensor (UFC-19). The ability of ML and DL to specifically detect SARS-CoV-2 signals against SARS-CoV, MERS-CoV, Human CoV, and Influenza was investigated. UFC-19 is an electrochemical sensor that was used to test these virus samples and the obtained current response dataset was used to diagnose SARS-CoV-2 using different algorithms. Our results indicate that the convolution neural networks algorithm could diagnose SARS-CoV-2 samples with a sensitivity of 96.15%, specificity of 98.17%, and accuracy of 97.20%. Combining this DL model with the existing UFC-19 could selectively identify SARS-CoV-2 presence within two minutes.
Keywords: COVID deep learning; COVID-19 diagnosis; differential diagnosis; electrochemical SARS-CoV-2 detection; electrochemical biosensor.
Conflict of interest statement
Authors G.G.B. and A.R. are co-inventors of the Ultra-Fast COVID-19 detection technology (rapid viral diagnostic sensor, US11060995B1, 2021). G.G.B. has ownership on EviroTech LLC (non-publicly traded entity) that has acquired a license from Texas Tech University to commercialize the rapid viral diagnostic sensor.
Figures
Similar articles
-
Voltammetric-based immunosensor for the detection of SARS-CoV-2 nucleocapsid antigen.Mikrochim Acta. 2021 May 26;188(6):199. doi: 10.1007/s00604-021-04867-1. Mikrochim Acta. 2021. PMID: 34041585 Free PMC article.
-
SARS-CoV-2 Surveillance in Indoor Air Using Electrochemical Sensor for Continuous Monitoring and Real-Time Alerts.Biosensors (Basel). 2022 Jul 13;12(7):523. doi: 10.3390/bios12070523. Biosensors (Basel). 2022. PMID: 35884326 Free PMC article.
-
Electrochemical lateral-flow device for rapid COVID-19 antigen-diagnostic testing.Bioelectrochemistry. 2023 Aug;152:108438. doi: 10.1016/j.bioelechem.2023.108438. Epub 2023 Apr 6. Bioelectrochemistry. 2023. PMID: 37054603 Free PMC article.
-
Effectiveness of tests to detect the presence of SARS-CoV-2 virus, and antibodies to SARS-CoV-2, to inform COVID-19 diagnosis: a rapid systematic review.BMJ Evid Based Med. 2022 Feb;27(1):33-45. doi: 10.1136/bmjebm-2020-111511. Epub 2020 Oct 1. BMJ Evid Based Med. 2022. PMID: 33004426
-
Reviewing methods of deep learning for diagnosing COVID-19, its variants and synergistic medicine combinations.Comput Biol Med. 2023 Sep;163:107191. doi: 10.1016/j.compbiomed.2023.107191. Epub 2023 Jun 20. Comput Biol Med. 2023. PMID: 37354819 Free PMC article. Review.
Cited by
-
Advancements in SARS-CoV-2 Testing: Enhancing Accessibility through Machine Learning-Enhanced Biosensors.Micromachines (Basel). 2023 Jul 28;14(8):1518. doi: 10.3390/mi14081518. Micromachines (Basel). 2023. PMID: 37630054 Free PMC article. Review.
References
-
- Peiffer-Smadja N., Rawson T.M., Ahmad R., Buchard A., Pantelis G., Lescure F.X., Birgand G., Holmes A.H. Machine learning for clinical decision support in infectious diseases: A narrative review of current applications. Clin. Microbiol. Infect. 2020;26:584–595. doi: 10.1016/j.cmi.2019.09.009. - DOI - PubMed
-
- Gambhir S., Malik S.K., Kumar Y. The Diagnosis of Dengue Disease: An Evaluation of Three Machine Learning Approaches. Int. J. Healthc. Inf. Syst. Inform. 2018;13:19. doi: 10.4018/IJHISI.2018070101. - DOI
Publication types
MeSH terms
LinkOut - more resources
Full Text Sources
Medical
Miscellaneous
