

Diet-Induced Obesity and NASH Impair Disease Recovery in SARS-CoV-2-Infected Golden Hamsters
- PMID: 36146875
- PMCID: PMC9503118
- DOI: 10.3390/v14092067
Diet-Induced Obesity and NASH Impair Disease Recovery in SARS-CoV-2-Infected Golden Hamsters
Abstract
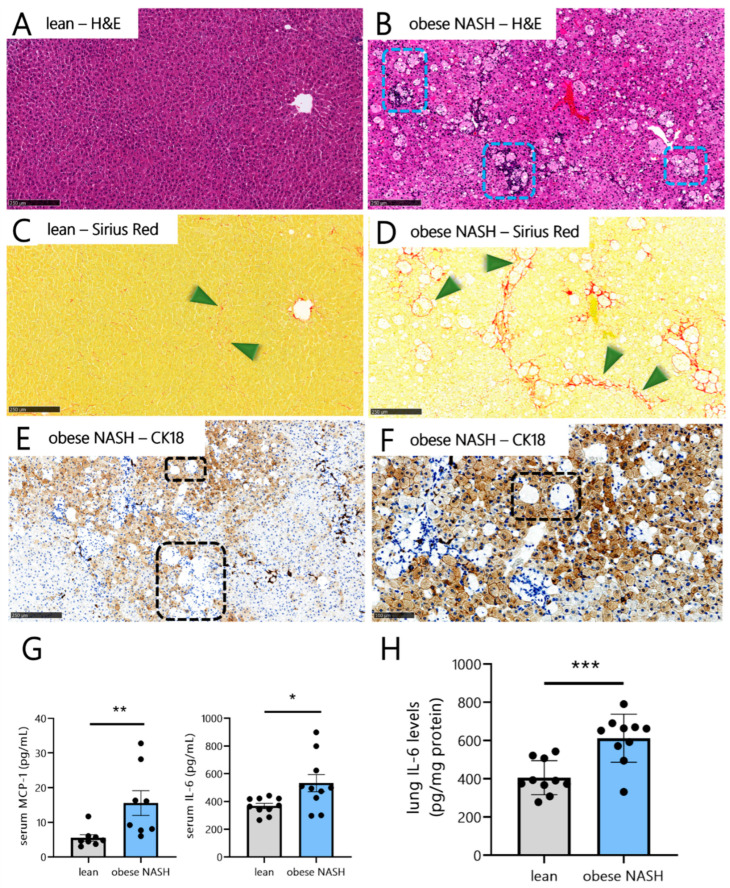
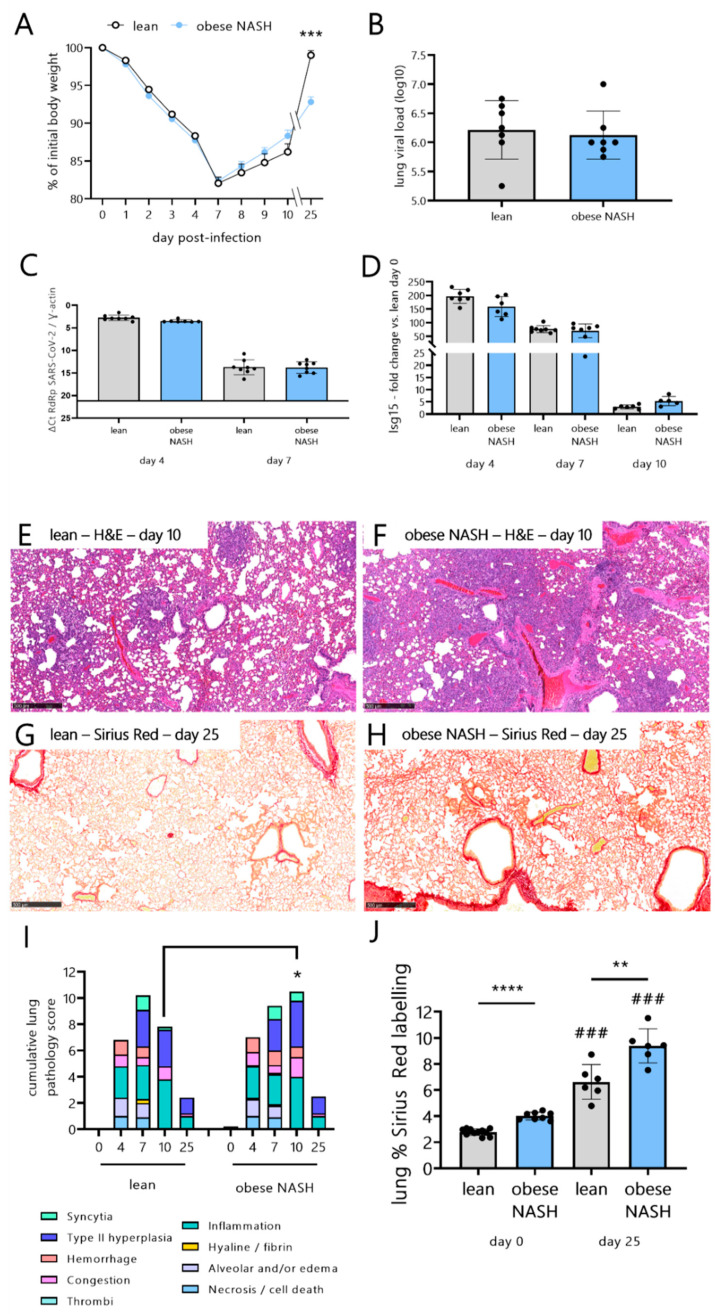
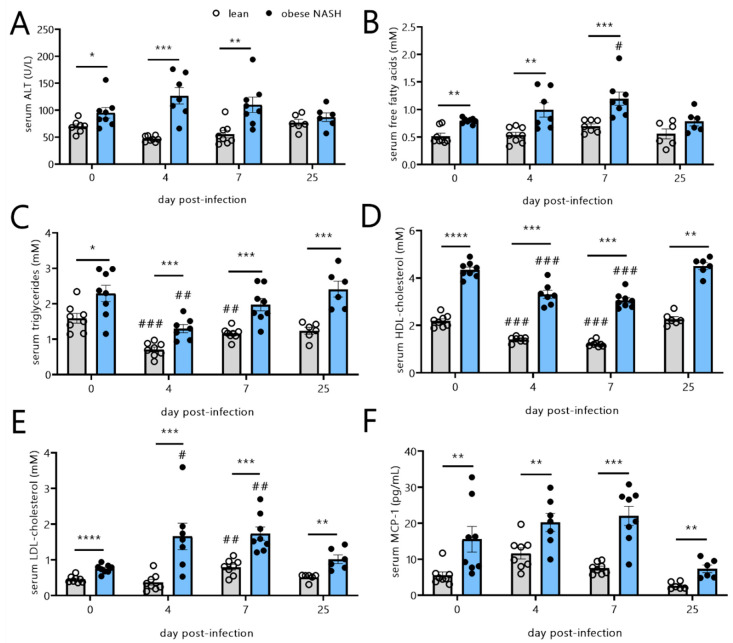
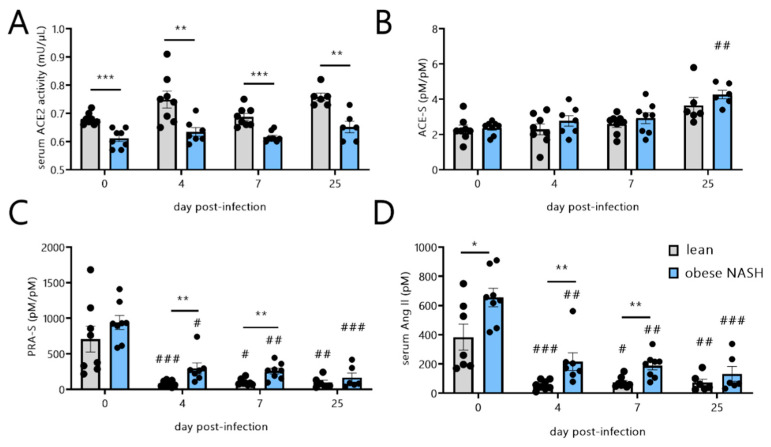
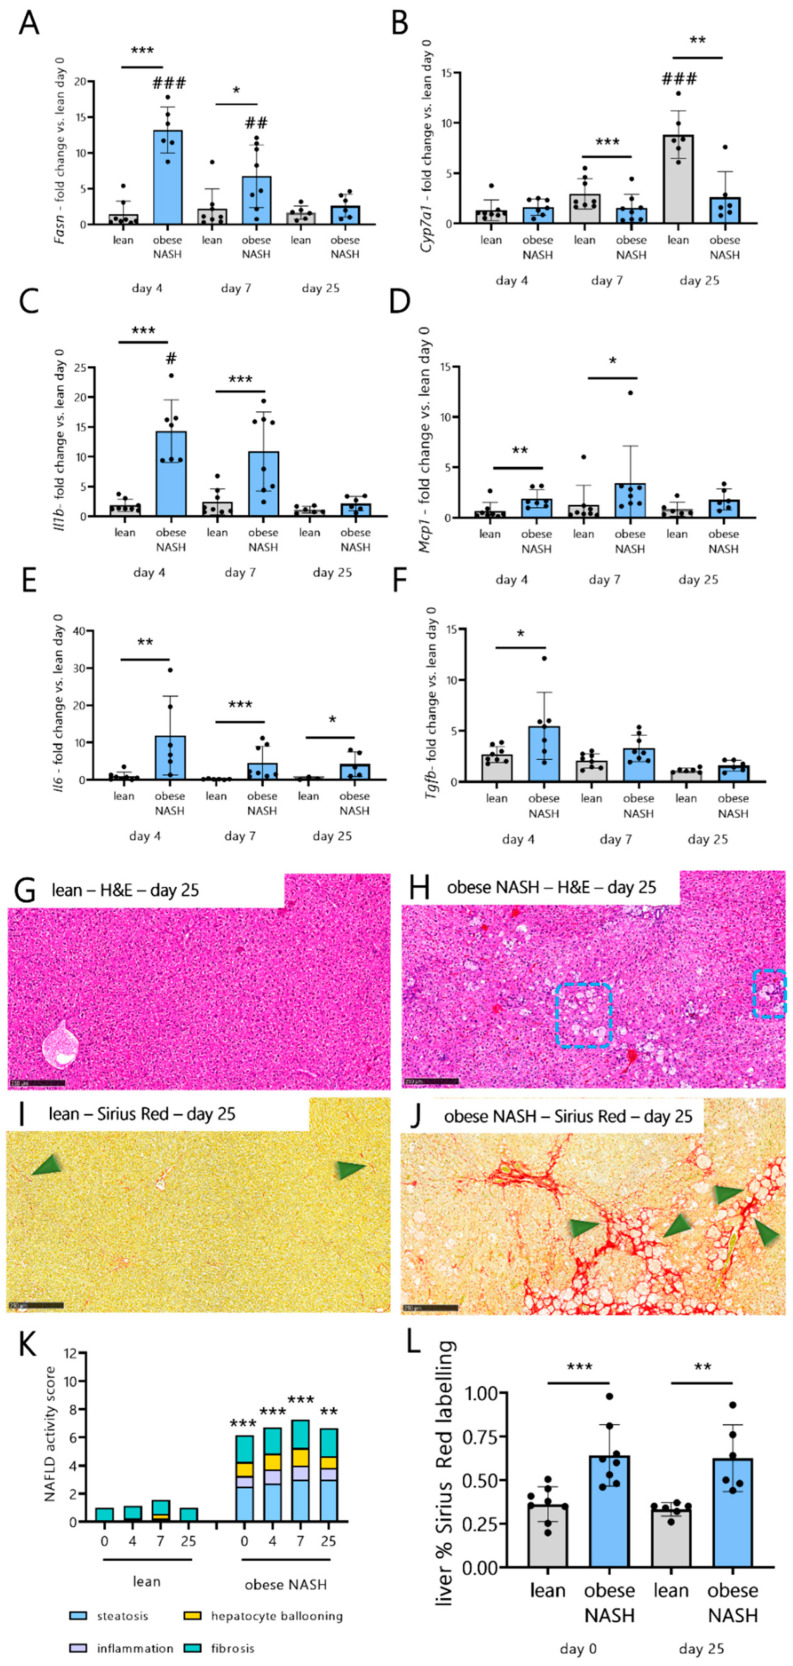
Obese patients with non-alcoholic steatohepatitis (NASH) are prone to severe forms of COVID-19. There is an urgent need for new treatments that lower the severity of COVID-19 in this vulnerable population. To better replicate the human context, we set up a diet-induced model of obesity associated with dyslipidemia and NASH in the golden hamster (known to be a relevant preclinical model of COVID-19). A 20-week, free-choice diet induces obesity, dyslipidemia, and NASH (liver inflammation and fibrosis) in golden hamsters. Obese NASH hamsters have higher blood and pulmonary levels of inflammatory cytokines. In the early stages of a SARS-CoV-2 infection, the lung viral load and inflammation levels were similar in lean hamsters and obese NASH hamsters. However, obese NASH hamsters showed worse recovery (i.e., less resolution of lung inflammation 10 days post-infection (dpi) and lower body weight recovery on dpi 25). Obese NASH hamsters also exhibited higher levels of pulmonary fibrosis on dpi 25. Unlike lean animals, obese NASH hamsters infected with SARS-CoV-2 presented long-lasting dyslipidemia and systemic inflammation. Relative to lean controls, obese NASH hamsters had lower serum levels of angiotensin-converting enzyme 2 activity and higher serum levels of angiotensin II-a component known to favor inflammation and fibrosis. Even though the SARS-CoV-2 infection resulted in early weight loss and incomplete body weight recovery, obese NASH hamsters showed sustained liver steatosis, inflammation, hepatocyte ballooning, and marked liver fibrosis on dpi 25. We conclude that diet-induced obesity and NASH impair disease recovery in SARS-CoV-2-infected hamsters. This model might be of value for characterizing the pathophysiologic mechanisms of COVID-19 and evaluating the efficacy of treatments for the severe forms of COVID-19 observed in obese patients with NASH.
Keywords: SARS-CoV-2; coronavirus disease 2019; hamster; non-alcoholic steatohepatitis; obesity.
Conflict of interest statement
The authors declare no conflict of interest. The funders had no role in the design of the study; in the collection, analyses, or interpretation of data; in the writing of the manuscript; or in the decision to publish the results.
Figures
Similar articles
-
Alteration of the gut microbiota's composition and metabolic output correlates with COVID-19-like severity in obese NASH hamsters.Gut Microbes. 2022 Jan-Dec;14(1):2100200. doi: 10.1080/19490976.2022.2100200. Gut Microbes. 2022. PMID: 35830432 Free PMC article.
-
Dynamic Changes of the Blood Chemistry in Syrian Hamsters Post-Acute COVID-19.Microbiol Spectr. 2022 Feb 23;10(1):e0236221. doi: 10.1128/spectrum.02362-21. Epub 2022 Feb 23. Microbiol Spectr. 2022. PMID: 35196799 Free PMC article.
-
Obeticholic acid raises LDL-cholesterol and reduces HDL-cholesterol in the Diet-Induced NASH (DIN) hamster model.Eur J Pharmacol. 2018 Jan 5;818:449-456. doi: 10.1016/j.ejphar.2017.11.021. Epub 2017 Nov 16. Eur J Pharmacol. 2018. PMID: 29155143
-
Hamsters as a Model of Severe Acute Respiratory Syndrome Coronavirus-2.Comp Med. 2021 Oct 1;71(5):398-410. doi: 10.30802/AALAS-CM-21-000036. Epub 2021 Sep 29. Comp Med. 2021. PMID: 34588095 Free PMC article. Review.
-
[Mechanism Analysis and Prevention of Pathogenesis of Nonalcoholic Steatohepatitis].Nihon Eiseigaku Zasshi. 2015;70(3):197-204. doi: 10.1265/jjh.70.197. Nihon Eiseigaku Zasshi. 2015. PMID: 26411937 Review. Japanese.
Cited by
-
Obesity-Associated Hepatic Steatosis, Somatotropic Axis Impairment, and Ferritin Levels Are Strong Predictors of COVID-19 Severity.Viruses. 2023 Feb 9;15(2):488. doi: 10.3390/v15020488. Viruses. 2023. PMID: 36851702 Free PMC article.
-
Gut microbiota in post-acute COVID-19 syndrome: not the end of the story.Front Microbiol. 2024 Dec 24;15:1500890. doi: 10.3389/fmicb.2024.1500890. eCollection 2024. Front Microbiol. 2024. PMID: 39777148 Free PMC article. Review.
-
Differential immunometabolic responses to Delta and Omicron SARS-CoV-2 variants in golden syrian hamsters.iScience. 2024 Jul 14;27(8):110501. doi: 10.1016/j.isci.2024.110501. eCollection 2024 Aug 16. iScience. 2024. PMID: 39171289 Free PMC article.
-
Uncovering the Contrasts and Connections in PASC: Viral Load and Cytokine Signatures in Acute COVID-19 versus Post-Acute Sequelae of SARS-CoV-2 (PASC).Biomedicines. 2024 Aug 23;12(9):1941. doi: 10.3390/biomedicines12091941. Biomedicines. 2024. PMID: 39335455 Free PMC article. Review.
-
Rodent model of metabolic dysfunction-associated fatty liver disease: a systematic review.J Gastroenterol Hepatol. 2025 Jan;40(1):48-66. doi: 10.1111/jgh.16749. Epub 2024 Sep 25. J Gastroenterol Hepatol. 2025. PMID: 39322221 Free PMC article.
References
-
- Apovian C.M. Obesity: Definition, comorbidities, causes, and burden. Am. J. Manag. Care. 2016;22((Suppl. S7)):s176–s185. - PubMed
Publication types
MeSH terms
Substances
LinkOut - more resources
Full Text Sources
Medical
Miscellaneous
