. 2023 Jan 4;31(1):119-133.
doi: 10.1016/j.ymthe.2022.09.012. Epub 2022 Sep 22.

Fibrotic immune microenvironment remodeling mediates superior anti-tumor efficacy of a nano-PD-L1 trap in hepatocellular carcinoma

Affiliations

Fibrotic immune microenvironment remodeling mediates superior anti-tumor efficacy of a nano-PD-L1 trap in hepatocellular carcinoma

Xiaoyu Liu et al. Mol Ther. .

Abstract

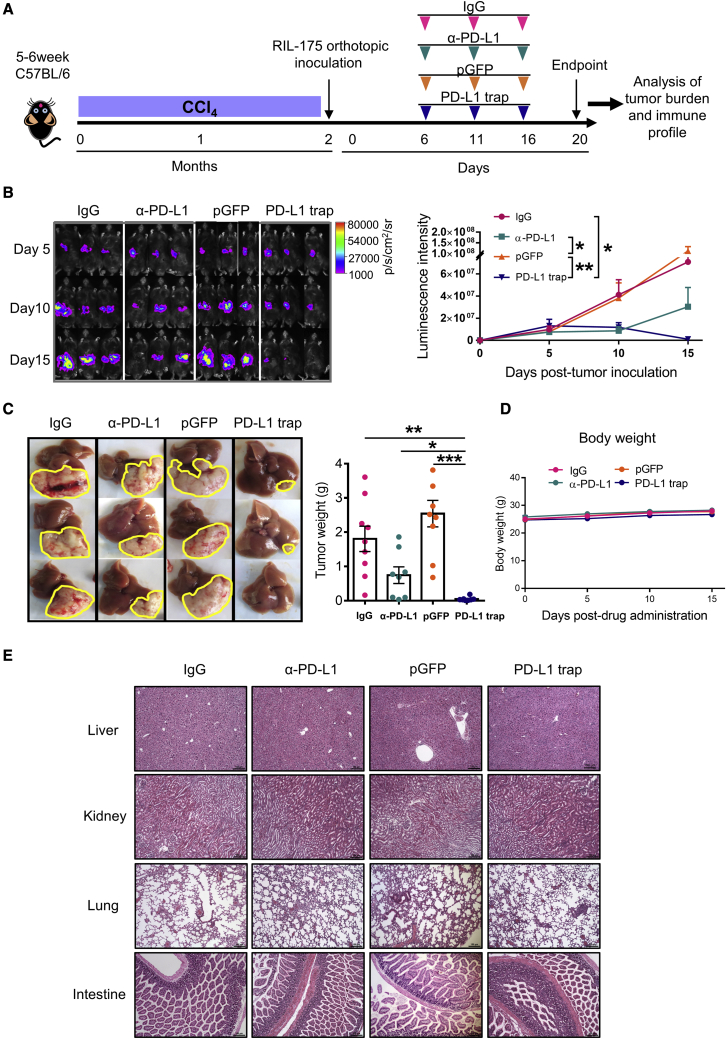
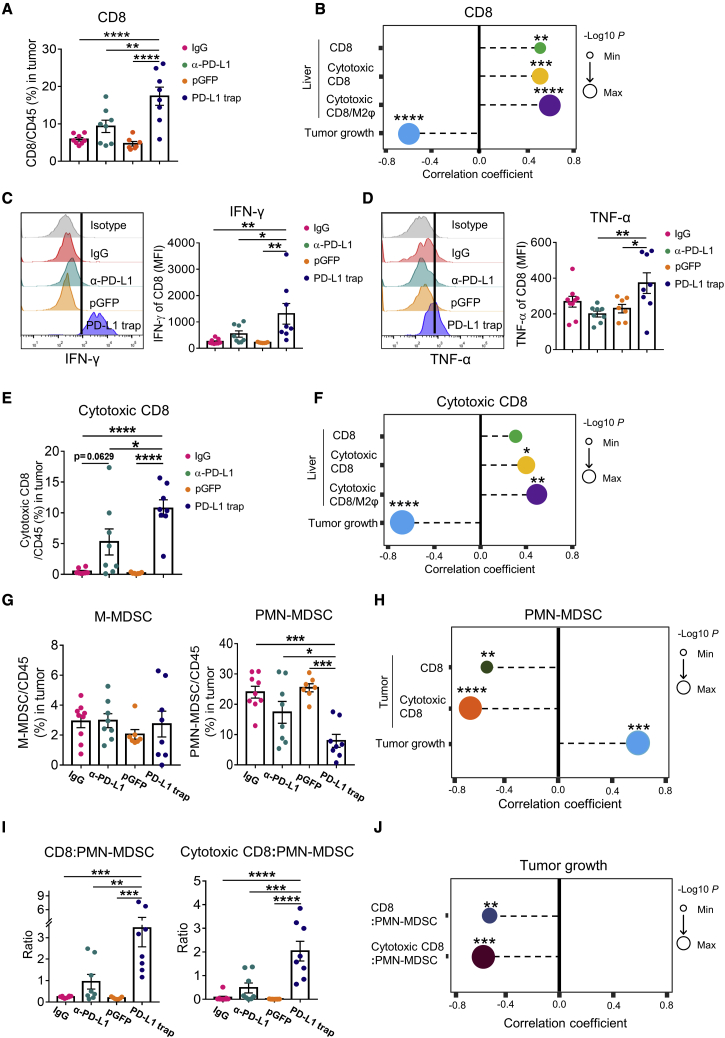
The local microenvironment where tumors develop can shape cancer progression and therapeutic outcome. Emerging evidence demonstrate that the efficacy of immune-checkpoint blockade (ICB) is undermined by fibrotic tumor microenvironment (TME). The majority of hepatocellular carcinoma (HCC) develops in liver fibrosis, in which the stromal and immune components may form a barricade against immunotherapy. Here, we report that nanodelivery of a programmed death-ligand 1 (PD-L1) trap gene exerts superior efficacy in treating fibrosis-associated HCC when compared with the conventional monoclonal antibody (mAb). In two fibrosis-associated HCC models induced by carbon tetrachloride and a high-fat, high-carbohydrate diet, the PD-L1 trap induced significantly larger tumor regression than mAb with no evidence of toxicity. Mechanistic studies revealed that PD-L1 trap, but not mAb, consistently reduced the M2 macrophage proportion in the fibrotic liver microenvironment and promoted cytotoxic interferon gamma (IFNγ)+tumor necrosis factor α (TNF-α)+CD8+T cell infiltration to the tumor. Moreover, PD-L1 trap treatment was associated with decreased tumor-infiltrating polymorphonuclear myeloid-derived suppressor cell (PMN-MDSC) accumulation, resulting in an inflamed TME with a high cytotoxic CD8+T cell/PMN-MDSC ratio conductive to anti-tumor immune response. Single-cell RNA sequencing analysis of two clinical cohorts demonstrated preferential PD-L1 expression in M2 macrophages in the fibrotic liver, thus supporting the translational potential of nano-PD-L1 trap for fibrotic HCC treatment.

Keywords: HCC; fibrosis; immune-checkpoint blockade; macrophage; nanomedicine.


Conflict of interest statement

Declaration of interests The PD-1 ligand trap has been licensed to OncoTrap, Inc., which was co-founded by R.L.

Figures

None
Graphical abstract
Figure 1
Figure 1
Uptake of LPD nanoparticle-parceled PD-L1 trap by fibrotic liver (A) Schematic diagram showing the structure of LPD nanoparticle-mediated PD-L1 trap. (B) Size distribution profile of LPD nanoparticle by dynamic light scattering (DLS) analysis. (C) Transmission electron microscopic image of the LPD nanoparticle. Scale bar: 100 nm. (D) Experimental schedule for determining the PD-L1 trap uptake in mice with or without liver fibrosis treated by corn oil and CCl4, respectively. (E) Liver morphology, H&E, and Sirius red staining of control normal liver and CCl4-induced fibrotic liver. Scale bar: 100 μm. (F) Western blot analysis of α-SMA and His-tagged PD-L1 trap protein expression in normal liver and fibrotic liver induced by CCl4. (G) ELISA analysis of His-tagged PD-L1 trap protein expression in normal and fibrotic livers. (H) Experimental schedule for determining the PD-L1 trap uptake in mice with or without liver fibrosis induced by control and HFHC diet, respectively. (I) Liver morphology, H&E, and Sirius red staining of control liver and HFHC-diet-induced fibrotic liver. Scale bar: 100 μm. (J) Western blot analysis of α-SMA and His-tagged PD-L1 trap in normal liver or fibrotic liver induced by HFHC diet. (K) ELISA analysis of His-tagged PD-L1 trap protein expression. n ≥ 3. Data were analyzed by unpaired t test and are presented as mean ± SE. ∗p < 0.05; ∗∗p < 0.01.
Figure 2
Figure 2
PD-L1 trap exhibits superior therapeutic effect in CCl4-induced fibrotic HCC model (A) Experimental schedule for IgG, anti-PD-L1, pGFP, or PD-L1 trap treatment in CCl4-induced fibrosis-associated HCC mouse model. (B) In vivo imaging and quantification of the luciferase signal expressed by RIL-175 mouse hepatoma cells. (C) Representative images of livers and tumors as well as endpoint tumor weight in individual groups. (D and E) Body weight (D) and histological examination (E) of different organs in different groups (n ≥ 8). Scale bar: 150 μm. Data were analyzed by one-way ANOVA (C) or two-way ANOVA (B and D) and are presented as mean ± SE. ∗p < 0.05; ∗∗p < 0.01; ∗∗∗p < 0.001.
Figure 3
Figure 3
M2 macrophage ablation by PD-L1 trap mitigates the immunosuppressive liver microenvironment (A) Heatmap of PD-L1 expression in macrophages (M1, M2), MDSCs (PMN-MDC, M-MDSC), T cells (CD4, CD8), and non-immune cells in fibrotic liver microenvironment. (B) Frequencies of total macrophage and M2 macrophage subtype treated by IgG, anti-PD-L1, pGFP, or PD-L1 trap. (C and D) Total CD8 or cytotoxic CD8+T cell proportion and their ratio to M2 macrophage in individual groups. n ≥ 7. Data were analyzed by one-way ANOVA and are presented as mean ± SE. ∗p < 0.05; ∗∗p < 0.01; ∗∗∗p < 0.001; ∗∗∗∗p < 0.0001.
Figure 4
Figure 4
PD-L1 trap promotes cytotoxic CD8+T cell tumor infiltration and represses intra-tumoral PMN-MDSCs in CCl4-induced fibrotic HCC (A) CD8+T cell percentage in the tumor of CCl4-induced fibrotic HCC treated by IgG, anti-PD-L1, pGFP, or PD-L1 trap. (B) Correlation analysis between intra-tumoral CD8+T cells and liver CD8, liver cytotoxic CD8, liver cytotoxic CD8+T cell/M2 macrophage ratio, or tumor weight. (C and D) IFN-γ and TNF-α expressions in tumor-infiltrating CD8+ T cells for individual groups. (E and F) Frequency of tumor-infiltrating cytotoxic CD8 and its correlation with total CD8, cytotoxic CD8, and cytotoxic CD8+T cell/M2 macrophage ratio in surrounding liver or tumor weight. (G) Proportions of M-MDSCs and PMN-MDSCSs in tumor of CCl4-induced fibrotic HCC model with different drug administrations. (H) Correlation between PMN-MDSCs and CD8, cytotoxic CD8+T cell, or tumor weight in fibrotic tumor. (I) Ratios of CD8+T cell/PMN-MDSCs and cytotoxic CD8+T cell/PMN-MDSCs in TME. (J) Tumor weight correlation analysis to the ratio of total CD8+T or cytotoxic CD8+T cell/PMN-MDSCs. n ≥ 7. Data were analyzed by Pearson correlation (B, F, H, and J) or one-way ANOVA and are presented as mean ± SE. ∗p < 0.05; ∗∗p < 0.01; ∗∗∗p < 0.001; ∗∗∗∗p < 0.0001.
Figure 5
Figure 5
Induction of T cell-inflamed TME by PD-L1 trap validated by IF staining in CCl4-induced fibrotic HCC (A and B) CD8 (A) and CD11b (B) and Ly6G co-immunofluorescence in tumors of CCl4-induced fibrotic HCC. CD8-positive cells, or co-localization of CD11b-positive and Ly6G-positive cells, are shown in the merged images. Hoechst served as positive control for cell nuclei staining. Scale bar: 100 μm. n ≥ 3. Data were analyzed by one-way ANOVA and are presented as mean ± SE. ∗p < 0.05; ∗∗p < 0.01.
Figure 6
Figure 6
PD-L1 trap exhibits superior therapeutic effect in HFHC-diet-induced fibrotic HCC (A) Schematic diagram showing the establishment of HFHC-diet-induced fibrotic HCC. (B) Sirius red staining of HFHC-diet-induced fibrotic HCC treated with anti-PD-L1 or PD-L1 trap. Scale bar: 100 μm. (C) Endpoint tumor weight and tumor incidence of mice treated with anti-PD-L1 or PD-L1 trap treatment (n ≥ 8). (D) Survival analysis of mice treated with anti-PD-L1 or PD-L1 trap (n ≥ 8). (E) Distribution of PD-L1 in fibrotic liver microenvironment. (F) Macrophage and M2 subtype proportion in liver with indicated treatments. (G) Cytotoxic CD8+T cells and the ratio of cytotoxic CD8+T cell/M2 macrophage in liver of different groups. n ≥ 5. (H and I) CD8 (H) or CD11b (I) and Ly6G co-immunofluorescence in tumors of HFHC-diet-induced fibrotic HCC. CD8-positive cells, or co-localization of CD11b-positive and Ly6G-positive cells, are shown in merged images. Hoechst served as positive control for cell nuclei staining. Scale bar: 100 μm. n ≥ 3. Data were analyzed by Log-rank (Mantel-Cox) test or unpaired t test and are presented as mean ± SE. ∗p < 0.05; ∗∗p < 0.01.
Figure 7
Figure 7
PD-L1 expression profile in patients with primary HCC by scRNA-seq analysis (A) T-SNE plot of all cells from 12 patients with primary HCC with paired adjacent liver and tumor tissues. 22 clusters were further classified into four major populations including non-immune cells, lymphocytes, macrophages, and other myeloid cells. (B) Dot plot showing the average expression and percent expression of CD274 in individual cell population identified with linage markers in both liver and tumor tissues. (C) Density plot of CD274 expression in macrophage and M2 macrophage-related signature genes including MRC1, CTSA, CTSC, LYVE1, CCL13, and VEGFB. (D) T-SNE plot of all cells from 4 patients with primary HCC with paired adjacent liver and tumor tissues. 29 clusters were grouped into four major populations. (E) The dot plot of other linage markers used to identify different cell populations. (F) Density plot of CD274 in macrophage and gene expression related to M2 macrophage as shown in (C).

References

    1. Llovet J.M., Castet F., Heikenwalder M., Maini M.K., Mazzaferro V., Pinato D.J., Pikarsky E., Zhu A.X., Finn R.S. Immunotherapies for hepatocellular carcinoma. Nat. Rev. Clin. Oncol. 2022;19:151–172. - PubMed
    1. Das S., Johnson D.B. Immune-related adverse events and anti-tumor efficacy of immune checkpoint inhibitors. J. Immunother. Cancer. 2019;7:306. - PMC - PubMed
    1. Tumeh P.C., Hellmann M.D., Hamid O., Tsai K.K., Loo K.L., Gubens M.A., Rosenblum M., Harview C.L., Taube J.M., Handley N., et al. Liver metastasis and treatment outcome with anti-PD-1 monoclonal antibody in patients with melanoma and NSCLC. Cancer Immunol. Res. 2017;5:417–424. - PMC - PubMed
    1. Hegde P.S., Chen D.S. Top 10 challenges in cancer immunotherapy. Immunity. 2020;52:17–35. - PubMed
    1. Tiegs G., Lohse A.W. Immune tolerance: what is unique about the liver. J. Autoimmun. 2010;34:1–6. - PubMed

Publication types

MeSH terms

LinkOut - more resources