Review
. 2022 Jul 26;34(2):133-147.
doi: 10.4103/joco.joco_308_21. eCollection 2022 Apr-Jun.

Efficacy and Safety of Aflibercept Therapy for Diabetic Macular Edema: A Systematic Review and Meta-Analysis

Affiliations
Review

Efficacy and Safety of Aflibercept Therapy for Diabetic Macular Edema: A Systematic Review and Meta-Analysis

Sangeetha Santhakumaran et al. J Curr Ophthalmol. .

Abstract

Purpose: To assess the real-world efficacy and safety of aflibercept for the treatment of diabetic macular edema (DME).

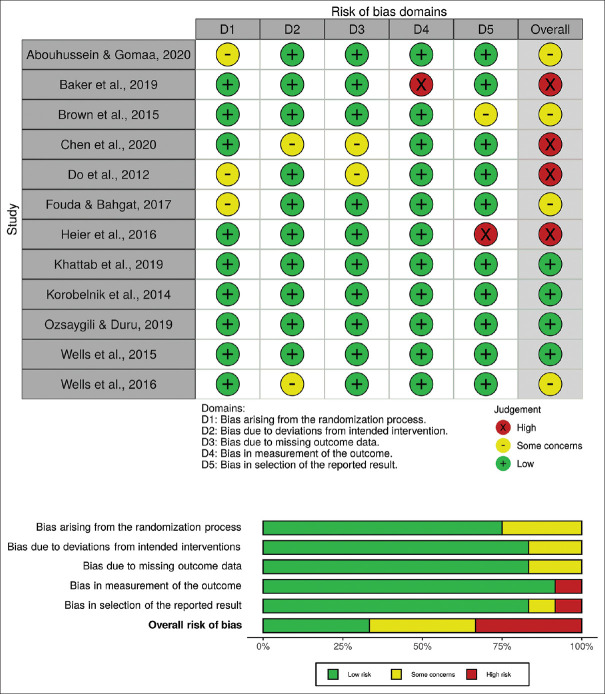
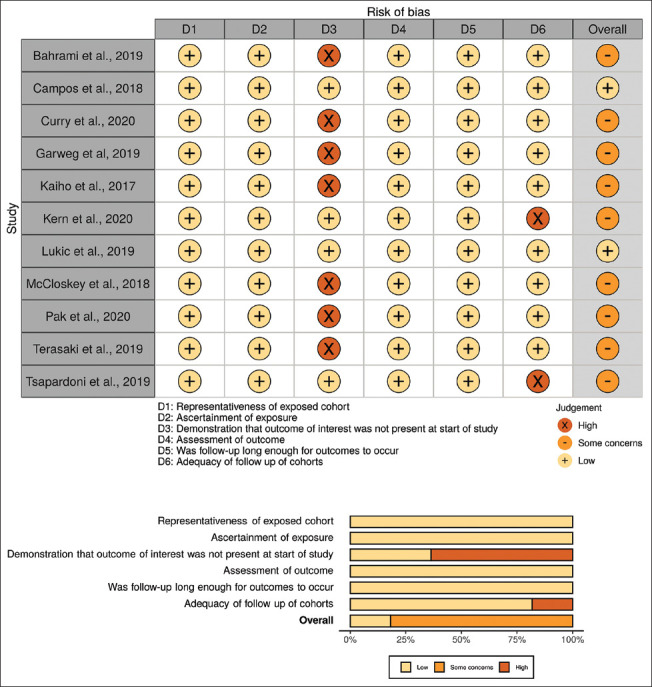
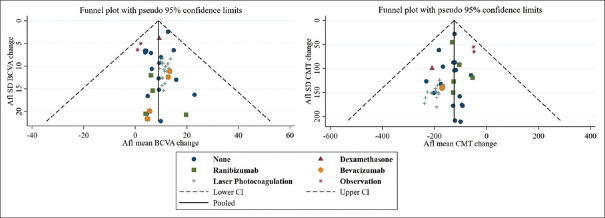
Methods: A systematic search was conducted across multiple databases. Articles were included if participants had DME and received aflibercept treatment for a minimum of 52 ± 4 weeks. Primary outcomes included changes in best-corrected visual acuity (BCVA) and central macular thickness (CMT). A risk of bias assessment of studies was completed, pooled estimates were obtained, and a meta-regression was performed. Information on adverse events was collected.

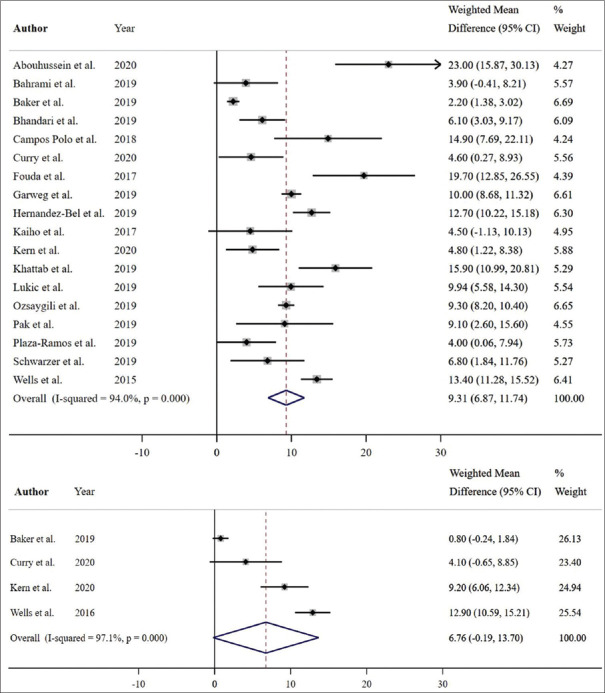
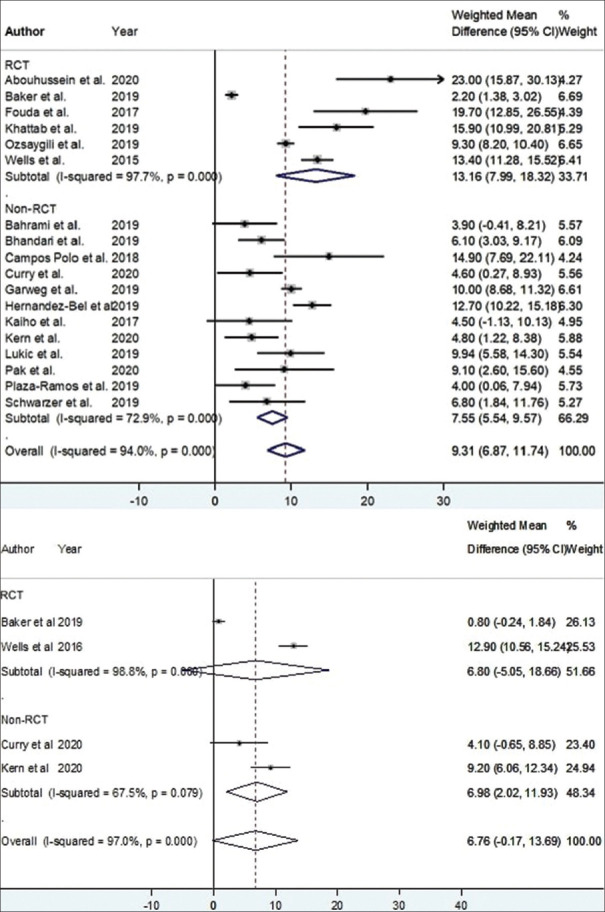
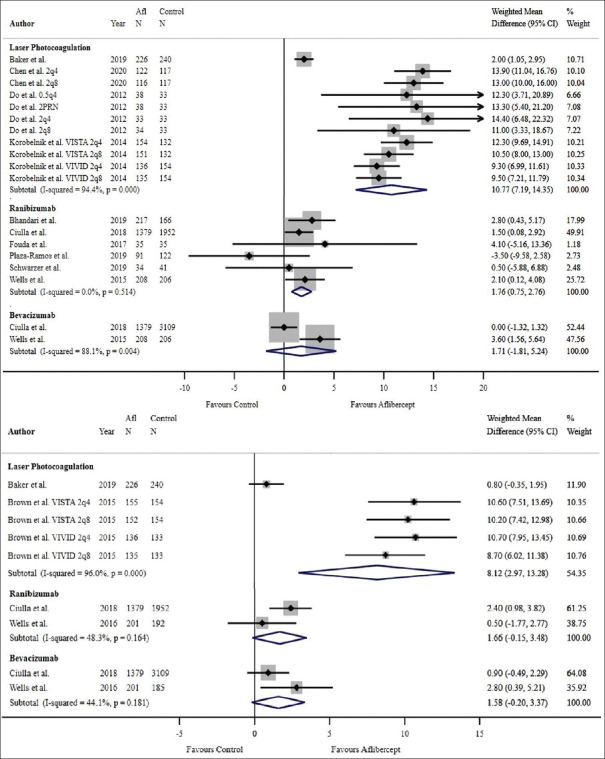
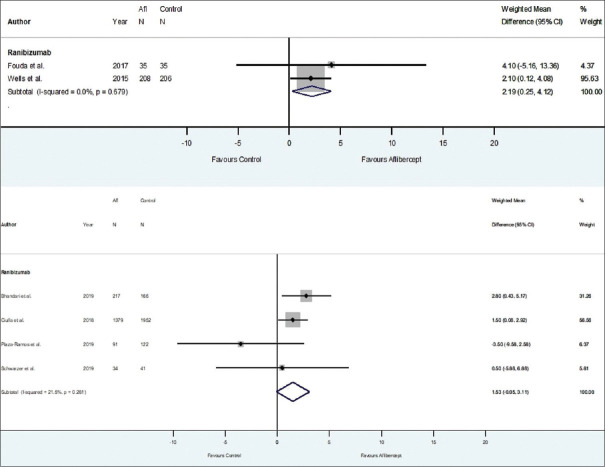
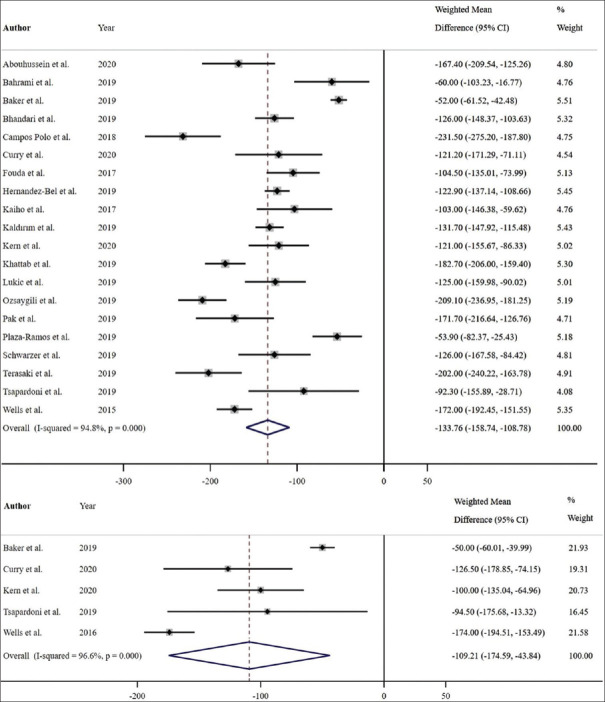
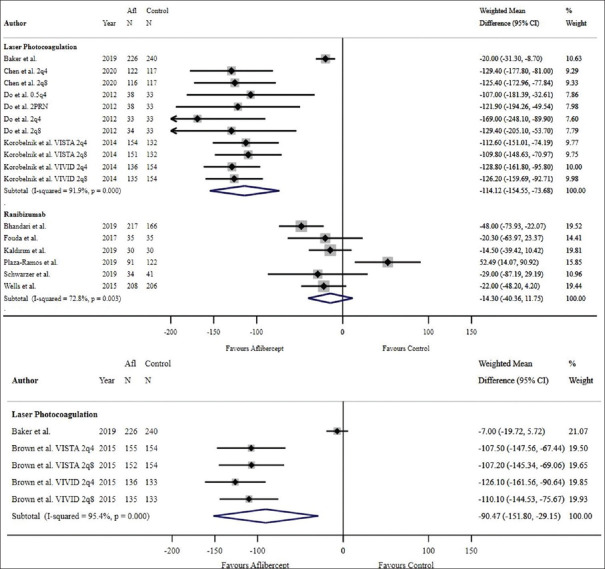
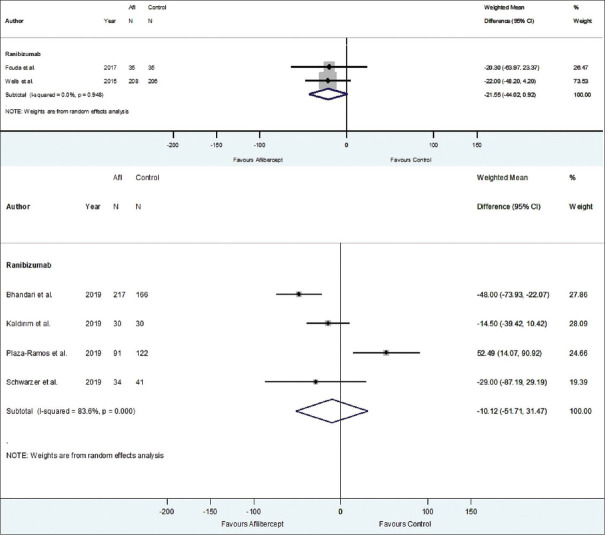
Results: The search yielded 2112 articles, of which 30 were included. Aflibercept was more effective than laser photocoagulation functionally (12-month BCVA-weighted mean difference [WMD] = 10.77 letters, P < 0.001; 24 months = 8.12 letters, P < 0.001) and anatomically (12-month CMT WMD = -114.12 μm, P < 0.001; 24 months = -90.4 μm, P = 0.004). Compared to bevacizumab, aflibercept was noninferior at improving BCVA at 12 months (WMD = 1.71 letters, P = 0.34) and 24 months (WMD = 1.58 letters, P = 0.083). One study found that aflibercept was more effective than bevacizumab anatomically at 1 and 2 years (P < 0.001 at 12 and 24 months). Compared to ranibizumab, aflibercept rendered a greater improvement in BCVA at 1 year (WMD = 1.76 letters, P = 0.001), but not 2 years (WMD = 1.66 letters, P = 0.072). CMT was not significantly different between both therapies at 12 months (WMD = -14.30 μm, P = 0.282) and 24 months (P = 0.08). One study reported greater functional improvement with aflibercept compared with dexamethasone (P = 0.004), but inferiority in reducing CMT (P < 0.001). Meta-regression analysis demonstrated that dosing schedule was found to impact outcomes at 12 and 24 months, while study design and sample size did not impact outcomes at 12 months. There were minimal safety concerns using aflibercept therapy.

Conclusions: Aflibercept is a safe and effective therapy option for DME in the clinical setting, performing superiorly to laser photocoagulation. Evidence regarding comparisons with bevacizumab, ranibizumab, and dexamethasone is mixed and limited.

Keywords: Aflibercept; Antivascular endothelial growth factor; Diabetic macular edema; Eylea; Retina.


Conflict of interest statement

There are no conflicts of interest.

Figures

Figure 1
Figure 1
Flow diagram of studies included in this meta-analysis. Preferred Reporting Items for Systematic Reviews and Meta-Analyses flow chart outlining number of studies screened, assessed for eligibility, and included in review
Figure 2
Figure 2
Traffic plot and summary plot of the included randomized controlled trials (RCTs). Risk of bias assessment of RCT studies using version 2 of the Cochrane risk-of-bias tool. Total score calculated based on the algorithm suggested by the Cochrane Collaboration.
Figure 3
Figure 3
A traffic plot and summary plot of the included cohort studies. Risk of bias assessment of non-randomized controlled trial studies using the Newcastle-Ottawa Scale (NOS). An overall NOS score of 7 and above is considered low risk, a score of 5 to 7 is considered to have some concerns, and a score under 5 is considered high risk.
Figure 4
Figure 4
Traffic plot and summary plot of the included non-cohort studies. Risk of bias assessment of non-cohort, non-randomized controlled trial studies without a comparator group using a modified version of the Newcastle-Ottawa Scale. A score of 6 is considered low risk, a score of 4 or 5 is considered to have some concerns, and a score of 3 and under is considered high risk.
Figure 5
Figure 5
Funnel plots assessing publication bias of studies evaluating best-corrected visual acuity (pictured top) and central macular thickness (pictured bottom). Afl: Aflibercept, SD: Standard deviation, CI: Confidence interval
Figure 6
Figure 6
Estimated weighted mean difference of baseline to 12-month (pictured top), and baseline to 24-month best-corrected visual acuity (pictured bottom) with aflibercept therapy as measured using Early Treatment Diabetic Retinopathy Study (ETDRS) letters. Dashed line represents weighted mean difference. 12-month weighted mean difference: 9.31 ETDRS letters, P < 0.001. 24-month weighted mean difference: 6.76 ETDRS letters, P = 0.056. Values reported as crude mean difference, without adjustment for covariates. CI: Confidence interval
Figure 7
Figure 7
Estimated weighted mean difference of baseline to 12-month (pictured top), and baseline to 24-month best-corrected visual acuity (pictured bottom) with aflibercept therapy stratified by study design as measured using Early Treatment Diabetic Retinopathy Study (ETDRS) letters. Dashed line represents weighted mean difference. 12-month weighted mean difference randomized controlled trial (RCT) 13.16 ETDRS letters, P < 0.001. 12-month weighted mean difference non-RCT: 7.55 ETDRS letters, P < 0.001. 24-month weighted mean difference RCT: 6.80 ETDRS letters, P = 0.261. 24-month weighted mean difference non-RCT: 6.98 ETDRS letters, P = 0.006. Values reported as crude mean difference, without adjustment for covariates. CI: Confidence interval.
Figure 8
Figure 8
Estimated weighted mean difference of improvement in best-corrected visual acuity with aflibercept in comparison with other therapies at 12 months (pictured top) and 24 months (pictured bottom) as measured using Early Treatment Diabetic Retinopathy Study (ETDRS) letters. At 12 months: Weighted mean difference between aflibercept and laser photocoagulation: 10.77 ETDRS letters, P < 0.001, weighted mean difference between aflibercept and ranibizumab: 1.76 ETDRS letters, P = 0.001, weighted mean difference between aflibercept and bevacizumab: 1.71 ETDRS letters, P = 0.341. Single-study comparisons (not pictured): Weighted mean difference between aflibercept and dexamethasone: 2.90 ETDRS letters, P = 0.004. At 24 months: Weighted mean difference between aflibercept and laser photocoagulation: 8.12 ETDRS letters, P < 0.001, weighted mean difference between aflibercept and ranibizumab: 1.66 ETDRS letters, P = 0.072, weighted mean difference between aflibercept and bevacizumab: 1.58 ETDRS letters, P = 0.083. Note: Only comparator groups with more than one study were included in forest plots. Afl: Aflibercept, 2q4: 2 mg every 4 weeks, 2q8: 2 mg every 8 weeks, 0.5q: 0.5 mg every 4 weeks, 2PRN: 2 mg as needed; CI: Confidence interval.
Figure 9
Figure 9
Estimated weighted mean difference of improvement in best-corrected visual acuity with aflibercept in comparison with ranibizumab at 12 months stratified by randomized controlled trial (RCT) (pictured top) vs. non-RCT (pictured bottom) as measured using Early Treatment Diabetic Retinopathy Study (ETDRS) letters. 12-month RCTs: Weighted mean difference between aflibercept and ranibizumab: 2.19 ETDRS letters, P = 0.027. 12-month non-RCTs: Weighted mean difference between aflibercept and ranibizumab: 1.53 ETDRS letters, P = 0.058. Note: Only comparator groups with more than one study in both RCT and non-RCT groups were represented in stratified analyses; thus, no comparator groups were represented in stratified analyses at 24 months. Afl: aflibercept, CI: Confidence interval.
Figure 10
Figure 10
Estimated weighted mean difference of baseline to 12-month (pictured top), and baseline to 24-month central macular thickness (μm) (pictured bottom). Dashed line represents weighted mean difference. 12-month weighted mean difference: –133.76 μm, P < 0.001. 24-month weighted mean difference: –109.21 μm, P = 0.001. Values reported as crude mean difference, without adjustment for covariates. CI: Confidence interval
Figure 11
Figure 11
Estimated weighted mean difference of baseline to 12-month (pictured top), and baseline to 24-month central macular thickness (μm) (pictured bottom) stratified by study design. Dashed line represents weighted mean difference. 12-month randomized controlled trial (RCT) weighted mean difference: –147.52 μm, P < 0.001. 12-month non-RCT weighted mean difference: –127.48 μm, P < 0.001. 24-month RCT weighted mean difference: –111.66 μm, P = 0.072. 24-month non-RCT weighted mean difference: –106.64 μm, P < 0.001. Values reported as crude mean difference, without adjustment for covariates. CI: Confidence interval.
Figure 12
Figure 12
Estimated weighted mean difference of reduction in central macular thickness (μm) with aflibercept in comparison with other therapies at 12 months (pictured top) and 24 months (pictured bottom). At 12 months: Weighted mean difference between aflibercept and laser photocoagulation: –114.12 μm, P < 0.001, weighted mean difference between aflibercept and ranibizumab: –14.30 μm, P = 0.282. Single-study comparisons (not pictured): Weighted mean difference between aflibercept and bevacizumab –68.00 μm, P < 0.001, weighted mean difference between aflibercept and dexamethasone: 108.40 μm, P < 0.001. At 24 months: Weighted mean difference between aflibercept and laser photocoagulation: –90.47 μm, P = 0.004. Single-study comparisons (not pictured): Weighted mean difference between aflibercept and ranibizumab: –22.00 μm, P = 0.008, weighted mean difference between aflibercept and bevacizumab: –45.00 μm, P < 0.001. Note: Only comparator groups with more than one study were included in forest plots. Afl: Aflibercept; 2q4: 2 mg every 4 weeks, 2q8: 2 mg every 8 weeks, 0.5q: 0.5 mg every 4 weeks, 2PRN: 2 mg as needed, CI: Confidence interval
Figure 13
Figure 13
Estimated weighted mean difference of improvement in central macular thickness (μm) with aflibercept in comparison with ranibizumab at 12 months stratified by randomized controlled trial (RCT) (pictured top) vs. non-RCT (pictured bottom). 12-month RCTs: Weighted mean difference between aflibercept and ranibizumab: –21.55 μm, P = 0.060. 12-month non-RCTs: Weighted mean difference between aflibercept and ranibizumab: –10.12 μm, P = 0.633. Note: Only comparator groups with more than one study in RCT and non-RCT groups were represented in stratified analyses; thus, no comparator groups were represented in stratified analyses at 24 months. Afl: Aflibercept, CI: confidence interval

Similar articles

Cited by

References

    1. Ding J, Wong TY. Current epidemiology of diabetic retinopathy and diabetic macular edema. Curr Diab Rep. 2012;12:346–54. - PubMed
    1. Kim EJ, Lin WV, Rodriguez SM, Chen A, Loya A, Weng CY. Treatment of diabetic macular edema. Curr Diab Rep. 2019;19:68. - PubMed
    1. Canada H, editor. Health Canada. Avastin. Drug Product Database. Ottawa, Ontario, Canada: Health Canada; 2005.
    1. Lucentis. Government of Canada; 2007. [Last accessed on 2021 Jul 10]. Available from: https://health-products.canada.ca/dpd-bdpp/info.do?lang=en&code=78217 .
    1. Diabetic Retinopathy Clinical Research Network. Wells JA, Glassman AR, Ayala AR, Jampol LM, Aiello LP, et al. Aflibercept, bevacizumab, or ranibizumab for diabetic macular edema. N Engl J Med. 2015;372:1193–203. - PMC - PubMed