. 2022 Sep 6:13:1004745.
doi: 10.3389/fphar.2022.1004745. eCollection 2022.

Integrated transcriptomics and metabolomics analysis of the hippocampus reveals altered neuroinflammation, downregulated metabolism and synapse in sepsis-associated encephalopathy

Affiliations

Integrated transcriptomics and metabolomics analysis of the hippocampus reveals altered neuroinflammation, downregulated metabolism and synapse in sepsis-associated encephalopathy

Kejia Xu et al. Front Pharmacol. .

Abstract

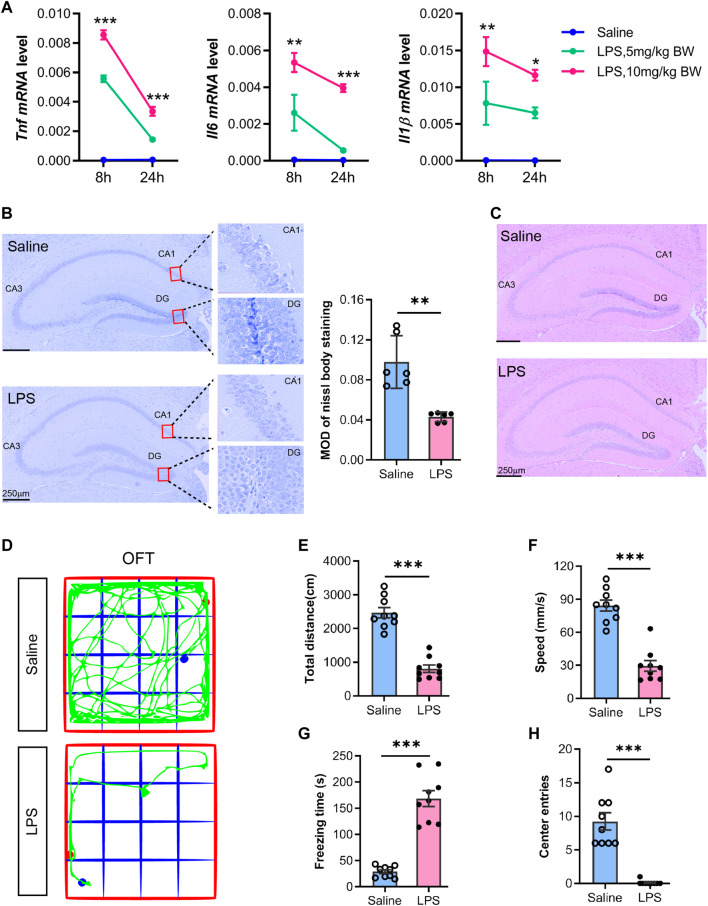
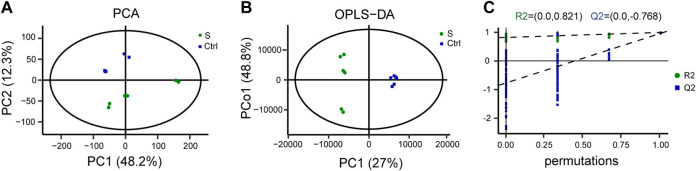
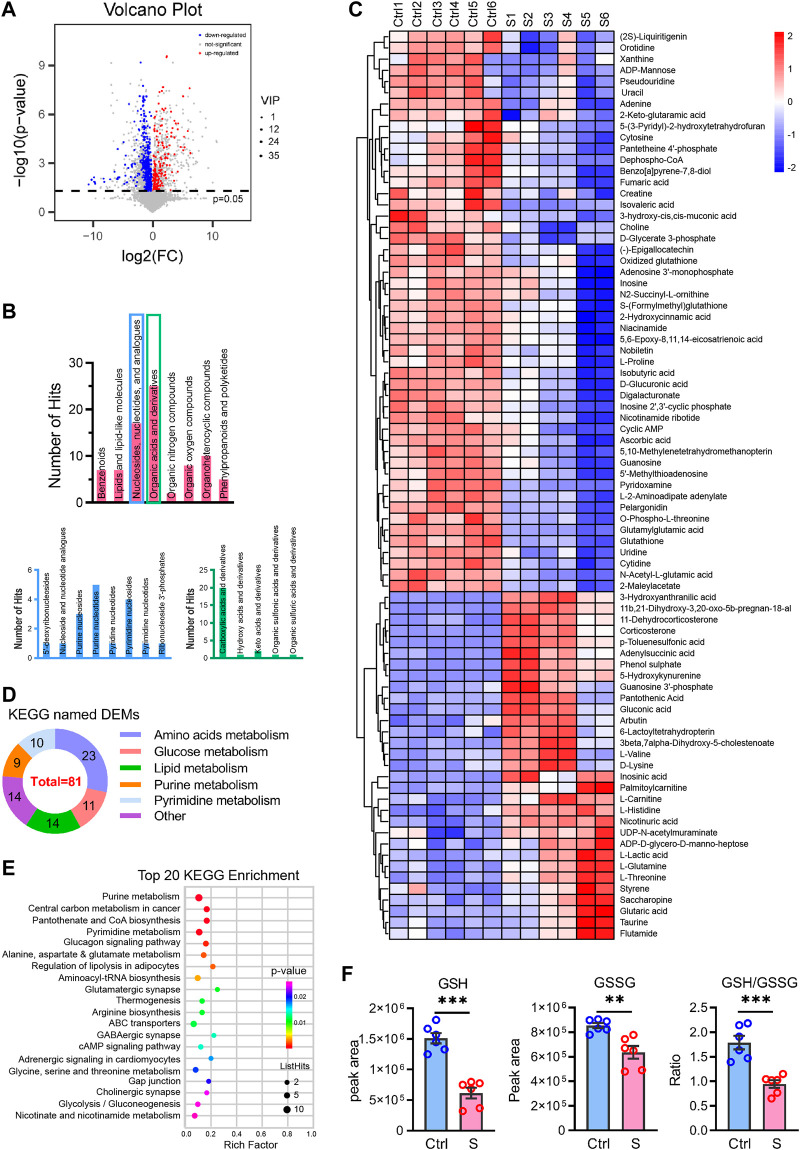
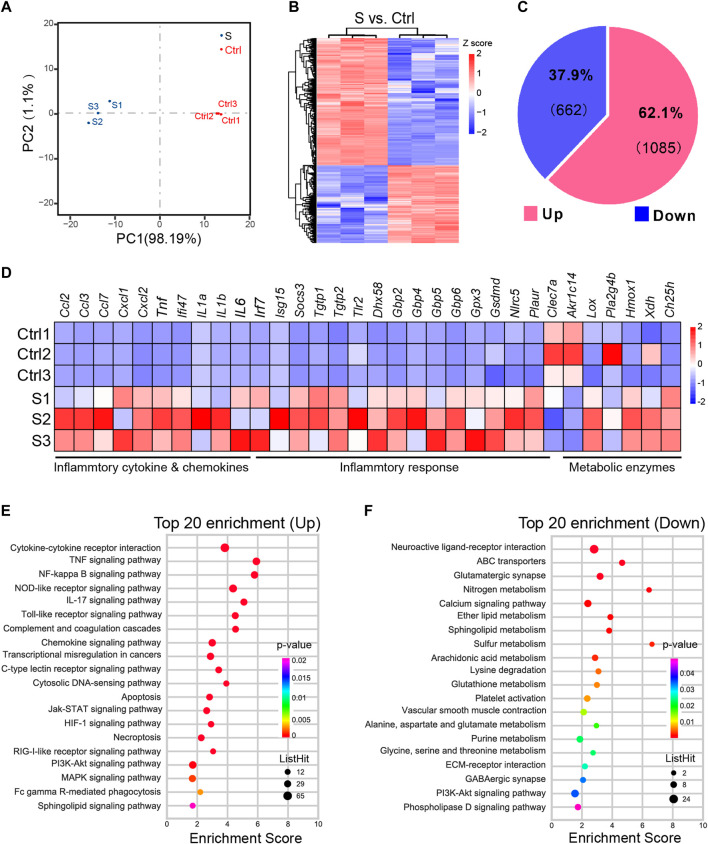
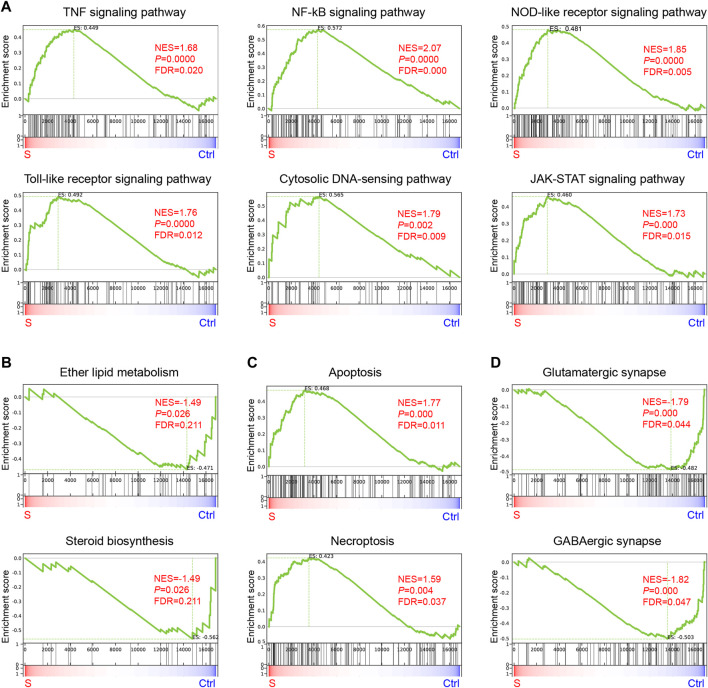
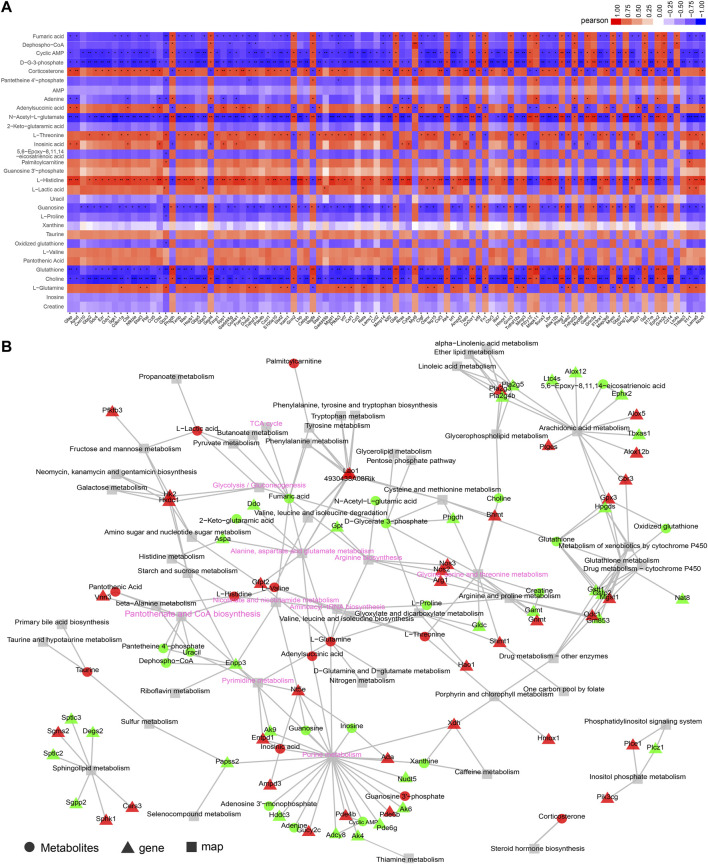
Sepsis-associated encephalopathy (SAE) is an intricated complication of sepsis that brings abnormal emotional and memory dysfunction and increases patients' mortality. Patients' alterations and abnormal function seen in SAE occur in the hippocampus, the primary brain region responsible for memory and emotional control, but the underlying pathophysiological mechanisms remain unclear. In the current study, we employed an integrative analysis combining the RNA-seq-based transcriptomics and liquid chromatography/mass spectrometry (LC-MS)-based metabolomics to comprehensively obtain the enriched genes and metabolites and their core network pathways in the endotoxin (LPS)-injected SAE mice model. As a result, SAE mice exhibited behavioral changes, and their hippocampus showed upregulated inflammatory cytokines and morphological alterations. The omics analysis identified 81 differentially expressed metabolites (variable importance in projection [VIP] > 1 and p < 0.05) and 1747 differentially expressed genes (Foldchange >2 and p < 0.05) were detected in SAE-grouped hippocampus. Moreover, 31 compounds and 100 potential target genes were employed for the Kyoto Encyclopedia of Genes and Genomes (KEGG) Markup Language (KGML) network analysis to explore the core signaling pathways for the progression of SAE. The integrative pathway analysis showed that various dysregulated metabolism pathways, including lipids metabolism, amino acids, glucose and nucleotides, inflammation-related pathways, and deregulated synapses, were tightly associated with hippocampus dysfunction at early SAE. These findings provide a landscape for understanding the pathophysiological mechanisms of the hippocampus in the progression of SAE and pave the way to identify therapeutic targets in future studies.

Keywords: RNA sequencing; integrative analysis; metabolomics; multi-omics analysis; neuroinflammation; sepsis-associated encephalopathy.


Conflict of interest statement

Author GC is employed by Connect Biopharma Ltd. The remaining authors declare that the research was conducted in the absence of any commercial or financial relationships that could be construed as a potential conflict of interest.

Figures

FIGURE 1
FIGURE 1
Proinflammatory cytokines and morphological alterations in the hippocampus with neurobehavior changes in mice undergoing acute sepsis phase. (A) RT-qPCR analysis of proinflammatory cytokines (TNF, IL6, and IL1Β) alteration in the hippocampus from saline- or LPS-injected (5 or 10 mg/kg body weight) mice. The mRNA expression was normalized to GAPDH. Data are presented as mean ± SEM (n = 3). Two-way ANOVA with Tukey’s multiple comparisons tests, *p < 0.05, **p < 0.01, ***p < 0.001 (compared with LPS 5 mg/kg body weight at indicated time points). (B) Representative Nissl staining of the hippocampus from saline- or LPS-injected mice. The mean optical intensity was quantified and tested with an unpaired t-test. Data are presented as mean ± SEM (two sections per mouse, n = 6), **p < 0.01. Bar 250 µm. (C) Hematoxylin-eosin staining of the hippocampus from saline- or LPS-injected mice (n = 3). (D) Representative trajectory of the total distance (E), speed (F), freezing time (G), and center entries (H) in the LPS mice and saline groups. Comparisons were performed with an unpaired t-test. Data are presented as mean ± SEM (n = 9), **p < 0.01, ***p < 0.001.
FIGURE 2
FIGURE 2
LC-MS-based metabolomic analysis of the hippocampus in the SAE (S) and control groups (Ctrl). (A) Principal component analysis (PCA) scores plot (n = 6). (B) Ortholog partial least squares-discriminate analysis (OPLS-DA) scores. (C) The permutation plot.
FIGURE 3
FIGURE 3
Differentially expressed metabolites profiling the hippocampus in the SAE (S) and control groups (Ctrl). (A) Volcano plot showing differentially expressed metabolites (DEMs) profiling of hippocampus between the S and the Ctrl group, the red and blue bubble showed the up- and downregulated metabolites, respectively. (B) The classes of differential expressed metabolites in the SAE-grouped hippocampus. (C) The heatmap showed the relative contents of DEMs. S1–S6, the sepsis group; Ctrl1– 6, the control group. (D) The classes of metabolism of DEMs in the KEGG (n = 3). (E) The top 20 KEGG enrichment items of DEMs. (F) The peak area of GSH and GSSG, and the ratio of GSH/GSSG, Statistic comparisons were performed by unpaired t-test. Data are presented as mean ± SEM (n = 6), *p < 0.05, **p < 0.01.
FIGURE 4
FIGURE 4
Differentially expressed genes profiling of the hippocampus in the SAE (S) and control groups (Ctrl). (A) The PCA analysis of hippocampus from SAE- and Ctrl-grouped mice (n = 3). (B) The heatmap of differentially expressed genes (DEGs) with a cutoff log2FC of >1 and p of <0.05 (n = 3). (C) The pie chart illustrating the composition of up- and downregulated DEGs. (D) Heatmap of RT-qPCR analysis showing upregulation of inflammatory cytokines and chemokines, inflammatory response, and metabolic enzymes gene expression in the hippocampal tissues, i.p., injected with LPS (n = 3). (E,F) The top 20 KEGG enrichment of upregulated (E) or downregulated DEGs (F).
FIGURE 5
FIGURE 5
Gene enrichment analysis of genes enriched in the hippocampus during the progression of SAE. (A–D) KEGG Terms related to inflammation (A), lipid metabolism (B), apoptosis and necroptosis (C), and synapse (D).
FIGURE 6
FIGURE 6
Integrative analysis of transcriptome and metabolome. (A) Correlation heatmap of links between top 100 expressed genes and metabolites based on the Pearson correlation algorithm. The color bar denotes the value of correlation coefficiency, *p < 0.05, **p < 0.01, ***p < 0.001. (B) KGML network building based on the DEGs and DEMs to obtain the critical nodes and metabolism pathways. The triangle with red or green denotes the up- or downregulated DEGs, respectively. The circle with red or green denotes the up- or downregulated DEMs, respectively, and the square denotes the pathway. The key metabolic or signaling pathways were shown with pink fonts.

Similar articles

Cited by

References

    1. Ament Z., Bevers M. B., Wolcott Z., Kimberly W. T., Acharjee A. (2021). Uric acid and gluconic acid as predictors of hyperglycemia and cytotoxic injury after stroke. Transl. Stroke Res. 12 (2), 293–302. 10.1007/s12975-020-00862-5 - DOI - PMC - PubMed
    1. Amunugama K., Pike D. P., Ford D. A. (2021). The lipid biology of sepsis. J. Lipid Res. 62, 100090. 10.1016/j.jlr.2021.100090 - DOI - PMC - PubMed
    1. Anders S., Huber W. (2012). Differential expression of RNA-Seq data at the gene level - the DESeq package[J]. Heidelberg,Germany: European Molecular Biology Laboratory (EMBL).
    1. Aoyama K. (2021). Glutathione in the brain. Int. J. Mol. Sci. 22 (9), 5010. ARTN. 10.3390/ijms22095010 - DOI - PMC - PubMed
    1. Bolger A. M., Lohse M., Usadel B. (2014). Trimmomatic: a flexible trimmer for Illumina sequence data. Bioinformatics 30 (15), 2114–2120. 10.1093/bioinformatics/btu170 - DOI - PMC - PubMed