. 2022 Aug 29;18(14):5438-5458.
doi: 10.7150/ijbs.74675. eCollection 2022.

Downregulation of PPARα mediates FABP1 expression, contributing to IgA nephropathy by stimulating ferroptosis in human mesangial cells

Affiliations

Downregulation of PPARα mediates FABP1 expression, contributing to IgA nephropathy by stimulating ferroptosis in human mesangial cells

Jingkui Wu et al. Int J Biol Sci. .

Abstract

Immunoglobulin A nephropathy (IgAN) is the commonest primary glomerulonephritis, and a major cause of end-stage renal disease; however, its pathogenesis requires elucidation. Here, a hub gene, FABP1, and signaling pathway, PPARα, were selected as key in IgAN pathogenesis by combined weighted gene correlation network analysis of clinical traits and identification of differentially expressed genes from three datasets. FABP1 and PPARα levels were lower in IgAN than control kidney, and linearly positively correlated with one another, while FABP1 levels were negatively correlated with urinary albumin-to-creatinine ratio, and GPX4 levels were significantly decreased in IgAN. In human mesangial cells (HMCs), PPARα and FABP1 levels were significantly decreased after Gd-IgA1 stimulation and mitochondria appeared structurally damaged, while reactive oxygen species (ROS) and malondialdehyde (MDA) were significantly increased, and glutathione and GPX4 decreased, relative to controls. GPX4 levels were decreased, and those of ACSL4 increased on siPPARα and siFABP1 siRNA treatment. In PPARα lentivirus-transfected HMCs stimulated by Gd-IgA1, ROS, MDA, and ACSL4 were decreased; glutathione and GPX4, and immunofluorescence colocalization of PPARα and GPX4, increased; and damaged mitochondria reduced. Hence, PPARα pathway downregulation can reduce FABP1 expression, affecting GPX4 and ACSL4 levels, causing HMC ferroptosis, and contributing to IgAN pathogenesis.

Keywords: Fatty acid binding protein 1; Ferroptosis; Human mesangial cells; Immunoglobulin A nephropathy; Peroxisome proliferator-activated receptor α; Weighted gene correlation network analysis.


Conflict of interest statement

Competing Interests: The authors have declared that no competing interest exists.

Figures

Figure 1
Figure 1
Flow diagram of the study design and workflow.
Figure 2
Figure 2
Screening DEGs from three datasets. Volcano plots of DEGs from GSE37460 (n = 181) (A), GSE93798 (n = 347) (B), and GSE104948 (n = 199) (C) are presented. Orange points represent upregulated genes, turquoise points represent downregulated genes, and grey points represent genes with no significant difference in expression (threshold, |fold-change| ≥ 1.0 and adjusted P < 0.05). (C, D, and F) Hierarchical cluster heatmaps of the top 50 DEGs from GSE37460 (C), GSE93798 (E), and GSE104948 (F) (threshold, |fold-change| ≥ 1.0 and adjusted P < 0.05). (G, H) Venn diagrams showing DEGs common to the three datasets; 14 downregulated (G) and 16 upregulated (H) DEGs were identified.
Figure 3
Figure 3
Identification of hub genes among overlapping downregulated DEGs. (A-D) 14 downregulated common DEGs were analyzed with the cytoHubba plugin of Cytoscape using four algorithms to assess betweenness (A), degree (B), radiality (C), and stress (D). Different colors represent different levels of connectivity with other genes in the PPI network. (E) Violin plot of initial expression after removal of batch effects for the top 5 key genes, showing that the 5 key genes were clearly decreased in patients with IgAN relative to healthy controls (P < 0.01). (F) ROC curve analysis of the top 5 key genes. AUC (95% CI), sensitivity, and specificity values for ALB, FABP1, GP6C, PAH, and PCK1 were calculated by ROC curve analysis. (G) Verification of the 5 hub genes (ALB, FABP1, GP6C, PAH, and PCK1) by ROC curve analysis in the GSE93798 dataset.
Figure 4
Figure 4
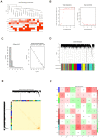
Identification of significant modules related to clinical traits by WGCNA. (A) Hierarchical clustering dendrogram of samples from the GSE93798 dataset. Clinical traits related to kidney function are displayed at the bottom of the plot. (B, C) Analysis of scale-free fit index and mean connectivity for various soft-threshold powers. The scale-free topology selected in our study was β = 9. (D) Hierarchical clustering dendrogram of different genes based on topological overlap. Modules were based on branches of the clustering tree. (E) Heatmap describing TOM among 1000 selected genes included in the WGCNA. Darker colors represent higher overlap and lighter colors correspond to lower overlap. Gene dendrogram and module assignment are shown on the left side and above. (F) Correlation between module eigengenes and clinical traits of IgAN. Each row corresponds to a module eigengene and columns represent clinical features. Each cell contains correlation and P values. The turquoise module was closely related to kidney function (ACR).
Figure 5
Figure 5
The relationship between clinical data and GO and KEGG enrichment analysis of genes in the turquoise module. (A) Scatterplots showing the relationships of GS and MM with ACR. The correlation coefficient between GS and ACR was 0.26 (P = 7.7e-18). FABP1 had the highest GS and MM values for ACR (GS = 0.30 and MM = 0.76) relative to other genes in the turquoise module. (B) The expression distribution of 1060 genes in the turquoise module presented as a heatmap and bar graph. (C) GO enrichment analyses of genes in the turquoise module showing 32 significantly enriched Gene Ontology biological process terms (threshold, count ≥ 2 and P < 0.01). (D) KEGG pathways significantly enriched for the turquoise module, including PPAR signaling, are shown (threshold, count ≥ 2 and P < 0.01).
Figure 6
Figure 6
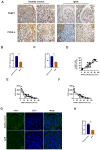
Levels of FABP1 and PPARα were decreased in IgAN renal tissues and closely related to ACR. (A-C) IHC and quantification of FABP1 and PPARα in human renal tissue. (D) Pearson correlation analysis of the relationship between FABP1 and PPARα expression. Decreased FABP1 expression levels were linearly positively correlated with those of PPARα (r = 0.9198, R2 = 0.8361, 95% CI: 0.8248-1.015). (G, H) Immunofluorescence detection of the ferroptosis marker, GPX4, in kidney tissue specimens; GPX4 protein levels were significantly decreased in IgAN tissues. Scale bar, 50 μm. Data are presented as mean ± SEM (patients with IgAN, n = 63 and healthy controls, n = 12). **P < 0.01.
Figure 7
Figure 7
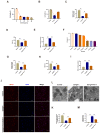
Gd-IgA1 leads to ferroptosis in HMCs. (A) Stimulation of HMCs with the ferroptosis inducer, erastin, significantly decreased cell viability at an erastin concentration of 5 μg/mL. HMC viability increased (B), levels of ROS and MDA decreased (C, E), and GSH levels increased (D) after intervention with the specific ferroptosis inhibitor, ferrostatin-1. (F) HMCs were exposed to different concentrations (1 μg/mL, 10 μg/mL, 100 μg/mL, 1 mg/mL, 10 mg/mL, and 100 mg/mL) of Gd-IgA1 for 24 h, and cell viability decreased significantly on treatment with 1 mg/ml Gd-IgA1. (G-I) After intervention with the ferroptosis specific inhibitor, ferrostatin-1, levels of ROS and MDA in HMCs were significantly decreased, and GSH levels were significantly increased, compared with the Gd-IgA1 group. (J, K) Expression levels of the ferroptosis marker, GPX4, were significantly decreased relative to the control group after HMCs were stimulated with Gd-IgA1. Scale bar, 50 μm. (L, M) TEM results showing that mitochondrial structure was significantly damaged in HMCs stimulated by Gd-IgA1. Mitochondrial damage score was significantly higher than that of the control group, while damage decreased following addition of ferrostatin-1. Scale bar, 1 μm. Data are presented as mean ± SEM (n = 3). **P < 0.01.
Figure 8
Figure 8
Gd-IgA1 leads to ferroptosis in HMCs by inhibiting PPARα and FABP1 expression. (A-E) Levels of PPARα and FABP1 were significantly decreased in HMCs stimulated by Gd-IgA1 (1 mg/mL, 24 h), and the expression of PPARα and FABP1 increased significantly after intervention with the ferroptosis-specific inhibitor, Fer-1. (F-G) After stimulation with Gd-IgA1 and then interference with siPPAR and siFABP1, HMC viability was significantly decreased and ROS significantly increased, while ferrostatin-1 treatment increased cell viability and reduced ROS levels. (H, I) After transfection of HMCs with PPARα lentivirus for 48 h, and stimulation with Gd-IgA1 for 24 h, PPARα and FABP1 mRNA levels were significantly decreased. (J-L) PPARα and FABP1 protein levels were significantly decreased in HMCs transfected with PPARα lentivirus after Gd-IgA1 stimulation. (M, N) TEM results showing the relatively intact mitochondrial structure and reduced level of mitochondrial damage in HMCs after PPARα overexpression. (O-Q) Levels of ROS, GSH, and MDA oxide generation were determined to assess the occurrence of ferroptosis. After PPARα lentivirus overexpression in HMCs, ROS and MDA levels decreased and GSH levels increased. These results suggest that Gd-IgA1 leads to ferroptosis in HMCs by inhibiting PPARα and FABP1 expression. Scale bar, 1 μm. Data are presented as mean ± SEM (n = 3). **P < 0.01.
Figure 9
Figure 9
PPARα mediates FABP1 expression, regulating GPX4 and ACSL4, and influencing ferroptosis occurrence in HMCs. Immunofluorescence colocalization analysis of HMCs after intervention with siPPARα, showing that PPARα and FABP1 protein (A, B) and mRNA (C) levels were significantly decreased. These results indicate that downregulation PPARα mediated reduction of FABP1 levels. (D-H) mRNA and protein expression levels of the key ferroptosis molecule, GPX4, were decreased, and those of ACSL4 increased after treatment with siPPARα and siFABP1. After transfection of HMCs with PPARα lentivirus for 48 h, and stimulation with Gd-IgA1 for 24 h, GPX4 mRNA level decreased (I) and ACSL4 mRNA level was significantly increased (J). (K-M) GPX4 and ACSL4 protein levels were decreased and increased, respectively, in the PPARα-OE+Gd-IgA1 group. (N, O) Immunofluorescence colocalization analysis showing that FABP1 and GPX4 expression levels were increased after lentivirus transfection. GPX4 is a marker protein of ferroptosis inhibition, while ACSL4 promotes ferroptosis. These results indicate that PPARα and FABP1 regulate GPX4 and ACSL4, affecting ferroptosis occurrence in HMCs. Scale bar, 50 μm. Data are presented as mean ± SEM (n = 3). *P < 0.05, **P < 0.01.
Figure 10
Figure 10
Schematic diagram showing regulation of ferroptosis by the PPARα signaling pathway in HMCs. Gd-IgA1 stimulates HMCs, leading to downregulated expression of PPARα, which in turn leads to decreased FABP1 expression. Levels of GPX4 and GSH, which participate in ferroptosis inhibition, decrease. ACSL4 promotion of ferroptosis and ROS levels increase, contributing to lipid peroxidation. Ultimately, ferroptosis of HMCs occurs, leading to IgAN.

Similar articles

Cited by

References

    1. Rodrigues JC, Haas M, Reich HN. IgA Nephropathy. Clin J Am Soc Nephrol. 2017;12:677–86. - PMC - PubMed
    1. Chen A, Yang SS, Lin TJ. et al. IgA nephropathy: clearance kinetics of IgA-containing immune complexes. Seminars in immunopathology. 2018;40:539–43. - PubMed
    1. Manno C, Strippoli GF, D'Altri C. et al. A novel simpler histological classification for renal survival in IgA nephropathy: a retrospective study. American journal of kidney diseases: the official journal of the National Kidney Foundation. 2007;49:763–75. - PubMed
    1. Coppo R. IgA Nephropathy: A European Perspective in the Corticosteroid Treatment. Kidney diseases (Basel, Switzerland) 2018;4:58–64. - PMC - PubMed
    1. Roberts IS. Pathology of IgA nephropathy. Nat Rev Nephrol. 2014;10:445–54. - PubMed

Publication types