

Associations between neck circumference and markers of dysglycemia, non-alcoholic fatty liver disease, and dysmetabolism independent of Body Mass Index in an Emirati population
- PMID: 36147574
- PMCID: PMC9485482
- DOI: 10.3389/fendo.2022.929724
Associations between neck circumference and markers of dysglycemia, non-alcoholic fatty liver disease, and dysmetabolism independent of Body Mass Index in an Emirati population
Abstract
Aim: Neck circumference (NC) is quick and easy to measure and may be a useful surrogate marker for body composition. We investigated NC as a potential marker of dysglycemia, MetS, and NAFLD.
Methods: 674 individuals were recruited at the Imperial College London Diabetes Centre in a study of sleep apnea prevalence. Of these, 547 (Age 46 ± 11.4 years, Body Mass Index (BMI) 31 ± 6 kg/m2, 279 (51%) female, 113 normal glucose tolerance (NGT), 108 Prediabetes, 326 Type 2 diabetes (T2DM)) met all inclusion criteria for analysis. NC was measured at the thyroid cartilage, and collar size was recorded. Analysis was performed using univariate and multivariate linear regression.
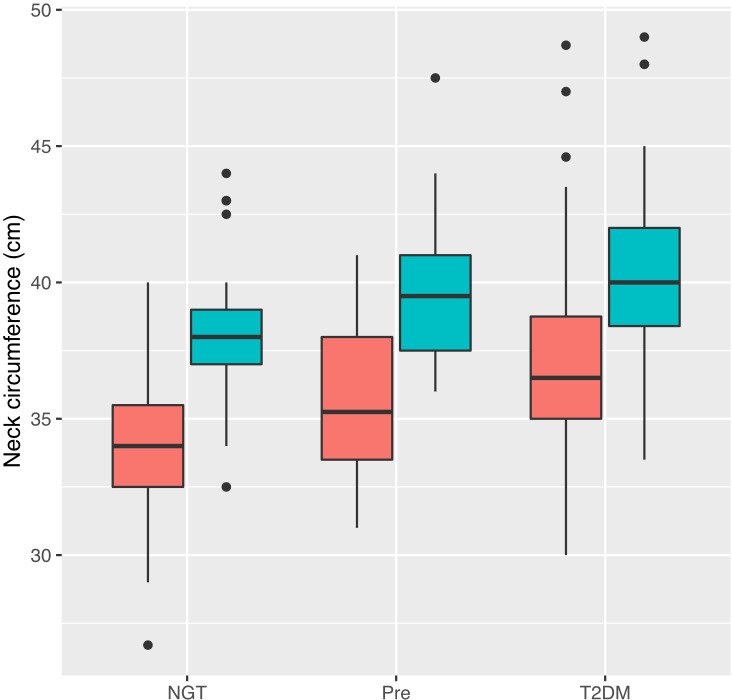
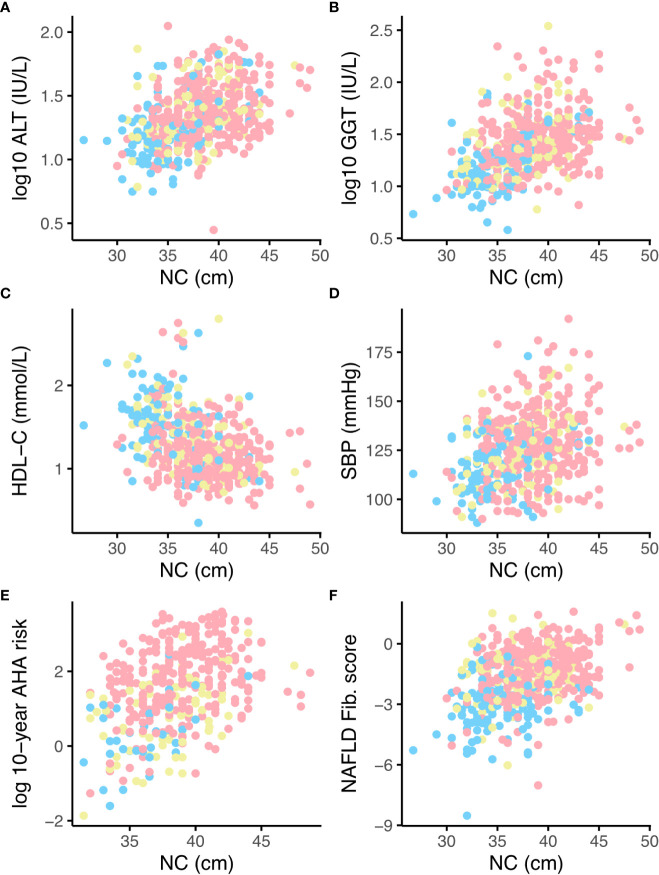
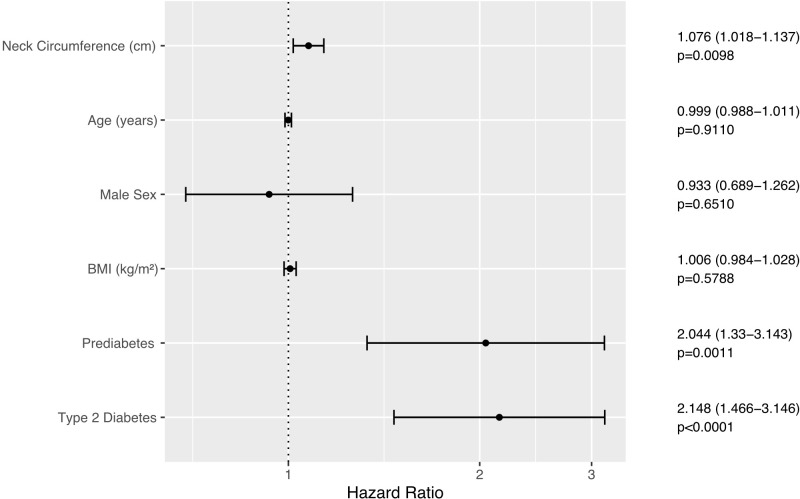
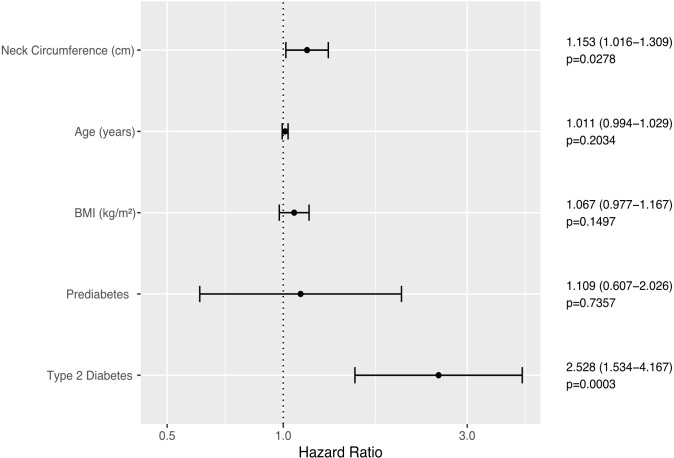
Results: Adjusted for BMI, sex, and age, NC was 0.65 ± 0.3 cm greater in prediabetes (p = 0.0331), and 1.07 ± 0.28 cm greater in T2DM, compared with NGT (p = 0.0002). Adjusting for BMI, sex, and glycemic status, 1-cm increase in NC was associated with a 1.04 ± 1.01 U/L (p <0.0001) increase in ALT and, additionally, correcting for statin use, a 0.03 ± 0.01 mmol/L reduction in HDL (p <0.0001) and a 0.1 ± 0.02 increase in TC : HDL. A 1 cm increase in NC was associated with a 1.15 ± 1.02% (p <0.0001) increase in 10-year AHA cardiovascular risk in individuals over 40 years old and a 0.16 ± 0.02 (p <0.0001) increase in NAFLD fibrosis score. The neck circumference was associated with the hazard of new onset of deranged ALT adjusted for age, sex, glycemic status, and BMI (hazard ratio 1.076 (95% CI 1.015-1.14, p = 0.0131) and with the incidence of Fatty Liver Index associated with high probability of NAFLD (hazard ratio 1.153 (95% CI 1.019-1.304), p = 0.0239).
Conclusion: NC is associated with dysglycemia, components of the MetS, and factors predictive of NAFLD, but does not appear to independently predict subsequent progression to high risk of liver fibrosis in this predominantly diabetic population.
Keywords: MetS; NAFLD; dysglycemia; neck circumference; obesity.
Copyright © 2022 Fojas, Buckley and Lessan.
Conflict of interest statement
The authors declare that the research was conducted in the absence of any commercial or financial relationships that could be construed as a potential conflict of interest.
Figures
Similar articles
-
Prevalence of prediabetes and diabetes in children and adolescents with biopsy-proven non-alcoholic fatty liver disease.J Hepatol. 2019 Oct;71(4):802-810. doi: 10.1016/j.jhep.2019.06.023. Epub 2019 Jul 4. J Hepatol. 2019. PMID: 31279904
-
Fatty liver index predicts incident risk of prediabetes, type 2 diabetes and non-alcoholic fatty liver disease (NAFLD).Ann Med. 2021 Dec;53(1):1256-1264. doi: 10.1080/07853890.2021.1956685. Ann Med. 2021. PMID: 34309471 Free PMC article.
-
Sex-specific differences in prevalence of nonalcoholic fatty liver disease in subjects with prediabetes and type 2 diabetes.Diabetes Res Clin Pract. 2022 Aug;190:110027. doi: 10.1016/j.diabres.2022.110027. Epub 2022 Jul 30. Diabetes Res Clin Pract. 2022. PMID: 35917992
-
Non-Alcoholic Fatty Liver Disease Treatment in Patients with Type 2 Diabetes Mellitus; New Kids on the Block.Curr Vasc Pharmacol. 2020;18(2):172-181. doi: 10.2174/1570161117666190405164313. Curr Vasc Pharmacol. 2020. PMID: 30961499 Review.
-
The global epidemiology of NAFLD and NASH in patients with type 2 diabetes: A systematic review and meta-analysis.J Hepatol. 2019 Oct;71(4):793-801. doi: 10.1016/j.jhep.2019.06.021. Epub 2019 Jul 4. J Hepatol. 2019. PMID: 31279902
Cited by
-
Anthropometric and metabolic parameters associated with visceral fat in non-obese type 2 diabetes individuals.Diabetol Metab Syndr. 2025 Jan 22;17(1):28. doi: 10.1186/s13098-025-01583-1. Diabetol Metab Syndr. 2025. PMID: 39844248 Free PMC article.
-
The discriminatory ability of wrist and neck circumference in predicting insulin resistance in overweight and obese children.J Diabetes Metab Disord. 2025 Mar 22;24(1):89. doi: 10.1007/s40200-025-01603-x. eCollection 2025 Jun. J Diabetes Metab Disord. 2025. PMID: 40129686
-
Neck circumference as a predictor of all-cause mortality in middle-aged and older adults in rural Ecuador.Int Health. 2024 Nov 4;16(6):664-669. doi: 10.1093/inthealth/ihad119. Int Health. 2024. PMID: 38233094 Free PMC article.
-
Fatty liver index (FLI): more than a marker of hepatic steatosis.J Physiol Biochem. 2024 Feb;80(1):11-26. doi: 10.1007/s13105-023-00991-z. Epub 2023 Oct 25. J Physiol Biochem. 2024. PMID: 37875710 Review.
References
MeSH terms
Substances
LinkOut - more resources
Full Text Sources
Medical
Miscellaneous