

Computational solutions for spatial transcriptomics
- PMID: 36147664
- PMCID: PMC9464853
- DOI: 10.1016/j.csbj.2022.08.043
Computational solutions for spatial transcriptomics
Abstract
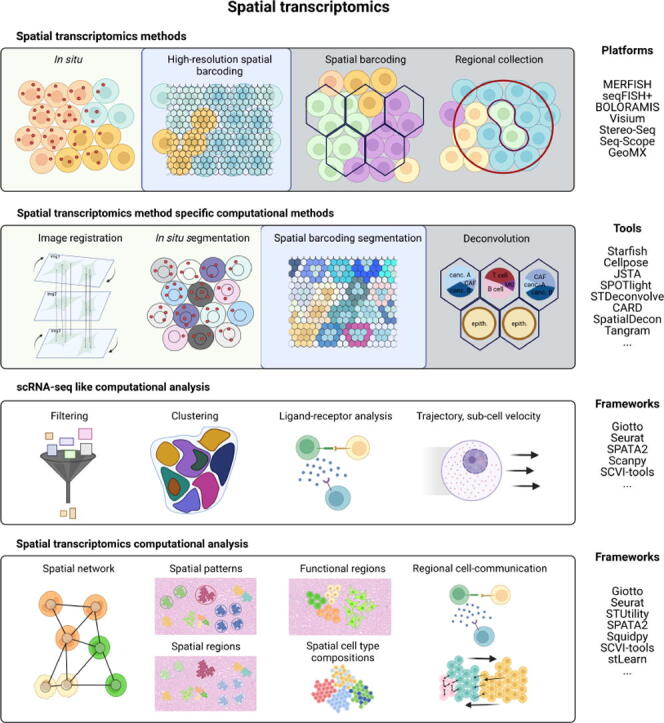
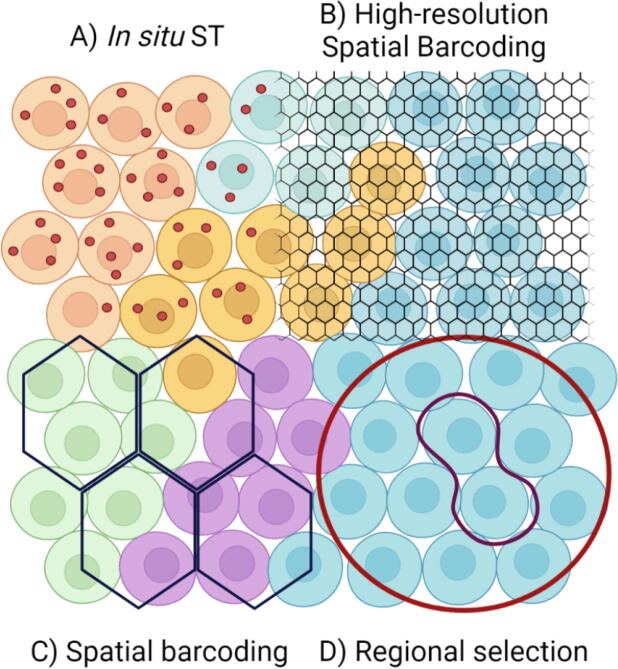
Transcriptome level expression data connected to the spatial organization of the cells and molecules would allow a comprehensive understanding of how gene expression is connected to the structure and function in the biological systems. The spatial transcriptomics platforms may soon provide such information. However, the current platforms still lack spatial resolution, capture only a fraction of the transcriptome heterogeneity, or lack the throughput for large scale studies. The strengths and weaknesses in current ST platforms and computational solutions need to be taken into account when planning spatial transcriptomics studies. The basis of the computational ST analysis is the solutions developed for single-cell RNA-sequencing data, with advancements taking into account the spatial connectedness of the transcriptomes. The scRNA-seq tools are modified for spatial transcriptomics or new solutions like deep learning-based joint analysis of expression, spatial, and image data are developed to extract biological information in the spatially resolved transcriptomes. The computational ST analysis can reveal remarkable biological insights into spatial patterns of gene expression, cell signaling, and cell type variations in connection with cell type-specific signaling and organization in complex tissues. This review covers the topics that help choosing the platform and computational solutions for spatial transcriptomics research. We focus on the currently available ST methods and platforms and their strengths and limitations. Of the computational solutions, we provide an overview of the analysis steps and tools used in the ST data analysis. The compatibility with the data types and the tools provided by the current ST analysis frameworks are summarized.
Keywords: AOI, area of illumination; BICCN, Brain Initiative Cell Census Network; BOLORAMIS, barcoded oligonucleotides ligated on RNA amplified for multiplexed and parallel in situ analyses; Baysor, Bayesian Segmentation of Spatial Transcriptomics Data; BinSpect, Binary Spatial Extraction; CCC, cell–cell communication; CCI, cell–cell interactions; CNV, copy-number variation; Computational biology; DSP, digital spatial profiling; DbiT-Seq, Deterministic Barcoding in Tissue for spatial omics sequencing; FA, factor analysis; FFPE, formalin-fixed, paraffin-embedded; FISH, fluorescence in situ hybridization; FISSEQ, fluorescence in situ sequencing of RNA; FOV, Field of view; GRNs, gene regulation networks; GSEA, gene set enrichment analysis; GSVA, gene set variation analysis; HDST, high definition spatial transcriptomics; HMRF, hidden Markov random field; ICG, interaction changed genes; ISH, in situ hybridization; ISS, in situ sequencing; JSTA, Joint cell segmentation and cell type annotation; KNN, k-nearest neighbor; LCM, Laser Capture Microdissection; LCM-seq, laser capture microdissection coupled with RNA sequencing; LOH, loss of heterozygosity analysis; MC, Molecular Cartography; MERFISH, multiplexed error-robust FISH; NMF (NNMF), Non-negative matrix factorization; PCA, Principal Component Analysis; PIXEL-seq, Polony (or DNA cluster)-indexed library-sequencing; PL-lig, padlock ligation; QC, quality control; RNAseq, RNA sequencing; ROI, region of interest; SCENIC, Single-Cell rEgulatory Network Inference and Clustering; SME, Spatial Morphological gene Expression normalization; SPATA, SPAtial Transcriptomic Analysis; ST Pipeline, Spatial Transcriptomics Pipeline; ST, Spatial transcriptomics; STARmap, spatially-resolved transcript amplicon readout mapping; Single-cell analysis; Spatial data analysis frameworks; Spatial deconvolution; Spatial transcriptomics; TIVA, Transcriptome in Vivo Analysis; TMA, tissue microarray; TME, tumor micro environment; UMAP, Uniform Manifold Approximation and Projection for Dimension Reduction; UMI, unique molecular identifier; ZipSeq, zipcoded sequencing.; scRNA-seq, single-cell RNA sequencing; scvi-tools, single-cell variational inference tools; seqFISH, sequential fluorescence in situ hybridization; sequ-smFISH, sequential single-molecule fluorescent in situ hybridization; smFISH, single molecule FISH; t-SNE, t-distributed stochastic neighbor embedding.
© 2022 The Authors.
Conflict of interest statement
The authors declare that they have no known competing financial interests or personal relationships that could have appeared to influence the work reported in this paper.
Figures


Similar articles
-
Probing infectious disease by single-cell RNA sequencing: Progresses and perspectives.Comput Struct Biotechnol J. 2020;18:2962-2971. doi: 10.1016/j.csbj.2020.10.016. Epub 2020 Oct 21. Comput Struct Biotechnol J. 2020. PMID: 33106757 Free PMC article. Review.
-
Reference-based cell type matching of in situ image-based spatial transcriptomics data on primary visual cortex of mouse brain.Sci Rep. 2023 Jun 13;13(1):9567. doi: 10.1038/s41598-023-36638-8. Sci Rep. 2023. PMID: 37311768 Free PMC article.
-
K-nearest-neighbors induced topological PCA for single cell RNA-sequence data analysis.Comput Biol Med. 2024 Jun;175:108497. doi: 10.1016/j.compbiomed.2024.108497. Epub 2024 Apr 24. Comput Biol Med. 2024. PMID: 38678944 Free PMC article.
-
Concordance of MERFISH spatial transcriptomics with bulk and single-cell RNA sequencing.Life Sci Alliance. 2022 Dec 16;6(1):e202201701. doi: 10.26508/lsa.202201701. Print 2023 Jan. Life Sci Alliance. 2022. PMID: 36526371 Free PMC article.
-
Spatial analysis toolkits for RNA in situ sequencing.Wiley Interdiscip Rev RNA. 2024 Mar-Apr;15(2):e1842. doi: 10.1002/wrna.1842. Wiley Interdiscip Rev RNA. 2024. PMID: 38605484 Review.
Cited by
-
Rediscovering the human thymus through cutting-edge technologies.J Exp Med. 2024 Oct 7;221(10):e20230892. doi: 10.1084/jem.20230892. Epub 2024 Aug 21. J Exp Med. 2024. PMID: 39167072 Free PMC article. Review.
-
Ursa: A Comprehensive Multiomics Toolbox for High-Throughput Single-Cell Analysis.Mol Biol Evol. 2023 Dec 1;40(12):msad267. doi: 10.1093/molbev/msad267. Mol Biol Evol. 2023. PMID: 38091963 Free PMC article.
-
Application of spatial-omics to the classification of kidney biopsy samples in transplantation.Nat Rev Nephrol. 2024 Nov;20(11):755-766. doi: 10.1038/s41581-024-00861-x. Epub 2024 Jul 4. Nat Rev Nephrol. 2024. PMID: 38965417 Review.
-
CellRomeR: an R package for clustering cell migration phenotypes from microscopy data.Bioinform Adv. 2025 Apr 4;5(1):vbaf069. doi: 10.1093/bioadv/vbaf069. eCollection 2025. Bioinform Adv. 2025. PMID: 40330627 Free PMC article.
-
SpotSweeper: spatially aware quality control for spatial transcriptomics.Nat Methods. 2025 Jul;22(7):1520-1530. doi: 10.1038/s41592-025-02713-3. Epub 2025 Jun 6. Nat Methods. 2025. PMID: 40481362 Free PMC article.
References
Publication types
LinkOut - more resources
Full Text Sources
Miscellaneous