. 2022 Sep 6:14:945816.
doi: 10.3389/fnsyn.2022.945816. eCollection 2022.

Synaptic determinants of cholinergic interneurons hyperactivity during parkinsonism

Affiliations

Synaptic determinants of cholinergic interneurons hyperactivity during parkinsonism

Montserrat Padilla-Orozco et al. Front Synaptic Neurosci. .

Abstract

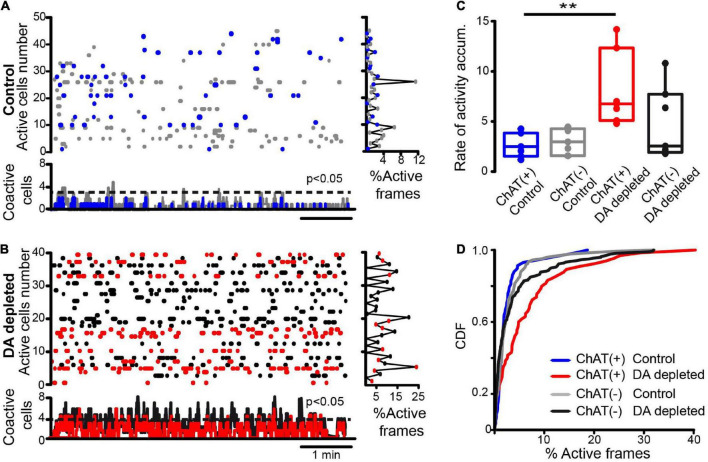
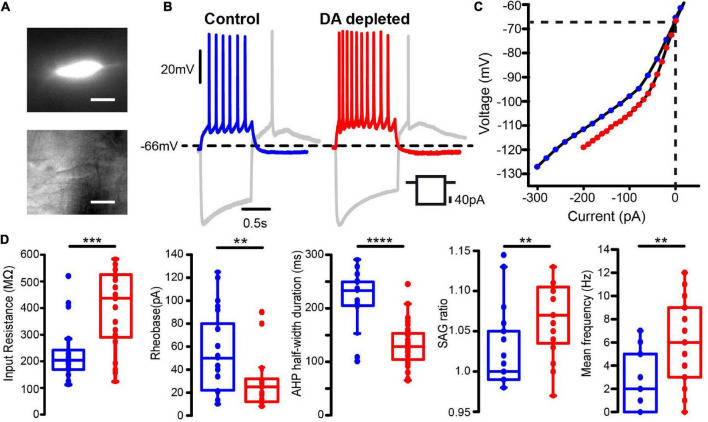
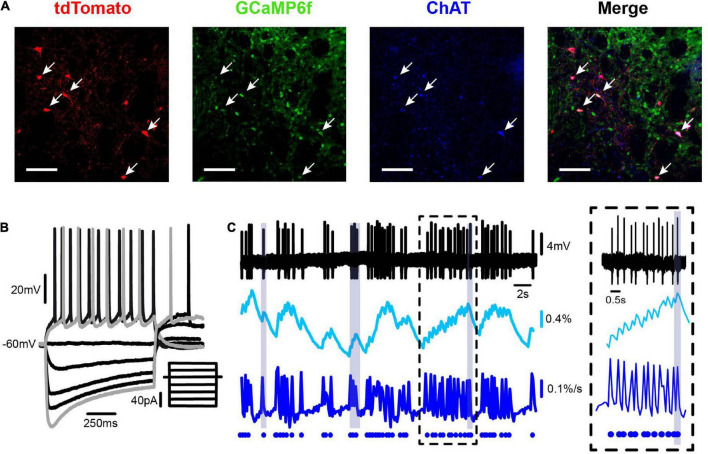
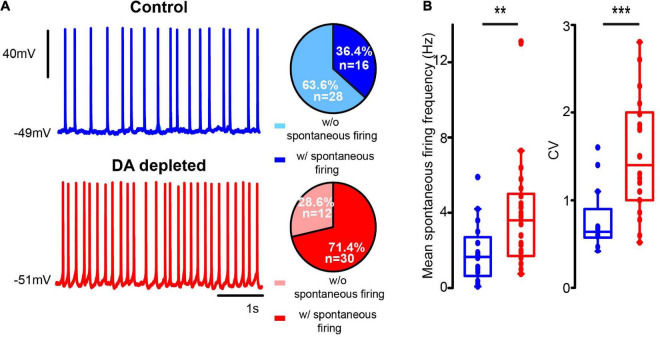
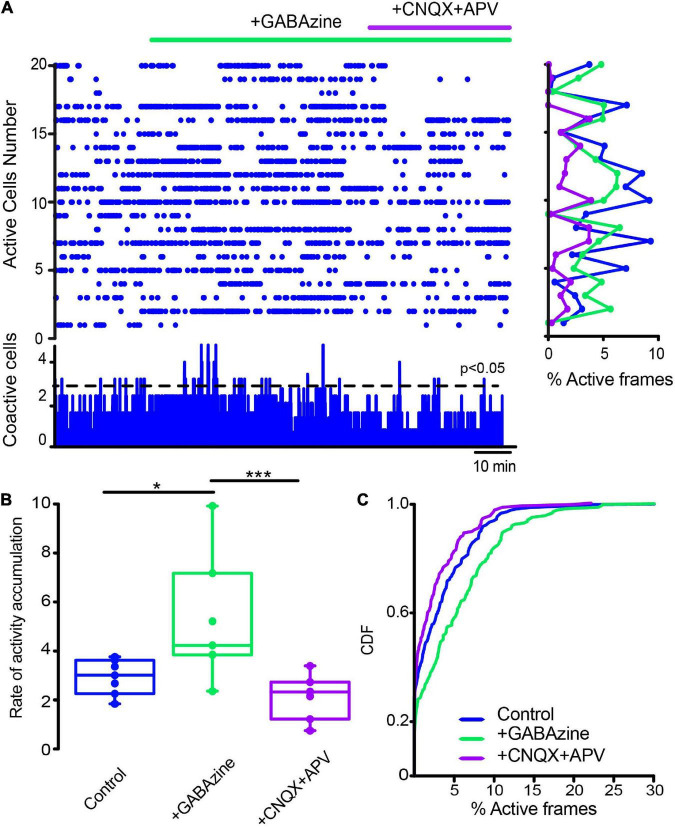
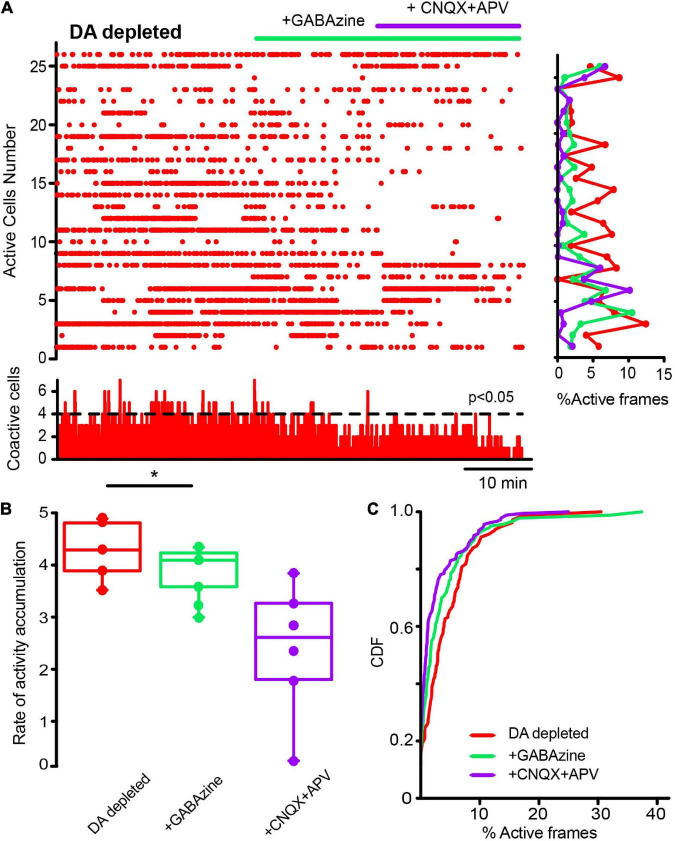
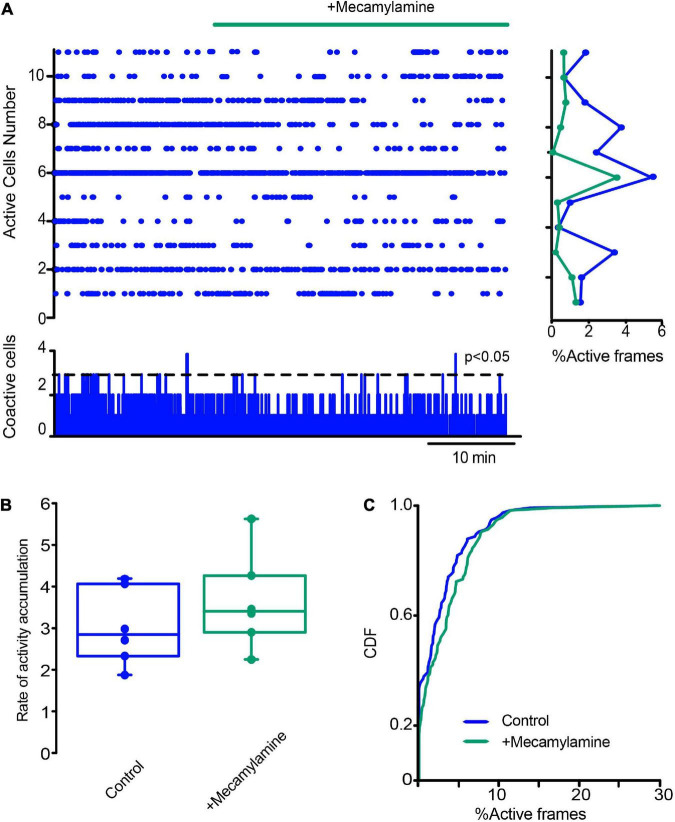
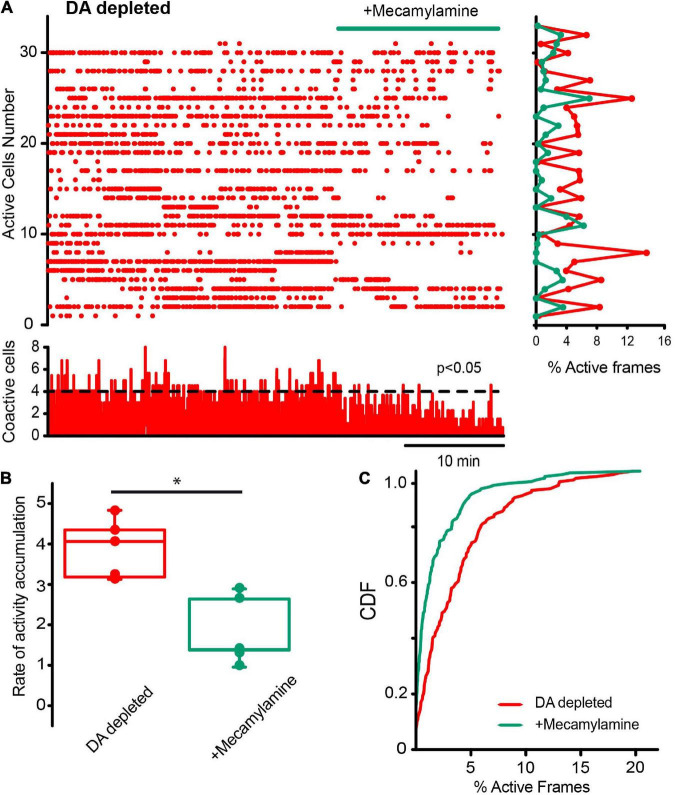
Parkinson's disease is a neurodegenerative ailment generated by the loss of dopamine in the basal ganglia, mainly in the striatum. The disease courses with increased striatal levels of acetylcholine, disrupting the balance among these modulatory transmitters. These modifications disturb the excitatory and inhibitory balance in the striatal circuitry, as reflected in the activity of projection striatal neurons. In addition, changes in the firing pattern of striatal tonically active interneurons during the disease, including cholinergic interneurons (CINs), are being searched. Dopamine-depleted striatal circuits exhibit pathological hyperactivity as compared to controls. One aim of this study was to show how striatal CINs contribute to this hyperactivity. A second aim was to show the contribution of extrinsic synaptic inputs to striatal CINs hyperactivity. Electrophysiological and calcium imaging recordings in Cre-mice allowed us to evaluate the activity of dozens of identified CINs with single-cell resolution in ex vivo brain slices. CINs show hyperactivity with bursts and silences in the dopamine-depleted striatum. We confirmed that the intrinsic differences between the activity of control and dopamine-depleted CINs are one source of their hyperactivity. We also show that a great part of this hyperactivity and firing pattern change is a product of extrinsic synaptic inputs, targeting CINs. Both glutamatergic and GABAergic inputs are essential to sustain hyperactivity. In addition, cholinergic transmission through nicotinic receptors also participates, suggesting that the joint activity of CINs drives the phenomenon; since striatal CINs express nicotinic receptors, not expressed in striatal projection neurons. Therefore, CINs hyperactivity is the result of changes in intrinsic properties and excitatory and inhibitory inputs, in addition to the modification of local circuitry due to cholinergic nicotinic transmission. We conclude that CINs are the main drivers of the pathological hyperactivity present in the striatum that is depleted of dopamine, and this is, in part, a result of extrinsic synaptic inputs. These results show that CINs may be a main therapeutic target to treat Parkinson's disease by intervening in their synaptic inputs.

Keywords: Parkinson’s disease; calcium imaging; cholinergic interneurons; electrophysiology; striatal microcircuit.


Conflict of interest statement

The authors declare that the research was conducted in the absence of any commercial or financial relationships that could be construed as a potential conflict of interest.

Figures

FIGURE 1
FIGURE 1
Spontaneous neuronal activity within striatal microcircuits in control and after dopamine depletion. (A) The raster plot shows the spontaneous activity of several neurons recorded simultaneously with calcium imaging in control conditions. Blue dots are identified CINs (tdTomato in ChAT-cre mice), and gray dots are presumably other neuron types. The right histogram shows activity per neuron (rows) and the histogram at the bottom shows coactivity (neurons that fire together in a column vector or movie frame). A dashed line indicates when a column vector is significant using Monte Carlo simulations (P < 0.05). In control, significant peaks of coactivity are scarce and rarely coincide with CINs peaks. (B) Similar raster plots showing the spontaneous activity of several neurons recorded simultaneously in DA-depleted striatum: notice increased activity as compared to the control. Red dots are identified CINs. The right histogram shows increased activity per row. Histogram of coactivity at bottom exhibits numerous significant peaks of coactivity along time, these are often accompanied with CINs activity. (C) Box plots show that the rate of activity accumulation of CINs over time increases after DA depletion (see Material and methods; Supplementary Figure 2; Kruskal-Wallis ANOVA with post hoc Dunn’s test: ChAT+ active neurons before (control) and after DA-depletion: **P = 0.0087). (D) Cumulative distribution functions (CDFs) of activity of ChAT+ and ChAT- neurons before and after DA depletion (control ChAT+ vs. control ChAT- neurons: P = 0.76; control ChAT+ vs. ChAT+ after DA depletion: P < 0.0001; control ChAT- vs. ChAT- after DA depletion: P = 0.042; ChAT+ vs. ChAT- after DA depletion: P < 0.0001 (n-control ChAT+ = 58 neurons; n-control ChAT- = 146 neurons; n-DA-depleted ChAT+ = 65 neurons, n-DA-depleted ChAT- = 222 neurons; from 7 different animals in both control and after DA depletion; Kolmogorov-Smirnov test).
FIGURE 2
FIGURE 2
Increased excitability of dopamine depleted identified cholinergic interneurons revealed by intracellular current injections. (A) Top: Photomicrograph of a ChAT-positive neuron expressing GCaMP6f. Bottom: The same neuron viewed with infra-red (IR) microscopy (Scale bar: 10 μm) (B) left: Whole-cell patch clamp recordings of a representative cholinergic interneuron (CIN) from the control striatum. Right: Recordings of a CIN from dopamine (DA) depleted striatum (6-OHDA model). Voltage responses evoked by hyperpolarizing and depolarizing current injections are compared. (C) Representative current-voltage (I-V plot) relationships of CINs in each condition. (D) Box-plots comparing neuronal input resistance, rheobase, sag ratio and mean firing frequency upon 1 s, 40 pA depolarizing current for samples in both conditions. The half-width duration was measured during spontaneous firing at similar frequencies: 3–4 Hz (Mann–Whitney U-test: **P < 0.01; ***P = 0.0008;****P < 0.0001).
FIGURE 3
FIGURE 3
Simultaneous electrophysiological and calcium imaging recording of a striatal cholinergic interneuron. (A) Panels show from left to right: a double-photon micrograph of neurons expressing tdTomato (red), the same field showing neurons expressing GCaMP6f (green; under the synapsin promoter), neurons immunoreactive to anti-ChAT antibodies (blue), and the merge of previous panels showing that ChAT neurons correspond to the ones with tdTomato. (B) Whole-cell current clamp recording of a representative striatal CIN showing voltage responses to 1 s depolarizing and hyperpolarizing current injections at the soma: firing, inward rectification (“sag”), and rebound (inset illustrates stimulus currents from –80 to 30 pA in 10 pA steps). (C) Simultaneous on-cell extracellular recording of a spontaneous firing CIN (top), its corresponding calcium transients (ΔF/F0; 2nd trace), and inferred electrical activity from calcium fluorescence [d(ΔF/F0)/dt: third trace]. Dots at the bottom trace represent the way the inferred electrical activity is illustrated in the raster plots as in Figure 1. A neuron with bursts and pauses is shown to compare real (top) with inferred activity (bottom). Inset: zoom of recording at a time within the dashed square.
FIGURE 4
FIGURE 4
DA-depleted cholinergic interneurons had increased spontaneous firing. (A) Top: a representative whole cell patch clamp electrophysiological recording of a CIN exhibiting spontaneous firing (zero current) in control conditions. Bottom: a CIN exhibiting spontaneous firing (zero current) from the DA-depleted sample. Pie plots on the right show percentages of neurons found with and without spontaneous firing at the time of recording (****P < 0.0001; df = 1; χ2). (B) Box-plots show samples of mean firing rate obtained from 1 s of spontaneous firing from electrophysiological recordings (**P = 0.0061; Mann–Whitney U) and coefficient of variation (***P = 0.001; Mann–Whitney U) during spontaneous firing. Control n = 16 neurons from 7 different animals; DA-depleted n = 30 neurons from 14 different animals.
FIGURE 5
FIGURE 5
The extremes of a continuous spectrum of action potentials (APs) waveforms within the striatal population of cholinergic interneurons. (A) CINs with a clear indentation during AP depolarization as revealed by dV/dt(V)-plots (arrows). (B) CINs with a smoother depolarization during their AP. Top (blue) traces correspond to APs in control conditions and middle (red) traces correspond to APs from DA-depleted neurons. APs were chosen during spontaneous firing at a similar frequency and membrane potential was measured at the threshold. The dV/dt(V)-plots are illustrated as means ± standard error of the mean (SEM). Bottom traces in (A,B) superimpose means from control and DA-depleted neurons (Control-indented n = 6; Control-smooth n = 10 cells from 7 different animals; DA depleted- indented = 5; DA depleted –smooth n = 25 cells from 14 different animals). Insets: pie plots show the percentage of indented plots during AP depolarization in paler color; more neurons with indentation during depolarization of APs are present in control conditions (P = 0.0001; df = 1; χ2). (C) Stacked APs averaged from different neurons from indented AP depolarization in control (blue) and during DA depletion (red). (D) Superimposition of averaged APs without indentation. (E) Shown differences are non-significant except for AHP amplitude in indented samples (*P = 0.03; Mann–Whitney U-test).
FIGURE 6
FIGURE 6
Striatal cholinergic interneurons increase their activity as shown by raster density and modify their firing pattern after DA depletion. (A) The raster plot showing the activity of several identified CINs in a brain slice in control conditions. A few significant coactivity peaks have 3 or fewer neurons. (B) The raster plot shows the activity of several identified CINs in DA-depleted conditions; augmented firing is clear during the simultaneous recording of CINs. Several significant coactivity peaks along time have 6 or more neurons (P = 0.05 after Monte Carlo simulations; see Pérez-Ortega et al., 2016). (C) The distribution of all inter-event intervals illustrates differences in raster plot density in both conditions (an event—a dot—denotes neural activity; an inter-event interval is silence between events). The distribution is skewed and has to be shown at different scales. The left histogram shows intervals of < 1 s showing that DA-depleted CINs activate more frequently. The middle histogram shows more prolonged events < 60 s. DA-depleted CINs have more events of this type since activity trains are followed or preceded by pauses. The right histogram shows that more prolonged intervals of < 120 s belong to CINs in control conditions. (D) Lumped and normalized as cumulative distribution functions (CDFs) of all inferred interspike intervals (IISIs), counting all intervals for each condition, show significant differences (P < 0.0001; control, n = 163 cells from n = 10 slices from 10 different animals; DA-depleted CINs, n = 285 cells from n = 13 slices from 12 different animals; Kolmogorov-Smirnov test). DA-depleted CINs appear to fire in trains with pauses exhibiting a higher density in the raster plots.
FIGURE 7
FIGURE 7
Influence of glutamatergic inputs on cholinergic interneurons’ spontaneous activity in control conditions without stimulation. (A) The raster plot shows the spontaneous activity of CINs in control conditions and after applying 10 μM CNQX and 50 μM APV. Thereafter 10 μM of GABAzine were administered. The histogram at the right shows activity per neuron (rows), histogram at the bottom shows activity per column (coactivity). (B) Box plots show samples of the rate of activity accumulation with non-significant changes (Wilcoxon’s T or Friedman tests). (C) Cumulative distribution functions (CDFs) of ChAT+ in control conditions and with the antagonists: CINs control vs. CINs + CNQX + APV: P = 0.087; + Gabazine: P = 0.24 (Kolmogorov-Smirnov test: n-CINS control = 116 cells, + CNQX + APV = 113; + Gabazine = 129 cells from n = 8 slices from 8 different animals).
FIGURE 8
FIGURE 8
Glutamatergic inputs to the striatal microcircuit are essential for the activity increase in cholinergic interneurons in dopamine-depleted tissue. (A) The raster plot represents the activity of identified CINs recorded simultaneously in DA-depleted tissue, before and after applying glutamatergic antagonists (10 μM CNQX and 50 μM APV) and the GABAergic antagonist (10 μM GABAzine). Both cell activities (right: rows) and significant coactivity peaks (bottom) are decreased. (B) Box plots show significant reductions in the rate of activity accumulation after the antagonists (*P = 0.03; Wilcoxon T-test: DA-depleted vs. DA depleted with glutamatergic antagonists). Subsequent application of GABAzine appears to further reduce the rate of activity accumulation, but this is non-significant. (C) Cumulative distribution functions (CDFs) of ChAT+ neurons: DA-depleted CINs vs. CINs plus CNQX + APV (P < 0.0001); with further addition of GABAzine (P < 0.0001; Kolmogorov-Smirnov test; n-DA-depleted CINs = 159 neurons; with CNQX + APV = 145 neurons; plus GABAzine = 143 neurons from n = 6 slices from 6 different animals).
FIGURE 9
FIGURE 9
Global actions of inhibitory GABAergic inputs during CINs spontaneous activity in control conditions. (A) Raster plot represents the simultaneous activity of CINs before and after applying 10 μM GABAzine: an increase in activity is reflected cell by cell (rows activity at right histogram) and is significant at the level of coactivity peaks (histogram at the bottom; *P = 0.039; Wilcoxon T). An addition of 10 μM CNQX + 50 μM APV appears to decrease this activity. (B) Box plots show the rate of activity accumulation. Blockade of glutamatergic transmission does inhibit activity after GABAzine (***P = 0.0002; Friedman ANOVA with post hoc Dunn’s test). (C) Cumulative distribution functions (CDFs) of activity of ChAT+ identified neurons in control conditions and during synaptic antagonists: control vs. + GABAzine: P = 0.0033; control vs. + GABAzine + CNQX + APV: P = 0.052; and Gabazine vs. + Gabazine + CNQX + APV: P < 0.0001. (n-control = 111 neurons; + Gabazine = 133 cells; + Gabazine + CNQX + APV = 116 cells from n = 7 slices from 7 different animals; Kolmogorov Smirnov test).
FIGURE 10
FIGURE 10
Inhibitory GABAergic inputs also contribute to cholinergic interneurons hyperactivity in dopamine-depleted tissue. (A) The raster plot represents the activity of identified CINs recorded simultaneously in a DA-depleted striatal slice. Applying 10 μM of GABAzine decreased hyperactivity contrary to control tissue (cf. Figure 9), where inhibition blockade increases neuronal activity as expected. In DA-depleted tissue, activity decreases cell by cell (rows in the histogram at right) and in significant peaks of coactivity (histogram at the bottom). An addition of 10 μM CNQX and 50 μM APV appears to further decrease this activity as excitation blockade is expected to do. (B) Box plots show that the rate of activity accumulation is significantly decreased by GABAzine (*P = 0.03; Wilcoxon T). (C) CDFs before and after addition of synaptic antagonists on CINs hyperactivity after DA depletion: DA-depleted CINs vs. CINs with addition of GABAzine: P = 0.0013; plus, addition of CNQX + APV: P < 0.0001; CINs + GABAzine vs. CINs with further addition of CNQX + APV: P = 0.0029 (n-DA depleted-CINs = 163 neurons; + GABAzine = 155 neurons; + CNQX + APV = 149 neurons from n = 6 slices from 6 different animals; Kolmogorov-Smirnov test).
FIGURE 11
FIGURE 11
Blockade of nicotinic receptors does not have an obvious influence on CINs activity in control conditions. (A) The raster plot shows the simultaneous activity of CINs before and after applying the nicotinic receptor antagonist mecamylamine (10 μM). (B) Box plots of the rate of activity accumulation. (C) Cumulative distribution function of activity of ChAT+ neurons with and without mecamylamine: P = 0.063 (Kolmogorov-Smirnov test: CINs control = 77 neurons; with mecamylamine = 97 cells; from n = 6 slices from 6 different animals).
FIGURE 12
FIGURE 12
Cholinergic synaptic transmission via nicotinic receptors is also important to maintain cholinergic interneurons hyperactivity in DA-depleted tissue. (A) Raster plot shows CINs hyperactivity in DA-depleted conditions. The addition of 10 μM of mecamylamine, a nicotinic receptor antagonist, appears to decrease this hyperactivity neuron by neuron (histogram at right) and in significant peaks of coactivity (histogram at the bottom). (B) Box plots show that the rate of activity accumulation along time is, in fact, decreased (n = 6; P = 0.05; Wilcoxon T-test). (C) CDFs show differences between activity of CINs during DA-depleted conditions before and after mecamylamine: P < 0.0001 (n-DA depleted CINs = 148 neurons; n-plus mecamylamine = 141 neurons, from n = 6 slices from 6 different animals: Kolmogorov-Smirnov test).

Similar articles

Cited by

References

    1. Abbondanza A., Ribeiro Bas I., Modrak M., Capek M., Minich J., Tyshkevich A., et al. (2022). Nicotinic acetylcholine receptors expressed by striatal interneurons inhibit striatal activity and control striatal-dependent behaviors. J. Neurosci. 42 2786–2803. 10.1523/jneurosci.1627-21.2022 - DOI - PMC - PubMed
    1. Abdi A., Mallet N., Mohamed F. Y., Sharott A., Dodson P. D., Nakamura K. C., et al. (2015). Prototypic and Arkypallidal neurons in the dopamine-intact external globus pallidus. J. Neurosci. 35 6667–6688. 10.1523/jneurosci.4662-14.2015 - DOI - PMC - PubMed
    1. Abudukeyoumu N., Hernandez-Flores T., Garcia-Munoz M., Arbuthnott G. W. (2018). Cholinergic modulation of striatal microcircuits. Eur. J. Neurosci. 49 604–622. 10.1111/ejn.13949 - DOI - PMC - PubMed
    1. Aceves-Buendia J., de, Tiroshi L., Chiu W. H., Goldberg J. A. (2017). Selective remodeling of glutamatergic transmission to striatal cholinergic interneurons after dopamine depletion. Eur. J. Neurosci. 49 824–833. 10.1111/ejn.13715 - DOI - PMC - PubMed
    1. Allers K. A., Bergstrom D. A., Ghazi L. J., Kreiss D. S., Walters J. R. (2005). MK801 and amantadine exert different effects on subthalamic neuronal activity in a rodent model of Parkinson’s disease. Exp. Neurol. 191 104–118. 10.1016/j.expneurol.2004.08.030 - DOI - PubMed