. 2022 Jul;2(7):601-615.
doi: 10.1038/s43587-022-00250-8. Epub 2022 Jul 15.

Characterization of cellular senescence in aging skeletal muscle

Affiliations

Characterization of cellular senescence in aging skeletal muscle

Xu Zhang et al. Nat Aging. 2022 Jul.

Abstract

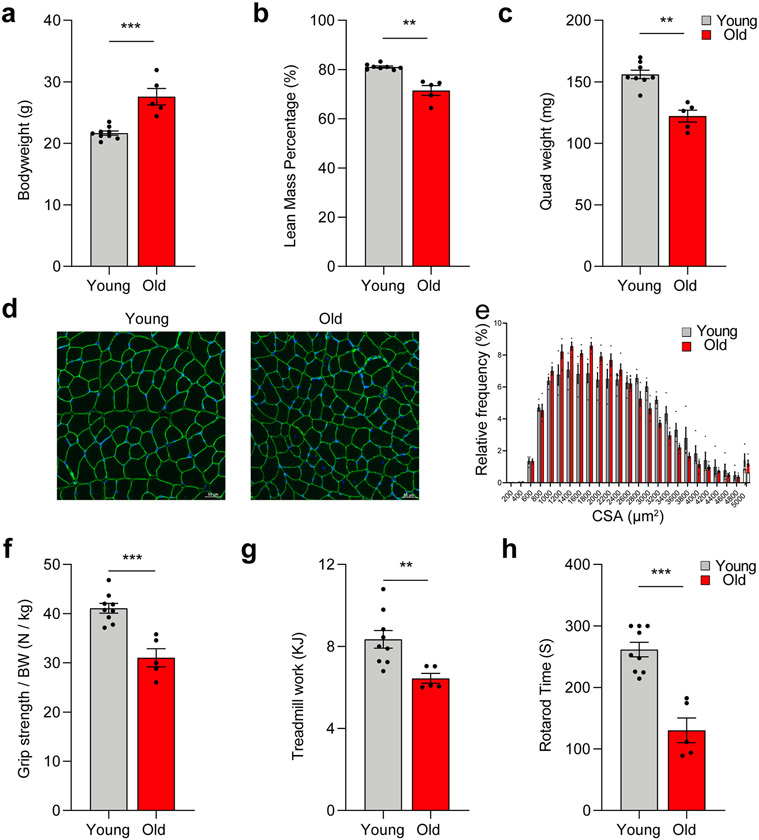
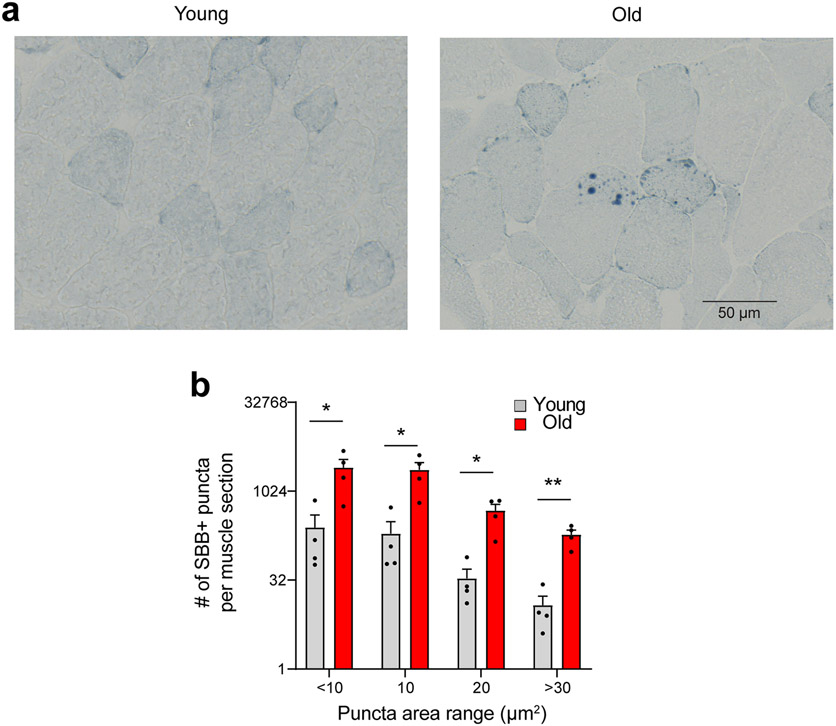
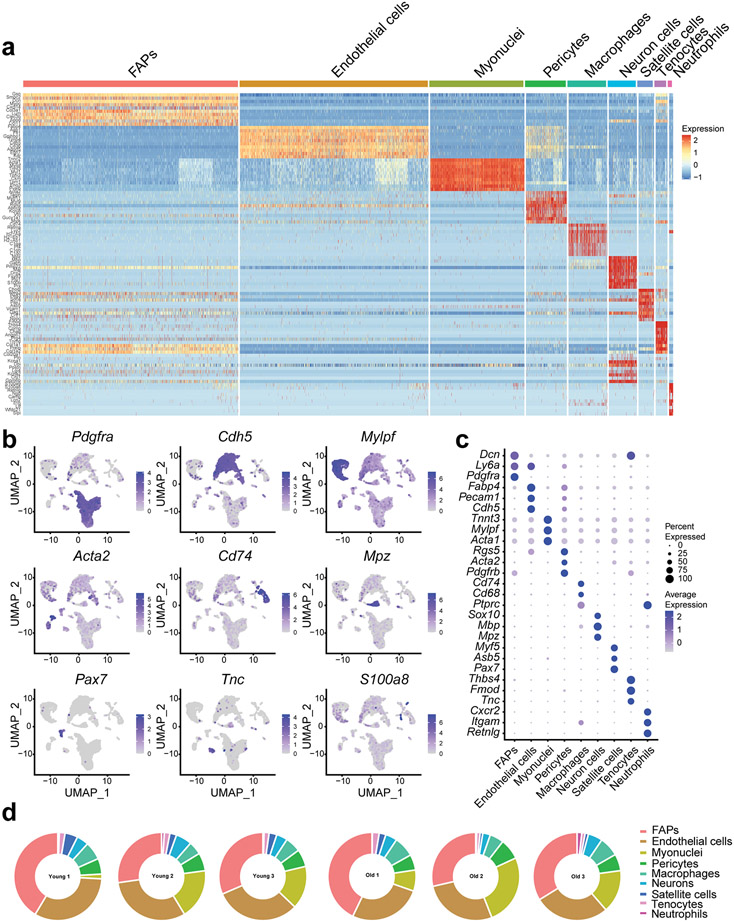
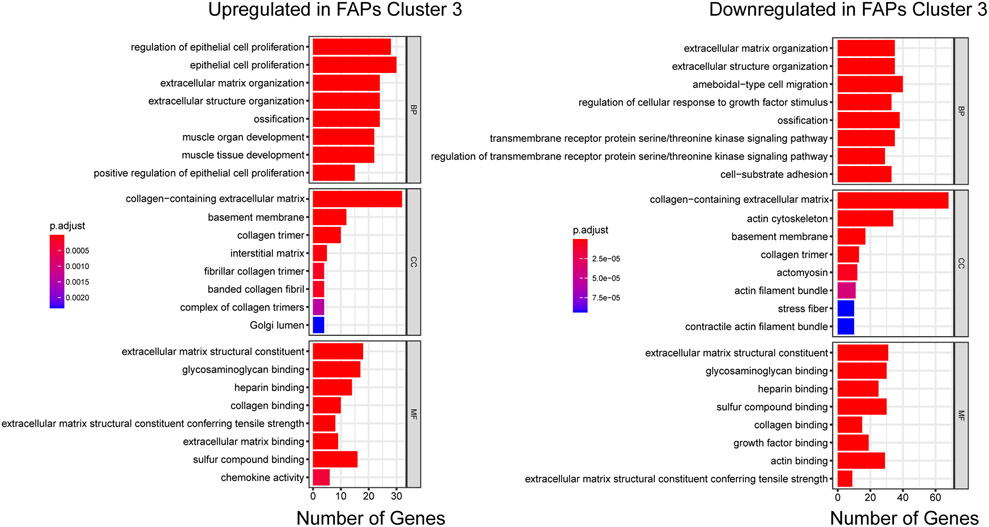
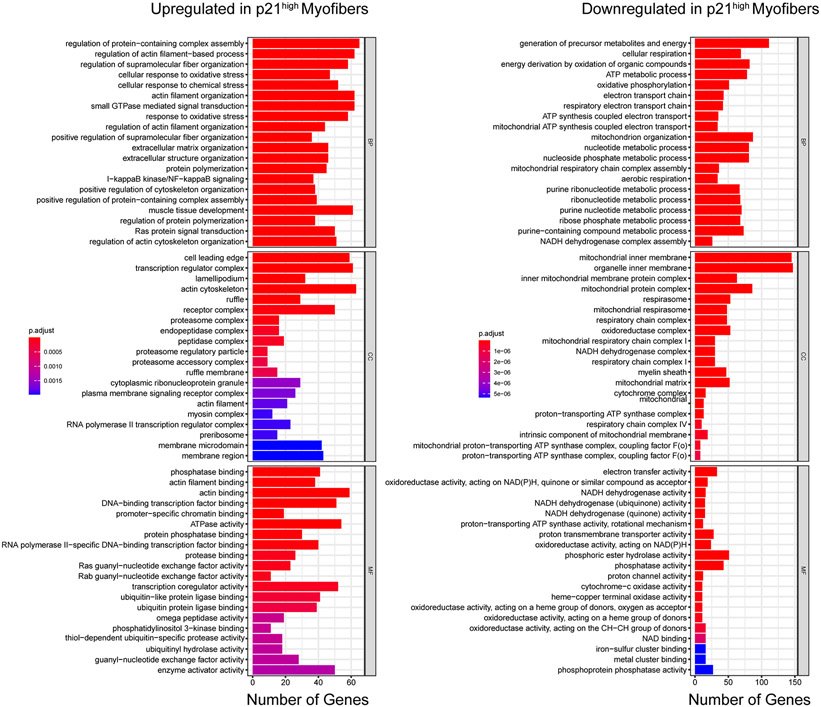
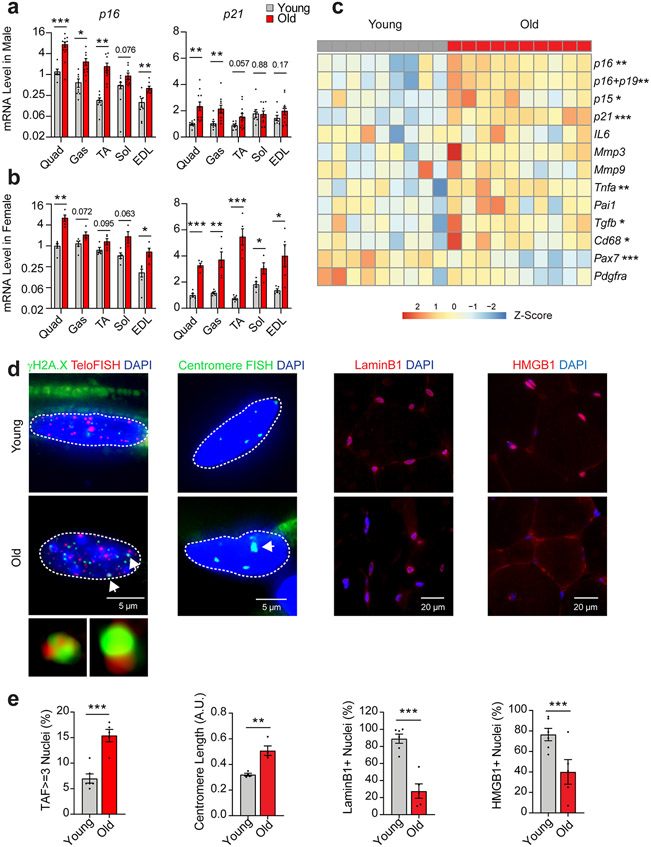
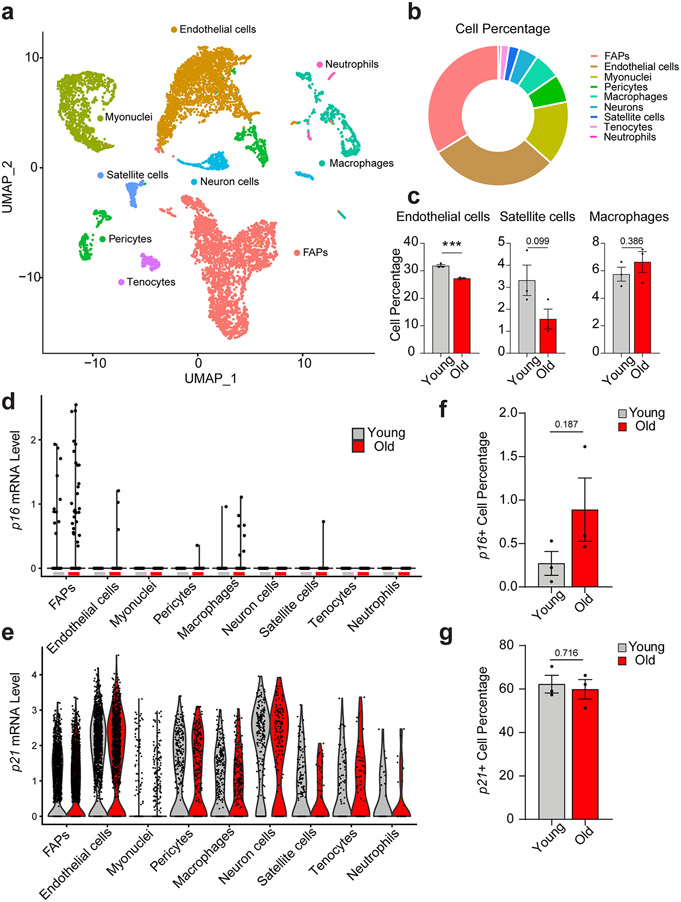
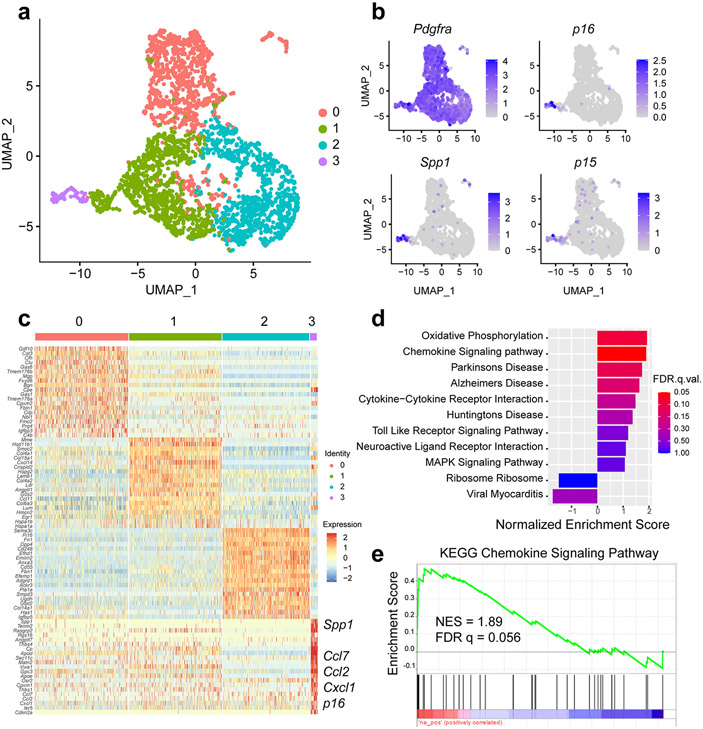
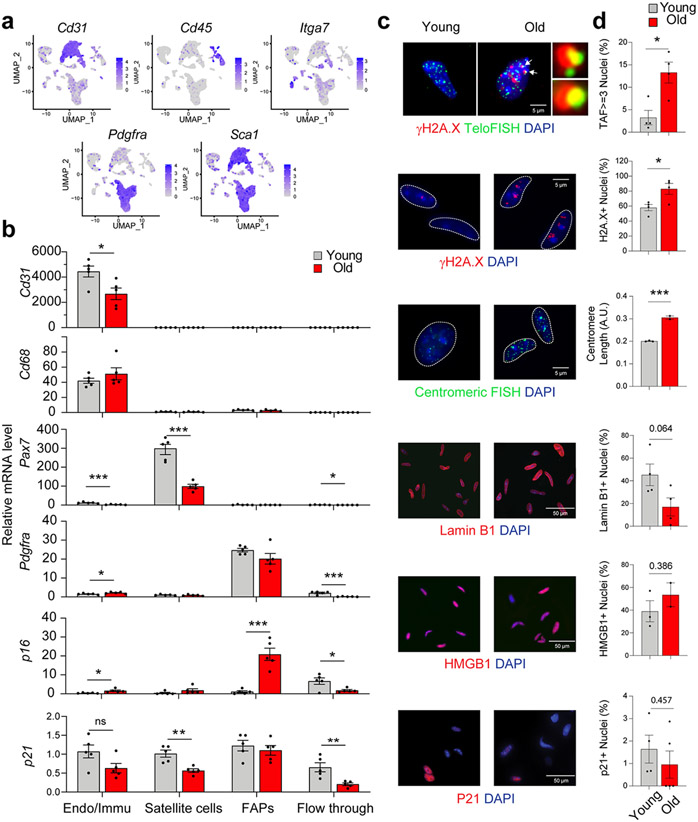
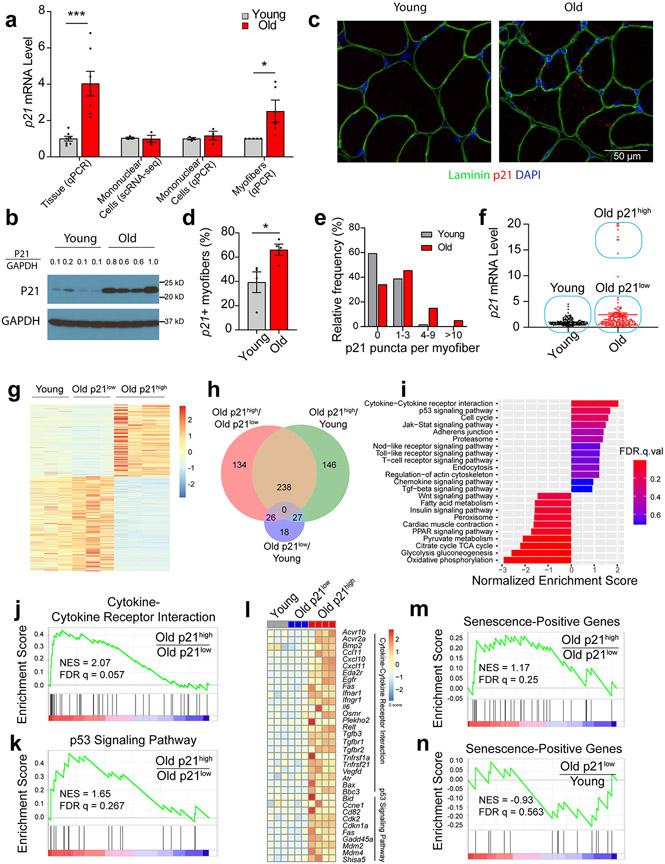
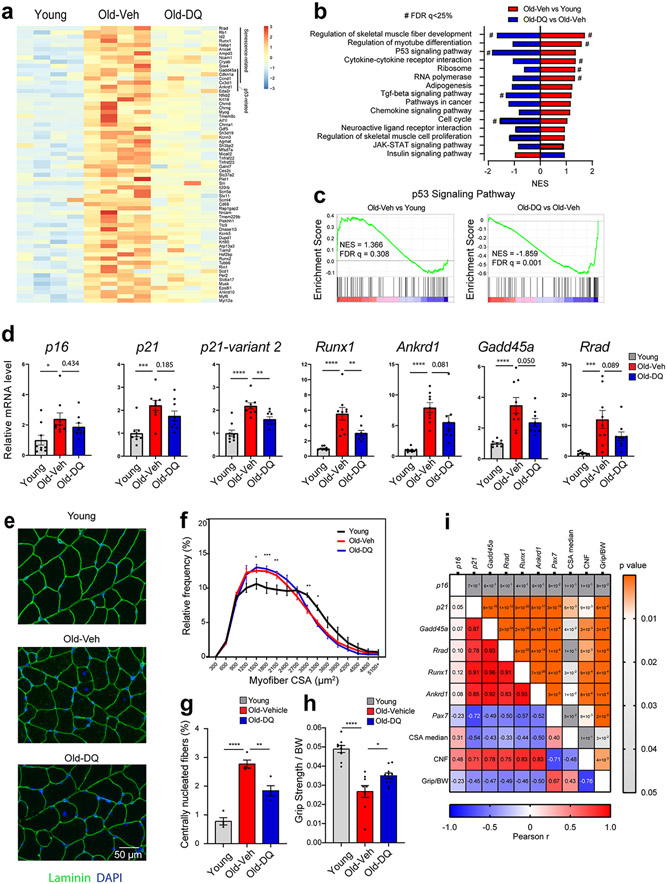
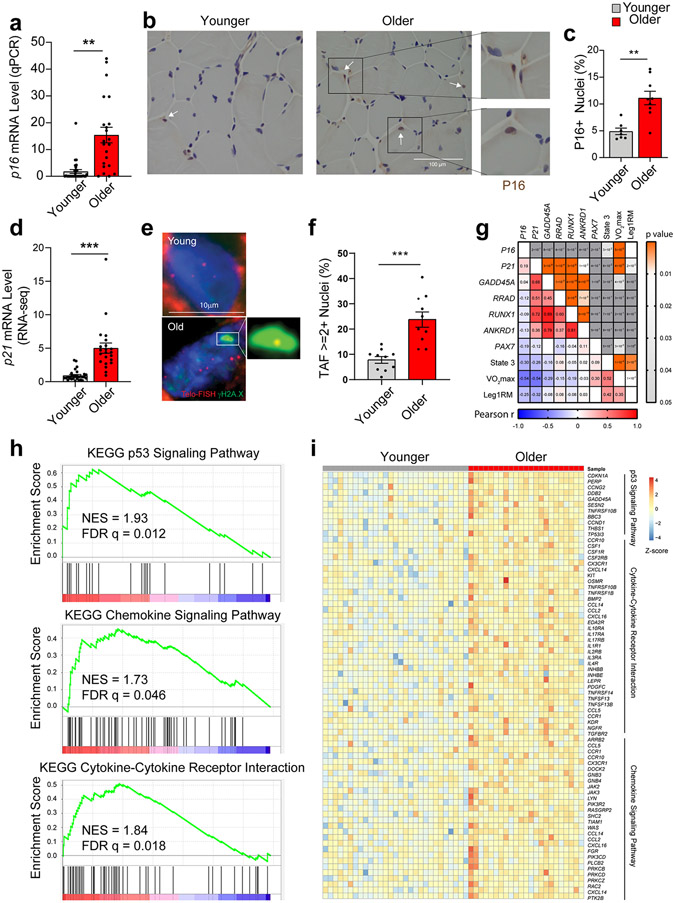
Senescence is a cell fate that contributes to multiple aging-related pathologies. Despite profound age-associated changes in skeletal muscle (SkM), whether its constituent cells are prone to senesce has not been methodically examined. Herein, using single cell and bulk RNA-sequencing and complementary imaging methods on SkM of young and old mice, we demonstrate that a subpopulation of old fibroadipogenic progenitors highly expresses p16 Ink4a together with multiple senescence-related genes and, concomitantly, exhibits DNA damage and chromatin reorganization. Through analysis of isolated myofibers, we also detail a senescence phenotype within a subset of old cells, governed instead by p2 Cip1 . Administration of a senotherapeutic intervention to old mice countered age-related molecular and morphological changes and improved SkM strength. Finally, we found that the senescence phenotype is conserved in SkM from older humans. Collectively, our data provide compelling evidence for cellular senescence as a hallmark and potentially tractable mediator of SkM aging.

Trial registration: ClinicalTrials.gov NCT01477164.


Figures

Extended Data Fig. 1.
The age-related loss of skeletal mass, strength, and function. Comparisons of (a) body weight, (b) lean mass (%), (c) and quadriceps (quad) muscle weight between young (n = 9) and old (n = 5) mice. (d) Representative images of quad muscle cross-sections stained for Laminin and (e) quantification of fiber size and distribution for young and old female mice (n = 4 per group). Comparison of (f) grip strength normalized to body weight, (g) treadmill exercise capacity, and (h) Rotarod endurance between young (n = 9) and old (n = 5) mice. Two-tailed unpaired t test was used; error bars represent the standard error of the mean. **, and *** denote p < 0.01 and 0.001 respectively.
Extended Data Fig. 2.
The age-related increase of lipofuscin in skeletal muscle (SkM). Representative images of Sudan Black B (SBB) staining (a) and quantification of the numbers of positive foci per quadriceps section (b) from young and old female mice (n = 4 per age group). Two-tailed unpaired t test was used; error bars represent the standard error of the mean. * and ** denote p < 0.05 and 0.01 respectively.
Extended Data Fig. 3.
Identification of skeletal muscle (SkM) cell populations by single cell RNA-sequencing. (a) Heatmap of the genes delineating 10 distinct cell populations in young and old female mice (n = 3 per group). (b) UMAP plot and (c) dot plot showing the main markers of each cell type. (d) Relative abundance of the distinct SkM cell populations in individual mice.
Extended Data Fig. 4.
Gene Ontology analysis of the upregulated and downregulated genes in high p16-expressing FAP cluster 3 compared to other FAPs. BP: biological process; MF: molecular function; CC: cellular component. Benjamini-Hochberg Procedure was used to calculate the FDR adjusted p value.
Extended Data Fig. 5.
Gene Ontology analysis of the upregulated and downregulated genes in old p21high myofibers compared to old p21low myofibers. BP: biological process; MF: molecular function; CC: cellular component. Benjamini-Hochberg Procedure was used to calculate the FDR adjusted p value.
Fig. 1.
Fig. 1.
Hallmarks of cellular senescence in skeletal muscle. p16 and p21 gene expression in quadriceps (quad), gastrocnemius (gas), tibialis anterior (TA), soleus (sol), and extensor digitorum longus (EDL) muscles of (a) young (6-mo, n = 8) and old male mice (24-mo, n = 11) and (b) young (n = 5) and old female mice (n = 5; Two-tailed unpaired t tests). (c) Heatmap of senescence-related gene expression in quad muscle from young and old mice (female, young n=9, old n=10; Two-tailed unpaired t tests). Staining (d) and quantification (e) of telomere-associated DNA damage foci (TAF), senescence-associated distension of satellites (SADS), Lamin B1, and high-mobility group box protein 1 (HMGB1) in quadriceps muscle cross-sections of young (n = 6) and old (n = 5) male mice (Two-tailed unpaired t tests). Error bars represent the standard error of the mean. *, **, and *** denote p < 0.05, 0.01, and 0.001 respectively.
Fig. 2.
Fig. 2.
Single cell RNA-sequencing of skeletal muscle (SkM) reveals age-associated changes in mononuclear cell composition and p16 expression. (a) UMAP plot of the mononuclear cell populations identified by scRNA-seq in mouse SkM (data summary comprised of n = 3 young and n = 3 old female mice). (b) Relative abundance of constituent SkM cell populations. (c) Differences in the percentage of endothelial cells, satellite cells, and macrophages between young (n = 3) and old (n = 3) mice (Two-tailed unpaired Mann-Whitney tests were used). (d) Distribution of the p16 signal across cell populations revealed FAPs as the predominant source. Each dot represents the level of gene expression in a single cell, with young (gray) and old (red) samples shown in different colors. (e) The expression of p21 is evident in most SkM mononuclear cells. Each dot represents the level of gene expression in a single cell, with young (gray) and old (red) samples shown in different colors. Comparison of the percentage of (f) p16-positive cells and (g) p21-positive cells by scRNA-seq between young (n = 3) and (n = 3) old mice (Two-tailed unpaired t tests). Error bars represent the standard error of the mean. *** denote p < 0.001.
Fig. 3.
Fig. 3.
A distinct cluster of high p16-expressing FAPs in old skeletal muscle exhibits a senescence phenotype. (a) A UMAP plot of FAPs from 3 young and 3 old female mice reveals four distinct clusters. (b) The FAPs marker gene Pdgfra is distributed across all clusters, but senescence-related genes p16, p15, and Spp1 are enriched in cluster 3. (c) Heatmap of scRNA-seq-derived marker genes for the four FAP subclusters, with several labels for several senescence-related genes enriched in cluster 3. (d) KEGG pathway enrichment analysis of cluster 3 specific genes using GSEA. Top enriched pathways were selected for plotting. (e) GSEA enrichment plot of the chemokine signaling pathway in FAPs cluster 3.
Fig. 4.
Fig. 4.
FAPs derived from old skeletal muscle (SkM) exhibit core properties of senescence. (a) UMAP plot of the markers used for MACS sorting. (b) Confirmation of effective endothelial/immune (Endo/Immu), satellite cell, and FAP separation by qPCR-based measures of cell type markers, and validation of FAPs as a major source of p16 signal in old SkM (n = 5 for both young and old samples, two-tailed unpaired t tests). Representative IF images (c) and quantification (d) of TAF, γH2A.X, SADS, Lamin B1-positive nuclei, HMGB1-positive nuclei, and P21 in FAPs isolated from young and old mice (2-5 male and female mice per group as detailed in Source Data, two-tailed unpaired t tests). Error bars represent the standard error of the mean. *, **, and *** denote p < 0.05, 0.01, and 0.001 respectively.
Fig. 5.
Fig. 5.
Skeletal muscles (SkM) of old mice have high p21-expressing myofibers with a senescence profile. (a) Comparison of p21 expression between young and old SkM tissue (n = 7 for both young and old samples) and isolated mononuclear cells (n = 7 for both young and old samples) by qPCR, mononuclear cells by scRNA-seq (n = 7 for both young and old samples), and isolated myofibers by qPCR (n = 5 for both young and old samples, two-tailed unpaired t tests). (b) Western blot of P21 and GAPDH in quadriceps muscle from young and old female mice (n = 4 per group). P21/GAPDH represents the ratio of the P21 signal intensity compared to GAPDH for each sample. (c) RNA-ISH staining of p21 and IF staining for Laminin in young and old quadriceps muscle cross-sections (n = 4 per group). (d) Quantification of the percentage of young and old myofibers staining positively for p21 puncta (two-tailed unpaired t test) and (e) the percentage of young and old myofibers with 0 to greater than 10 puncta. (f) Analysis of p21 expression by qPCR in 159 young and 159 old isolated, individual myofibers from female mice. (g) Differentially expressed genes (DEGs) between young, old p21low, and old p21high myofibers identified in the RNA-seq. (h) Venn diagram of DEGs between the three groups of myofibers. (i) Enriched pathways in old p21low compared to old p21high myofibers identified by GSEA, negative NES represent pathways enriched in old p21low myofibers. GSEA plot of (j) KEGG cytokine-cytokine receptor interactions and (k) the KEGG p53 signaling pathway based on DEGs between old p21high and old p21low myofibers. (l) Heatmap of the core DEGs in cytokine-cytokine receptor interactions and the p53 signaling pathway. GSEA plots of transcripts within the CellAge gene set that are positively correlated with senescence and are DEGs between (m) old p21high and old p21low myofibers, or (n) old p21low and young myofibers. Two-tailed unpaired t test was used; error bars represent the standard error of the mean. * and *** denote p < 0.05 and 0.001 respectively.
Fig 6.
Fig 6.
Senolytics improve the molecular phenotype and function of skeletal muscle (SkM) in female mice. (a) heatmap of the differentially expressed genes between young and old-vehicle mice which exhibited improvements in the old-DQ treated group. (b) GSEA enriched pathways between old-vehicle vs young groups (red) and between old-DQ vs old-vehicle groups (blue). X-axis shows the normalized enrichment score. Negative NES represent downregulation in the group. (c) GSEA plots of P53 signaling pathway between the two group comparisons. (d) qPCR confirmation of the RNAseq data in a larger cohort of mice (n = 9 per group; One way ANOVA test). (e) IF laminin staining on the SkM samples (Representative image of 4 mice per group). (f) CSA distribution in young, old-veh, and old-DQ samples. Asterisks denote the differences between young and old-veh groups (n = 4 per group, two way ANOVA). (g) Centrally nucleated fibers (CNF) in muscles from different groups (n = 4 per group). (h) Grip strength normalized to body weight of mice from different groups (n = 9-10 per group). (i) Pearson correlation analysis between gene expression and SkM morphological measures, and grip strength, with Pearson r value on the left and p value on the right. Error bars represent the standard error of the mean. *, **, and **** denote adjusted p value < 0.05, 0.01, and 0.0001 respectively. # denotes FDR q-value < 0.25 in GSEA analysis.
Fig. 7.
Fig. 7.
Aging and cellular senescence in human skeletal muscle (SkM). (a) Quantification of p16 expression by qPCR in SkM biopsy specimens from younger (n = 30) and older (n = 22) women and men (Two-tailed unpaired t test). (b) Representative images and (c) quantification of P16-positive nuclei by IHC staining (n = 5 per age group). (d) Comparison of p21 expression by qPCR between young (n = 29) and older (n = 22) SkM biopsies specimens. Representative images of TAF staining (e) and quantification of TAF-positive nuclei (f) (n=10 per age group, two-tailed unpaired t test). (g) Pearson correlation analysis between SkM gene expression and functional measurements including maximal oxygen consumption (VO2max, ml/kg/min), leg one-repetition maximum (AU) normalized to fat-free mass (kg) of the leg (Leg1RM), and maximal mitochondrial oxygen consumption (State 3) after the addition of saturating concentrations of adenosine diphosphate (pmol/s/mg tissue), with Pearson r value on the left bottom corner and p value on the right top corner. (h) GSEA plot of the p53 signaling pathway, the chemokine signaling pathway, and cytokine-cytokine receptor interactions that were significantly enriched based on DEGs by RNA-seq between younger and older human SkM. (i) Heatmap of expression of core genes in the enriched pathways. Two-tailed unpaired t test was used; error bars represent the standard error of the mean. ** and *** denote p < 0.01 and 0.001 respectively.

Comment in

  • Senescence diversity in muscle aging.
    Durik M, Keyes WM. Durik M, et al. Nat Aging. 2022 Jul;2(7):570-572. doi: 10.1038/s43587-022-00255-3. Nat Aging. 2022. PMID: 37117776 No abstract available.

Similar articles

Cited by

References

    1. Fielding RA et al. Sarcopenia: an undiagnosed condition in older adults. Current consensus definition: prevalence, etiology, and consequences. International working group on sarcopenia. J Am Med Dir Assoc 12, 249–256, doi: 10.1016/j.jamda.2011.01.003 (2011). - DOI - PMC - PubMed
    1. Campisi J & di Fagagna FD Cellular senescence: when bad things happen to good cells. Nat Rev Mol Cell Bio 8, 729–740, doi: 10.1038/nrm2233 (2007). - DOI - PubMed
    1. Coppe JP et al. Senescence-associated secretory phenotypes reveal cell-nonautonomous functions of oncogenic RAS and the p53 tumor suppressor. PLoS Biol 6, 2853–2868, doi: 10.1371/journal.pbio.0060301 (2008). - DOI - PMC - PubMed
    1. Acosta JC et al. A complex secretory program orchestrated by the inflammasome controls paracrine senescence. Nat Cell Biol 15, 978–U221, doi: 10.1038/ncb2784 (2013). - DOI - PMC - PubMed
    1. Khosla S, Farr JN, Tchkonia T & Kirkland JL The role of cellular senescence in ageing and endocrine disease. Nat Rev Endocrinol 16, 263–275, doi: 10.1038/s41574-020-0335-y (2020). - DOI - PMC - PubMed

Publication types

Substances

Associated data