. 2022 Sep 6:12:936952.
doi: 10.3389/fonc.2022.936952. eCollection 2022.

Comprehensive analysis of the prognostic value and immune infiltration of FGFR family members in gastric cancer

Affiliations

Comprehensive analysis of the prognostic value and immune infiltration of FGFR family members in gastric cancer

Chengcheng Yang et al. Front Oncol. .

Abstract

Background: Fibroblast growth factor receptors (FGFRs) modulate numerous cellular processes in tumor cells and tumor microenvironment. However, the effect of FGFRs on tumor prognosis and tumor-infiltrating lymphocytes in gastric cancer (GC) remains controversial.

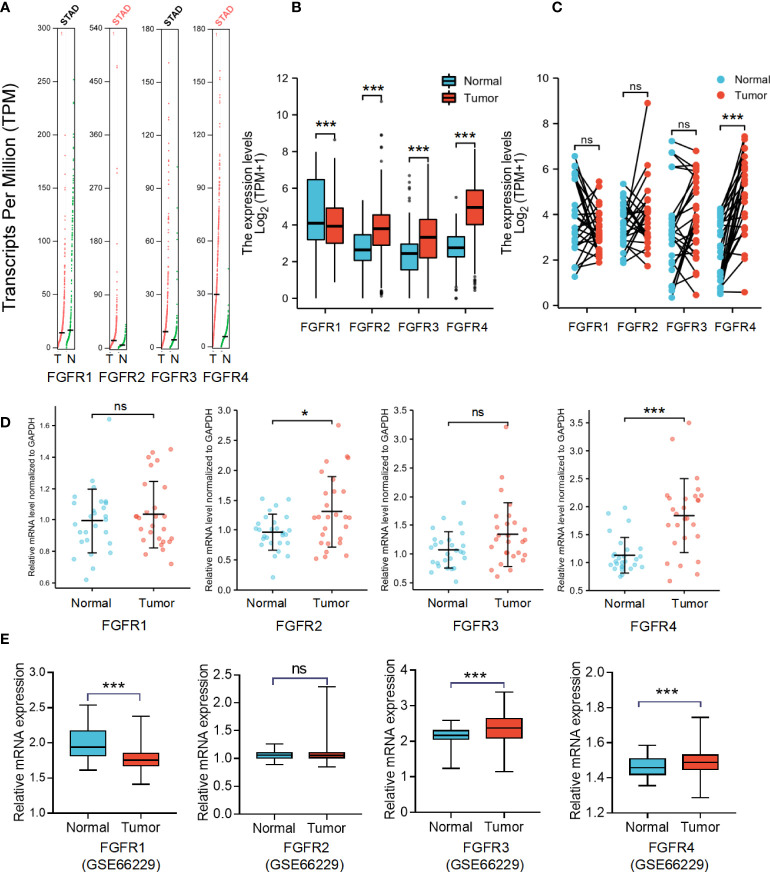
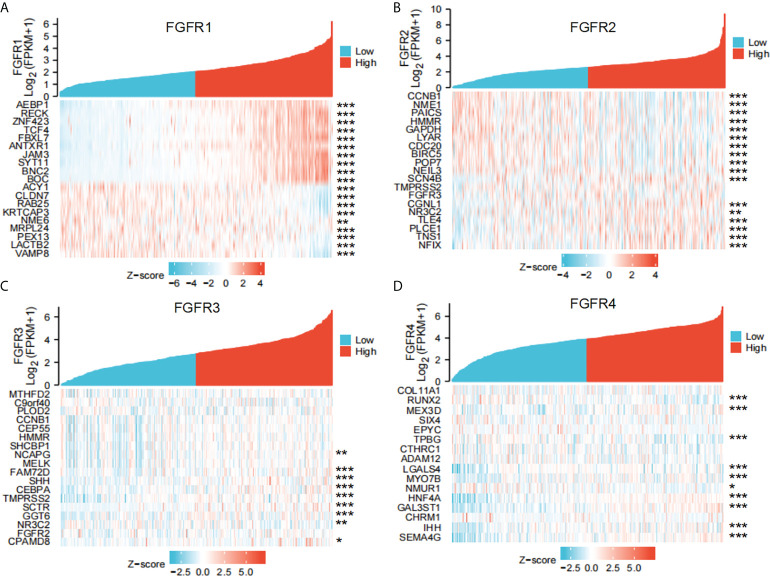
Methods: The expression of four different types of FGFRs was analyzed via GEPIA, TCGA-STAD, and GTEX databases and our 27 pairs of GC tumor samples and the adjacent normal tissue. Furthermore, the Kaplan-Meier plot and the TCGA database were utilized to assess the association of FGFRs with clinical prognosis. The R software was used to evaluate FGFRs co-expression genes with GO/KEGG Pathway Enrichment Analysis. In vitro and in vivo functional analyses and immunoblotting were performed to verify FGFR4 overexpression consequence. Moreover, the correlation between FGFRs and cancer immune infiltrates was analyzed by TIMER and TCGA databases. And the efficacy of anti-PD-1 mAb treatment was examined in NOG mouse models with overexpressed FGFR1 or FGFR4.

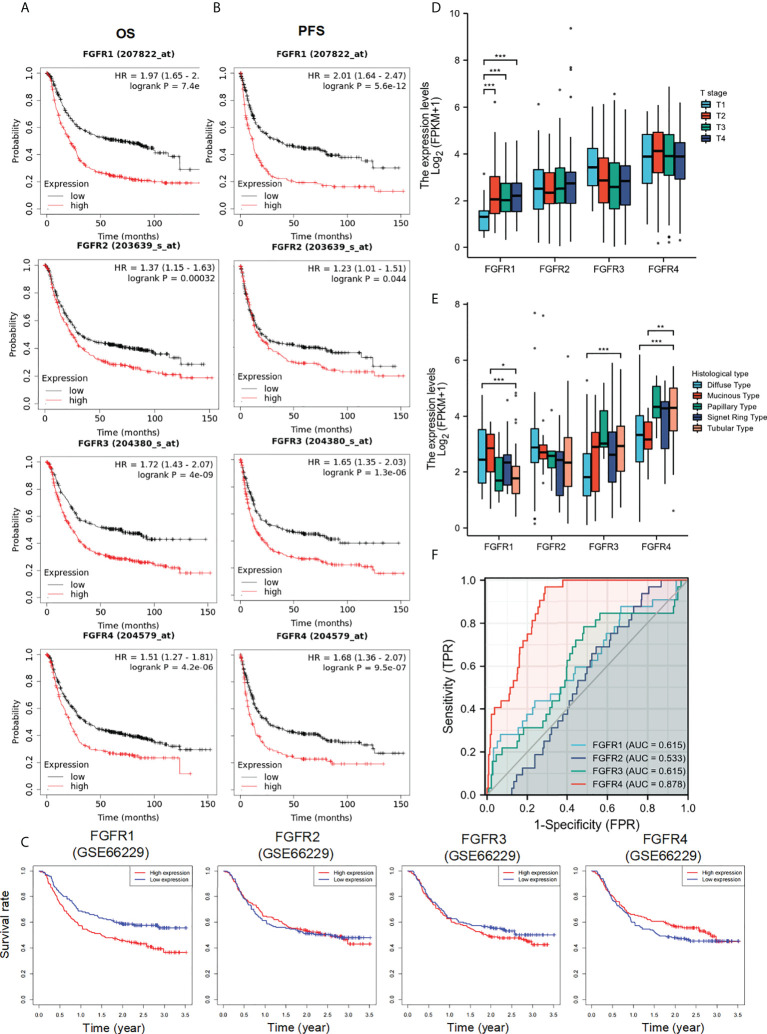
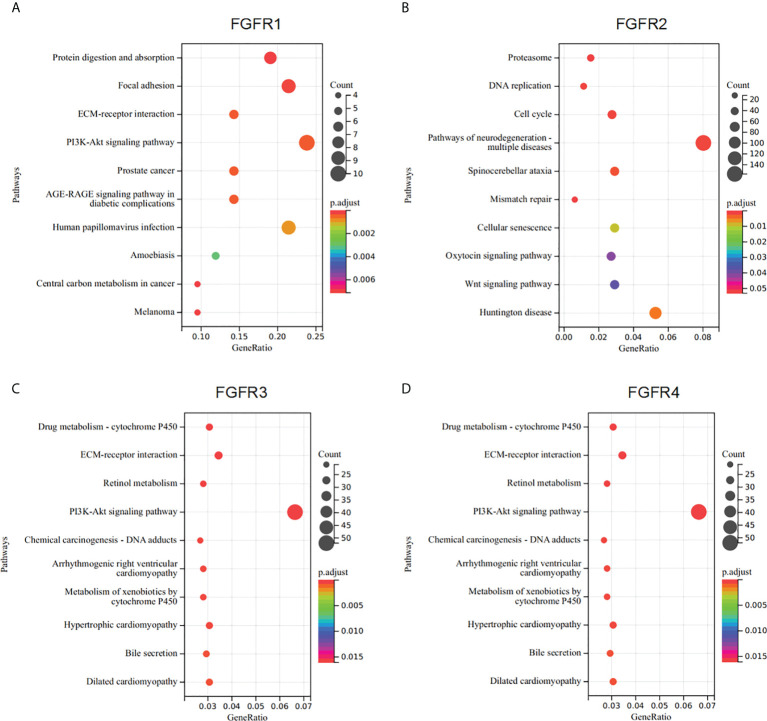
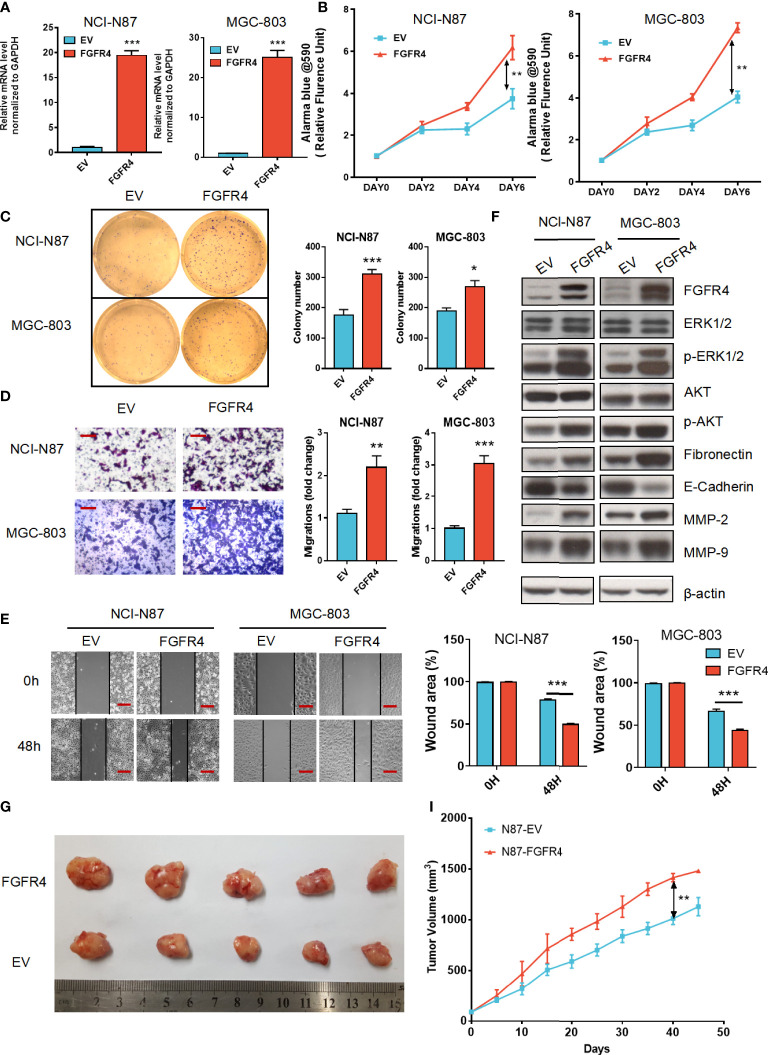
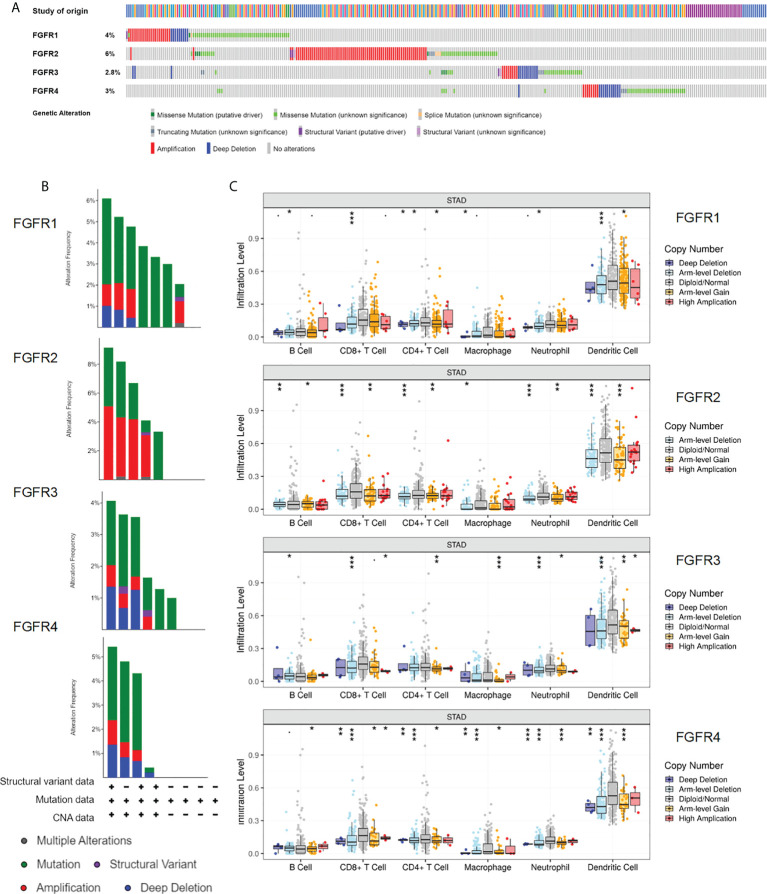
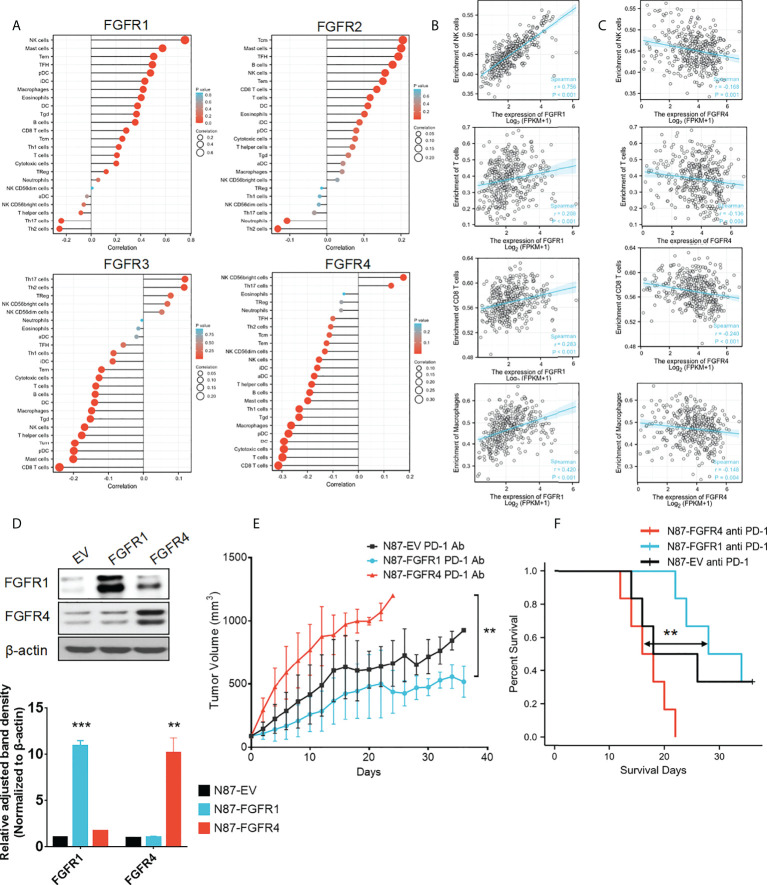
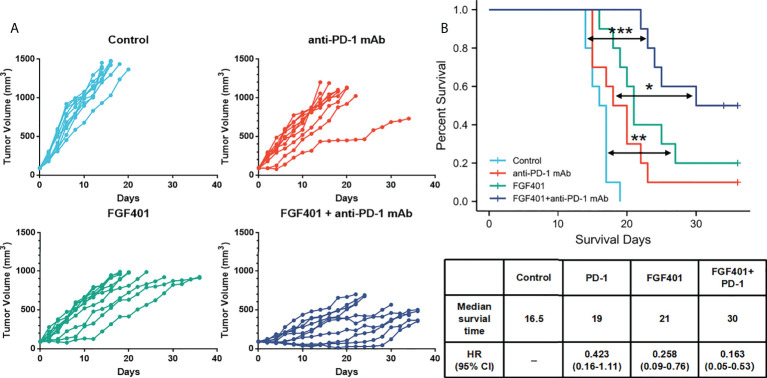
Results: The expression of FGFRs was considerably elevated in STAD than in the normal gastric tissues and was significantly correlated with poor OS and PFS. ROC curve showed the accuracy of the FGFRs in tumor diagnosis, among which FGFR4 had the highest ROC value. Besides, univariate and multivariate analysis revealed that FGFR4 was an independent prognostic factor for GC patients. According to a GO/KEGG analysis, the FGFRs were implicated in the ERK/MAPK, PI3K-AKT and extracellular matrix (ECM) receptor signaling pathways. In vivo and in vitro studies revealed that overexpression of FGFR4 stimulated GC cell proliferation, invasion, and migration. In addition, FGFR1 expression was positively correlated with infiltrating levels of CD8+ T-cells, CD4+ T-cells, macrophages, and dendritic cells in STAD. In contrast, FGFR4 expression was negatively correlated with tumor-infiltrating lymphocytes. Interestingly, overexpression of FGFR1 in the NOG mouse model improved the immunotherapeutic impact of GC, while overexpression of FGFR4 impaired the effect. When combined with an FGFR4 inhibitor, the anti-tumor effect of anti-PD-1 treatment increased significantly in a GC xenograft mouse model with overexpressed FGFR4.

Conclusions: FGFRs has critical function in GC and associated with immune cell infiltration, which might be a potential prognosis biomarker and predictor of response to immunotherapy in GC.

Keywords: anti-programmed cell death 1 monoclonal antibodies (Anti-PD-1 mAB); database analysis; fibroblast growth factor receptors (FGFRs); gastric cancer; immune cell infiltration; prognosis.


Conflict of interest statement

The authors declare that the research was conducted in the absence of any commercial or financial relationships that could be construed as a potential conflict of interest.

Figures

Figure 1
Figure 1
The mRNA expression levels of FGFRs in GC. (A) The differential expression of FGFR family members in cohort tumor and non-tumor tissues was analyzed with GEPIA. (B) The difference in expression of FGFRs between STAD in TCGA data sets and normal gastric tissues in GTEX data sets. (C) The differences in expression of FGFRs between STAD and matched normal tissues from TCGA-STAD database were determined by GEPIA. (D) The mRNA expression of FGFRs in gastric tumor tissues and matched adjacent non-tumor tissues from our samples. (E) The differential expression of FGFRs between tumor and matched normal tissues from GSE66229 database. *p < 0.05; ***p < 0.001; **** p <0.0001; ns, not significant; GC, gastric cancer; T, tumor; N, normal.
Figure 2
Figure 2
The diagnostic and prognostic value of FGFRs in GC. (A, B) The OS (A) and PFS (B) survival curves of FGFRs in TCGA-STAD in Kaplan–Meier plot databases. (C) The OS survival curves of FGFRs in GSE66229 database. (D, E) The expression of FGFRs in different T stages (D) and histologies (E) were analyzed in TCGA-STAD data sets. (F) ROC curve analysis of FGFRs in the diagnosis of GC. *p < 0.05; **p < 0.01; ***p < 0.001; OS, overall survival; PFS, progression-free survival; GC, gastric cancer.
Figure 3
Figure 3
The co-expressed genes associated with the expression of FGFRs were analyzed as a heatmap by using the STAD data sets of TCGA. (A) FGFR1, (B) FGFR2, (C) FGFR3, (D) FGFR4. *p<0.05; **p<0.01; ***p<0.001.
Figure 4
Figure 4
Enrichment analysis of FGFRs co-expression genes in GC. (A–D) The functions of genes significantly associated with FGFR1 (A), FGFR2 (B), FGFR3 (C), and FGFR4 (D) alterations were predicted by the enrichment analysis of KEGG. GC, gastric cancer; KEGG, Kyoto Encyclopedia of Genes and Genomes.
Figure 5
Figure 5
FGFR4 overexpression in GC cells exhibits a tumor progression effect. (A) FGFR4 mRNA levels were detected by qRT-PCR in NCI-N87 (A) and MGC-803 cells transfected with EV (control plasmid) and FGFR4 (p-HAGE -FGFR4). (B) FGFR4 overexpression promoted cell proliferation in GC NCI-N87 and MGC-803 cells, respectively. (C) FGFR4 overexpression improved the colony formation ability of GC cells. (D, E) Cell invasion and migration capacity were measured by the Transwell invasion assay (D) (scale bar, 100 μm) and Scratch assay (E) (scale bar, 200 μm). (F) N87-EV, N87-FGFR4, MGC803-EV, and MGC803-FGFR4 cells were collected with lysates subject to immunoblotting. (G) Representative images of nude mouse subcutaneous tumors for N87-EV and N87-FGFR4 cell lines. (I) Tumor volume was measured at the indicated time points. Data represent the mean of three independent experiments. *p < 0.05, **p < 0.01, ***p<0.001 student’s t-test; GC, gastric cancer; RT-PCR, real-time quantitative reverse transcription polymerase chain reaction; EV, empty vector.
Figure 6
Figure 6
Genomic alterations of the FGFR family in GC. (A, B) The types and frequencies of FGFR family alterations in the GC samples through the cBioportal database. (Data base selected: TGCA, Nature 2014; TCGA, Firehose Legacy; TCGA, PanCancer Atlas; MSK,2020; UHK, Nat Genet 2011; Pifizer and UHK, Nat Genet 2014; U Tokyo, Nat Genet 2014; TMUCIH, PNAS, 2015. (C) Association between FGFRs gene copy number and immune cell infiltration levels in TCGA-STAD cohorts. *p < 0.05; **p < 0.01; ***p < 0.001; GC, gastric cancer.
Figure 7
Figure 7
Expression of FGFRs related to tumor immune cell infiltration in TCGA-STAD. (A) The correlation between FGFRs and the different immune infiltrating cells in TCGA-STAD. (A, B) The correlation between FGFR1 (B) /FGFR4 (C) and NK cell/CD8+ T-cells/B-cells/macrophages in cell infiltration in TCGA-STAD. (D) FGFR1 and FGFR4 were stable and overexpressed in NCI-N87 cells. (E) The anti-PD-1 mAb was more effective in controlling tumor volume in mice with FGFR1 than FGFR4 overexpressed NCI-N87 xenografts. (F) Kaplan–Meier plots of mouse survival. Survival days represents as the time from Day 1 to the day of death or euthanization. **p<0.01, ***p<0.001, log-rank test between groups.
Figure 8
Figure 8
FGFR4 overexpression in the mouse model re-sensitized to anti-PD-1 mAb treatment in combination with an FGFR4 inhibitor. The N87-FGFR4 subcutaneous xenograft model was divided into different treatment groups either orally treated with FGF401 at 30 mg/kg once day or intraperitoneally injected with anti-PD-1 mAb at 200 mg/mouse twice weekly for 4 weeks, or both. (A) TVs of individual mice. Top left: control. Top right: anti-PD-1 mAb group. Bottom left: FGF401 group. Bottom right: FGF401 plus anti-PD-1 mAb treatment group. (B) Kaplan–Meier plots of mouse survival. Bottom, a table showed the median survival time of mice in different group and its HR (95% CI). (*p < 0.05; **p<.01;***p < 0.001, log-rank test between groups; TV, tumor volume.

Similar articles

Cited by

References

    1. Sung H, Ferlay J, Siegel RL, Laversanne M, Soerjomataram I, Jemal A, et al. . Global cancer statistics 2020: GLOBOCAN estimates of incidence and mortality worldwide for 36 cancers in 185 countries. CA Cancer J Clin (2021) 71(3):209–49. doi: 10.3322/caac.21660 - DOI - PubMed
    1. Ooki A, Yamaguchi K. The beginning of the era of precision medicine for gastric cancer with fibroblast growth factor receptor 2 aberration. Gastric Cancer (2021) 24(6):1169–83. doi: 10.1007/s10120-021-01235-z - DOI - PubMed
    1. Katoh M. Fibroblast growth factor receptors as treatment targets in clinical oncology. Nat Rev Clin Oncol (2019) 16(2):105–22. doi: 10.1038/s41571-018-0115-y - DOI - PubMed
    1. Babina IS, Turner NC. Advances and challenges in targeting FGFR signalling in cancer. Nat Rev Cancer (2017) 17(5):318–32. doi: 10.1038/nrc.2017.8 - DOI - PubMed
    1. Kacew A, Sweis RF. FGFR3 alterations in the era of immunotherapy for urothelial bladder cancer. Front Immunol (2020) 11:575258. doi: 10.3389/fimmu.2020.575258 - DOI - PMC - PubMed