. 2022 Sep 6:12:969855.
doi: 10.3389/fonc.2022.969855. eCollection 2022.

Consensus molecular subtype 4 (CMS4)-targeted therapy in primary colon cancer: A proof-of-concept study

Affiliations

Consensus molecular subtype 4 (CMS4)-targeted therapy in primary colon cancer: A proof-of-concept study

Niek A Peters et al. Front Oncol. .

Abstract

Background: Mesenchymal Consensus Molecular Subtype 4 (CMS4) colon cancer is associated with poor prognosis and therapy resistance. In this proof-of-concept study, we assessed whether a rationally chosen drug could mitigate the distinguishing molecular features of primary CMS4 colon cancer.

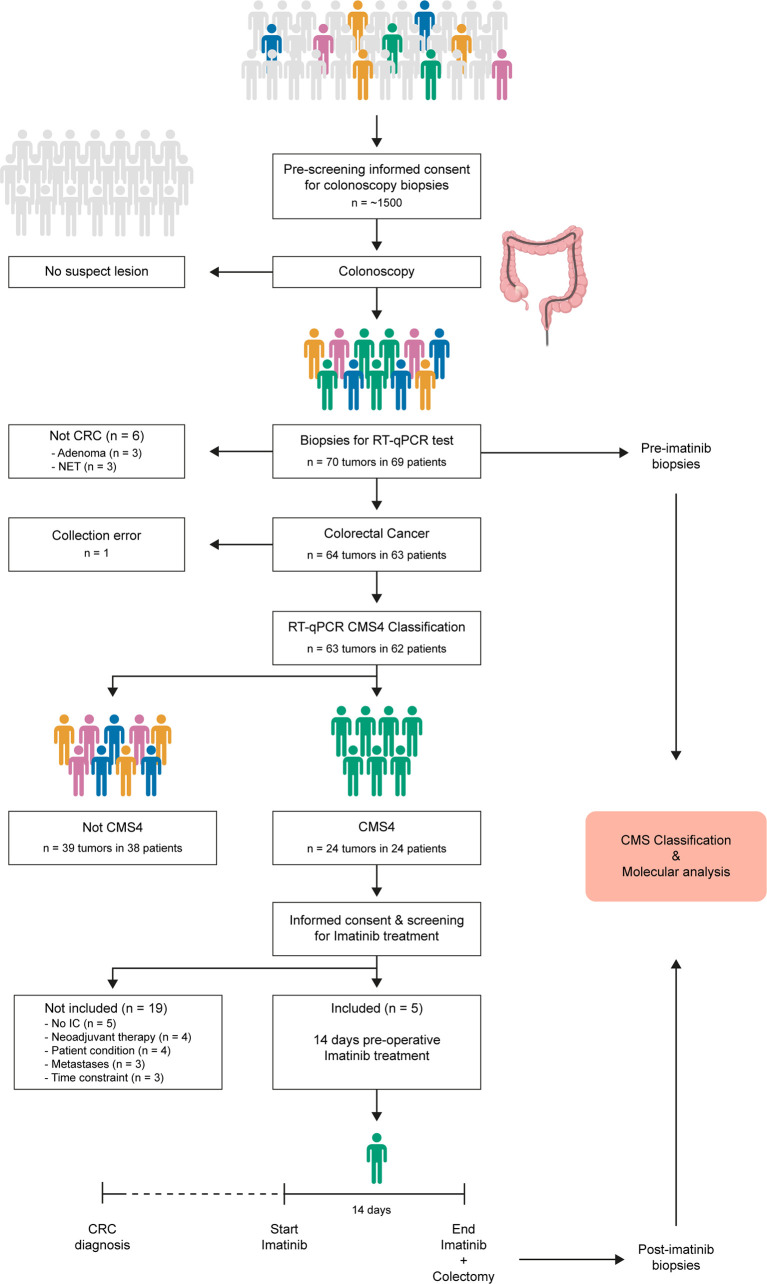
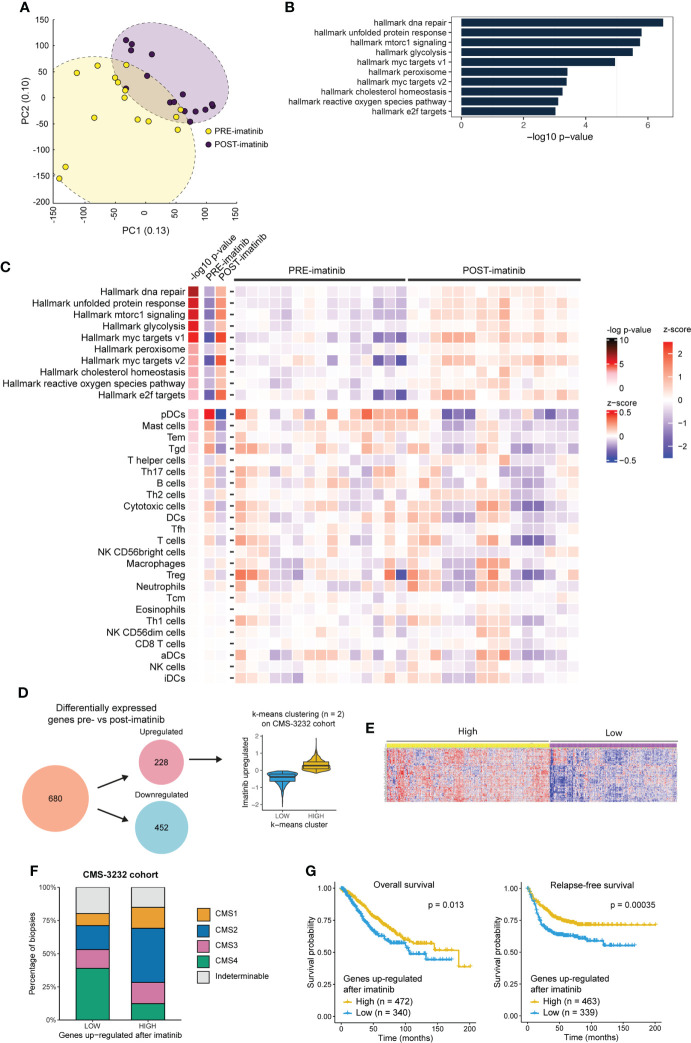
Methods: In the ImPACCT trial, informed consent was obtained for molecular subtyping at initial diagnosis of colon cancer using a validated RT-qPCR CMS4-test on three biopsies per tumor (Phase-1, n=69 patients), and for neoadjuvant CMS4-targeting therapy with imatinib (Phase-2, n=5). Pre- and post-treatment tumor biopsies were analyzed by RNA-sequencing and immunohistochemistry. Imatinib-induced gene expression changes were associated with molecular subtypes and survival in an independent cohort of 3232 primary colon cancer.

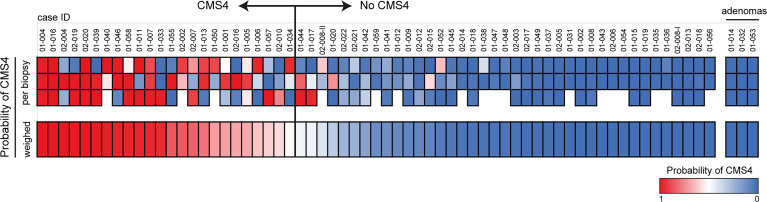
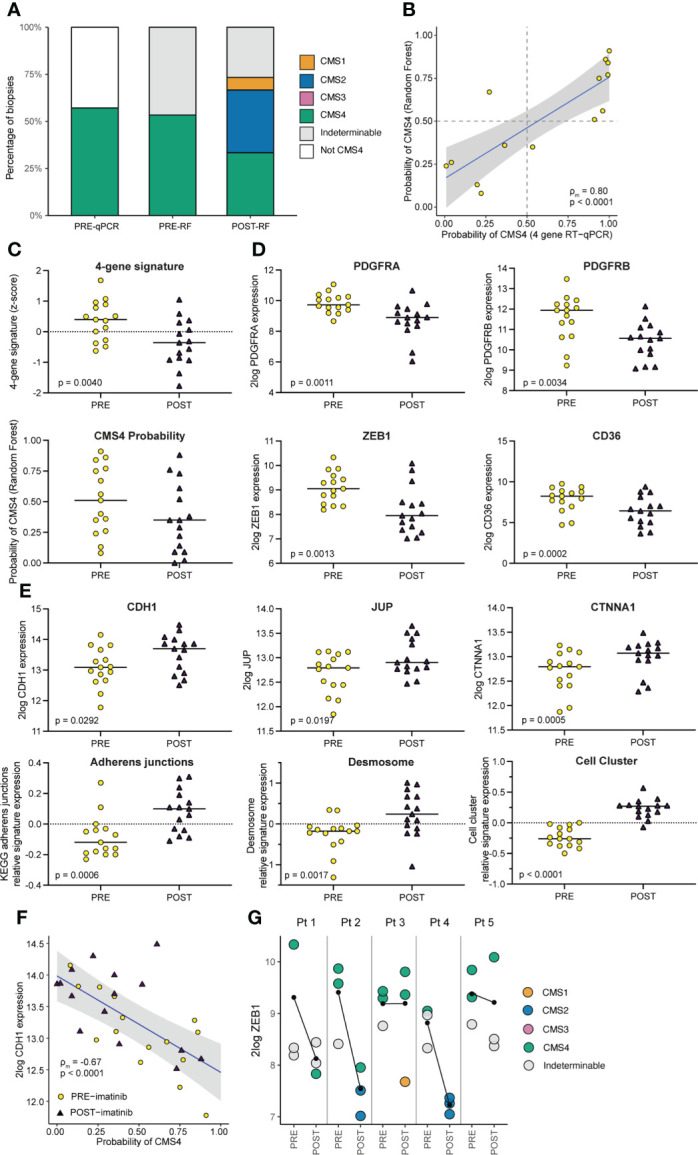
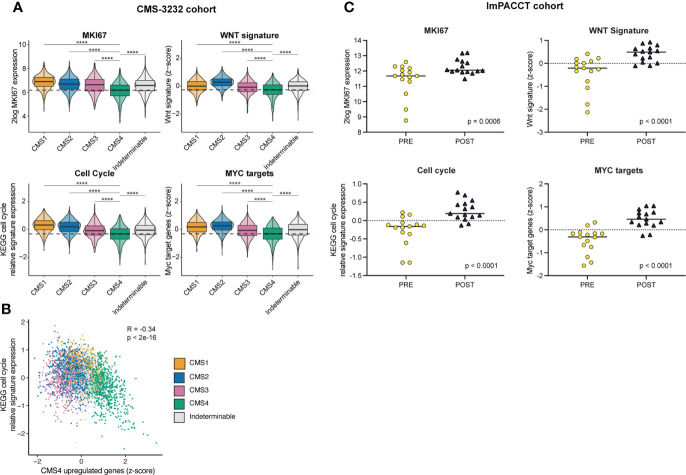
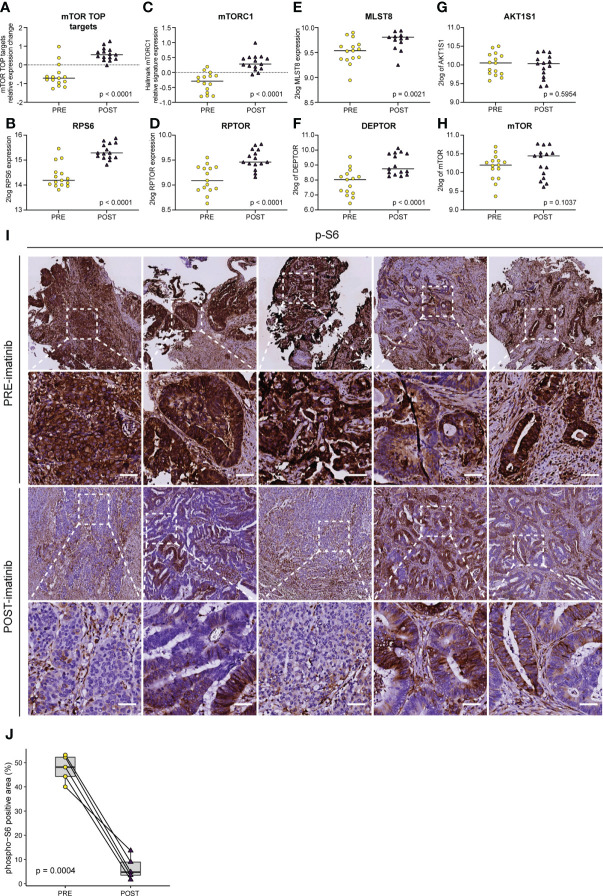
Results: The CMS4-test classified 52/172 biopsies as CMS4 (30%). Five patients consented to imatinib treatment prior to surgery, yielding 15 pre- and 15 post-treatment samples for molecular analysis. Imatinib treatment caused significant suppression of mesenchymal genes and upregulation of genes encoding epithelial junctions. The gene expression changes induced by imatinib were associated with improved survival and a shift from CMS4 to CMS2.

Conclusion: Imatinib may have value as a CMS-switching drug in primary colon cancer and induces a gene expression program that is associated with improved survival.

Keywords: ImPACCT; colorectal cancer; consensus molecular subtype 4; imatinib; platelet-derived growth factor receptor (PDGFR).


Conflict of interest statement

The authors declare that the research was conducted in the absence of any commercial or financial relationships that could be construed as a potential conflict of interest.

Figures

Figure 1
Figure 1
ImPACCT study flowchart. Individuals scheduled for a colonoscopy procedure were approached to obtain informed consent for acquisition of 5 additional biopsies for CMS4 testing in case suspect lesions were found, and for approval to approach them again in case the tumor was diagnosed as CMS4. Patients with CMS4 CRC were approached to obtain informed consent for the second part of the study (imatinib treatment), and were screened for eligibility. Five patients received imatinib treatment for 14 days prior to surgery. Pre-treatment diagnostic biopsies and post-treatment biopsies from the resected primary tumors were used for CMS classification and additional molecular analyses.CMS, consensus molecular subtype; RT-qPCR, real-time quantitative polymerase chain reaction; IC, informed consent; CRC, colorectal cancer.
Figure 2
Figure 2
. CMS4 assessment on diagnostic biopsies and patient selection. Diagnostic biopsies (3 per tumor) were processed for RNA isolation and subsequent CMS4 testing, using a previously designed and validated RT-qPCR test (9). The heatmap shows CMS4 probabilities per-biopsy (top) and the weighed mean probabilities per tumor, to account for intra-tumor CMS4 heterogeneity. If the weighed mean probability was higher than 50%, tumors were classified as CMS4 (n=24) and the patients were approached for the second part of the study. The cohort contained 3 histologically confirmed adenomas (right sub-panel).
Figure 3
Figure 3
Imatinib treatment of primary CMS4 CRC results in a mesenchymal-to-epithelial phenotype shift. (A) Bar graph summarizing CMS classification of tumor tissue samples PRE and POST imatinib treatment, measured by the RT-qPCR test and the CMS random forest (RF) classifier applied to RNA sequencing data. (B) XY-plot showing the correlation between CMS4 probabilities of pre-treatment diagnostic biopsies as measured by the RT-qPCR test and the RF classifier. ρm denotes the marginal Pearson correlation coefficient for clustered data (34) with two-sided p-value. (C) Dot-plots showing expression (mean z-scores) of a signature comprised of the 4 genes in the CMS4 test (PDGFRA, PDGFRB, PDGFC, KIT) and the CMS4 probabilities generated by the RF classifier, in tissue samples PRE and POST imatinib treatment. P values were generated using ANOVA and a linear mixed model. (D) Dot plots showing 2log expression levels of PDGFRA, PDGFRB, ZEB1, and CD36 in tissue samples PRE and POST imatinib treatment. P values were generated using a two-sided Student’s t-test. (E) Dot plots Graphs showing 2log expression values of epithelial junction genes (CDH1, JUP, and CTNNA) and expression of signatures for Adherens Junctions, Desmosomes, and genes upregulated in epithelial cell clusters versus single cells in tissue samples PRE and POST imatinib treatment. P values were generated using ANOVA and a linear mixed on pre- vs post-treatment biopsies. (F) XY-plot showing the (negative) correlation between CDH1 expression and CMS4 probabilities (RF) in tissue samples PRE and POST imatinib treatment. ρm denotes the marginal Pearson correlation coefficient for clustered data with two-sided p-value. (G) Dot plot showing ZEB1 expression in tissue samples PRE and POST imatinib treatment in individual patients with color-coded CMS classification. The black lines indicate the change in mean ZEB1 expression following imatinib treatment.
Figure 4
Figure 4
Imatinib treatment of primary CMS4 CRC causes increased expression of proliferation-associated genes. (A) Tukey box and violin plots showing expression of the proliferation marker MKI67 and signatures reflecting cell cycle activity (KEGG), WNT target genes (31), and MYC target genes (39) in CMS1–4 in the CMS–3232 cohort. Statistically significant differences were identified using one–way analysis of variance (ANOVA) with subsequent post–hoc pairwise comparisons using t–tests with pooled SD using Bonferroni multiple comparison p–value adjustment. (B) XY–plot demonstrating the (negative) correlation between CMS4–identfying genes in the RF classifier and the KEGG pathway signature genes reflecting cell cycle activity. R denotes the Pearson correlation coefficient with two–sided p–value in the CMS–3232 cohort. CMS1–4 are color–coded. (C) As in (A) but in the ImPACCT cohort. Statistically significant differences were identified using two–sided ANOVA and a linear mixed model.
Figure 5
Figure 5
Imatinib treatment of primary CMS4 CRC induces a phenotype that is associated with better prognosis. (A) Principle component analysis based on expression of all genes. PRE and POST imatinib samples are color–coded. (B) Bar plot showing the significant up– and down–regulated cancer hallmark signatures (40) (n = 10/50) between pre– and post–imatinib biopsies ranked according to significance (min–log10 p–values). (C) Heatmap showing expression of the 10 significantly upregulated hallmark signatures and a compendium of immune signatures (29) in PRE and POST imatinib treatment samples. (D) Differential gene expression analysis (ANOVA FDR p ≤ 0.001) identified 680 differentially expressed genes of which 228 were up– and 452 were down–regulated after imatinib therapy. The 228 imatinib–induced genes were then used to cluster the CMS3232 cohort (1) into LOW and HIGH expression subgroups using the k–means algorithm. (E) Heatmap showing expression of imatinib–induced genes in the LOW and HIGH expression subgroups. (F) Stacked barplot showing the CMS distribution in subgroups of tumors expressing LOW and HIGH levels of imatinib–induced genes. (G) Kaplan Meier curves showing overall (left) and relapse–free (right) survival in subgroups of stage II–III tumors in the CMS3232 cohort (1) expressing LOW and HIGH levels of imatinib–induced genes. A two–sided log–rank test was applied to assess the significance of the survival differences between the two groups.
Figure 6
Figure 6
Imatinib inhibits ribosomal protein S6 phosphorylation and causes transcriptional activation of the mTORC1 pathway. Expression levels of (A) mTORC1 TOP target mRNAs (33), (B) ribosomal protein S6 (RPS6), (C) the Hallmark mTORC1 signature, and the individual mTORC1 components (D) RPTOR, (E) MLST8, (F) DEPTOR, (G) AKT1S1, and (H) MTOR. Statistically significant expression differences were identified using ANOVA and a linear mixed model. (I) Immunohistochemistry (IHC) for the detection of phosphorylated ribosomal protein S6 (pS6) on PRE–treatment (upper row) and POST–treatment (lower row) biopsies. Representative images of the stained sections are shown. Scale bar, 50 μm (J) QuPath software (41) was used to quantify the pS6 IHC signal in the epithelial compartment in pre– and post–imatinib biopsies. Values were then plotted in Tukey boxplots and the significance of the observed staining difference was assessed using a two–sided paired Student’s t–test.

References

    1. Guinney J, Dienstmann R, Wang X, de Reynies A, Schlicker A, Soneson C, et al. . The consensus molecular subtypes of colorectal cancer. Nat Med (2015) 21(11):1350–6. doi: 10.1038/nm.3967 - DOI - PMC - PubMed
    1. Trinh A, Trumpi K, De Sousa EMF, Wang X, de Jong JH, Fessler E, et al. . Practical and robust identification of molecular subtypes in colorectal cancer by immunohistochemistry. Clin Cancer Res an Off J Am Assoc Cancer Res (2017) 23(2):387–98. doi: 10.1158/1078-0432.CCR-16-0680 - DOI - PubMed
    1. Song N, Pogue-Geile KL, Gavin PG, Yothers G, Kim SR, Johnson NL, et al. . Clinical outcome from oxaliplatin treatment in stage Ii/Iii colon cancer according to intrinsic subtypes: Secondary analysis of nsabp c-07/Nrg oncology randomized clinical trial. JAMA Oncol (2016) 2(9):1162–9. doi: 10.1001/jamaoncol.2016.2314 - DOI - PMC - PubMed
    1. Ten Hoorn S, de Back TR, Sommeijer DW, Vermeulen L. Clinical value of consensus molecular subtypes in colorectal cancer: A systematic review and meta-analysis. J Natl Cancer Institute (2021) 114(4):503–16. doi: 10.1093/jnci/djab106 - DOI - PMC - PubMed
    1. Calon A, Lonardo E, Berenguer-Llergo A, Espinet E, Hernando-Momblona X, Iglesias M, et al. . Stromal gene expression defines poor-prognosis subtypes in colorectal cancer. Nat Genet (2015) 47(4):320–9. doi: 10.1038/ng.3225 - DOI - PubMed