. 2022 Sep 6:12:905230.
doi: 10.3389/fonc.2022.905230. eCollection 2022.

Myoferlin disturbs redox equilibrium to accelerate gastric cancer migration

Affiliations

Myoferlin disturbs redox equilibrium to accelerate gastric cancer migration

Hailong Shi et al. Front Oncol. .

Abstract

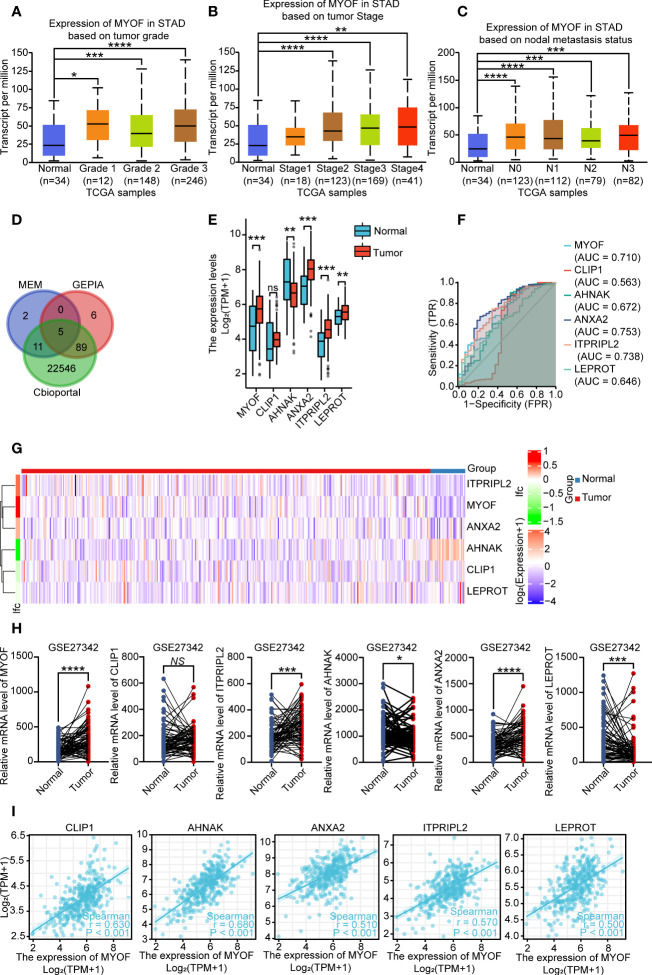
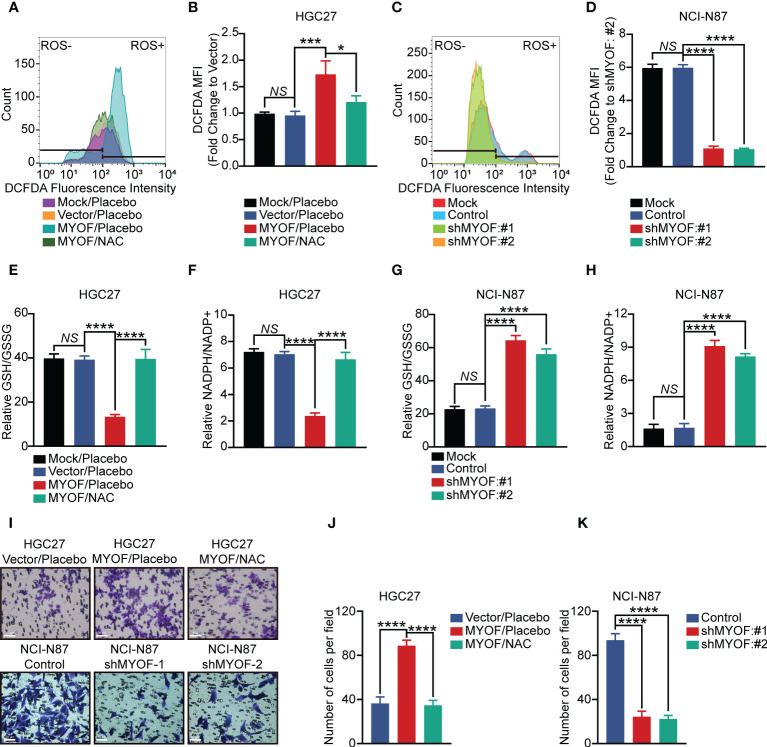
Objective: In contrast to normal cells, in which reactive oxygen species (ROS) are maintained in redox equilibrium, cancer cells are characterized by ectopic ROS accumulation. Myoferlin, a newly identified oncogene, has been associated with tumor metastasis, intracellular ROS production, and energy metabolism. The mechanism by which myoferlin regulates gastric cancer cell migration and ROS accumulation has not been determined.

Methods: Myoferlin expression, intracellular ROS levels, the ratios of reduced to oxidized glutathione (GSH/GSSG) and nicotinamide adenine dinucleotide phosphate (NADPH/NADP+) and migratory ability were measured in gastric cancer cells in vitro and in the TCGA and GEO databases in silico.

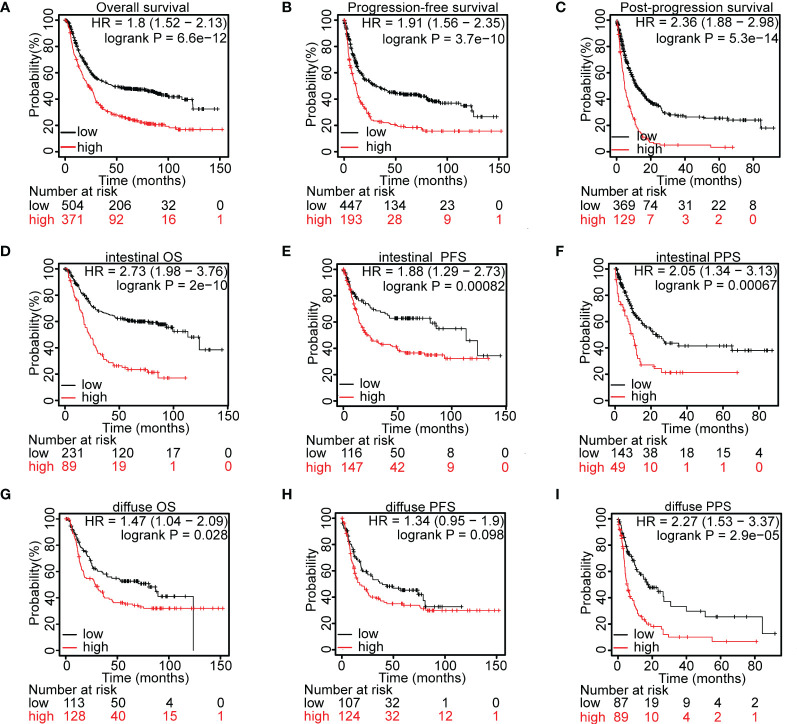
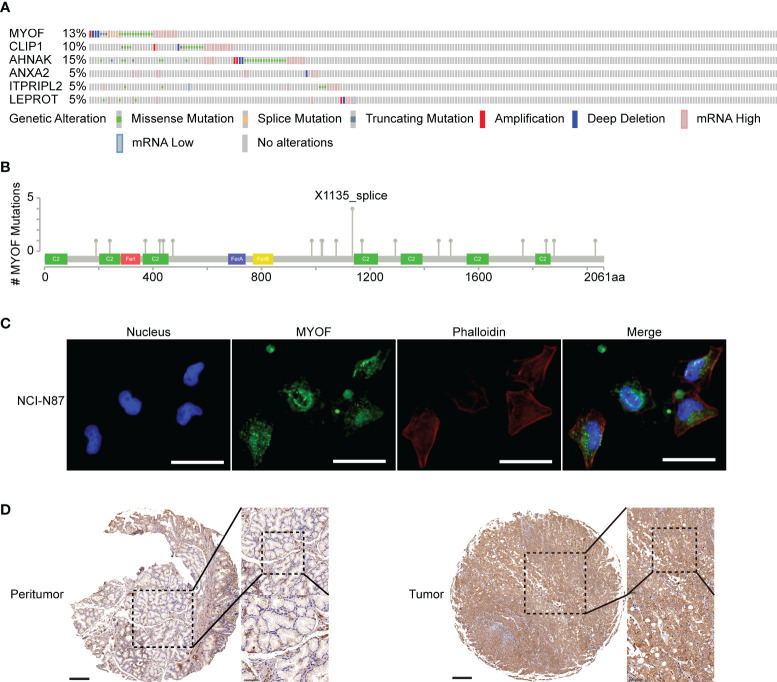
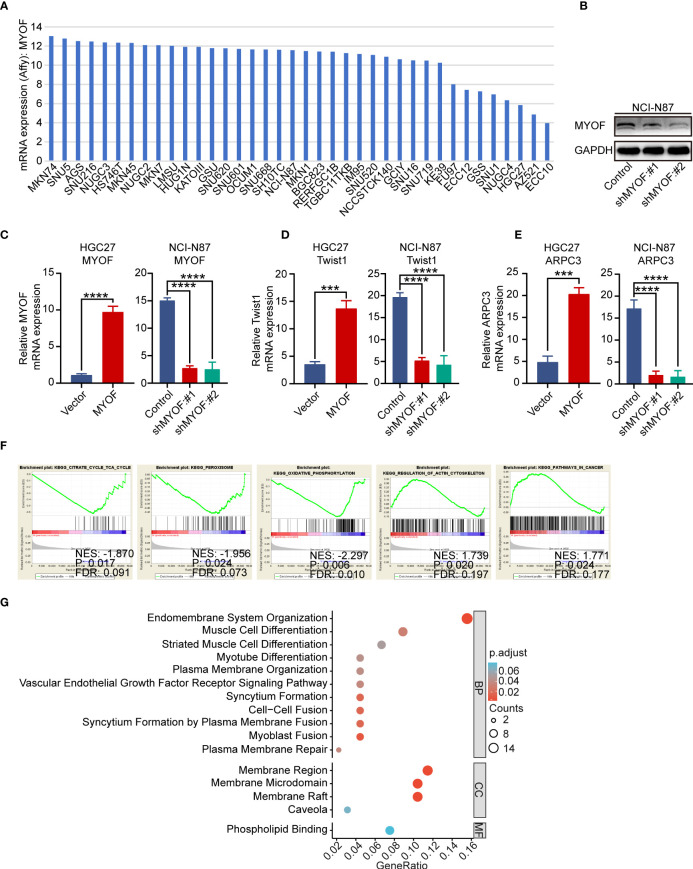
Results: Myoferlin was found to be more highly expressed in tumor than in normal tissues of gastric cancer patients, with higher expression of Myoferlin associated with shorter survival time. Myoferlin was associated with significantly higher intracellular ROS levels and enhanced migration of gastric cancer cells. N-acetyl-L-cysteine (NAC), a potent inhibitor of ROS, inhibited Myoferlin-induced ROS accumulation and cell migration.

Conclusions: Myoferlin is a candidate prognostic biomarker for gastric cancer and plays an essential role in regulating redox equilibrium and gastric cancer cell migration. Myoferlin may also be a new target for treatment of patients with gastric cancer.

Keywords: GSH; ROS; gastric cancer; metastasis; myoferlin.


Conflict of interest statement

The authors declare that the research was conducted in the absence of any commercial or financial relationships that could be construed as a potential conflict of interest.

Figures

Figure 1
Figure 1
Expression of MYOF mRNA and correlated genes in gastric cancer and normal gastric tissues. (A) MYOF mRNA levels in gastric cancer samples from the TCGA database according to tumor grade, with Grade 1 indicating well-differentiated (low grade) tumors, Grade 2 indicating moderately differentiated (intermediate grade) tumors and Grade 3 indicating poorly differentiated (high grade) tumors (B) MYOF mRNA levels in gastric cancer samples with different AJCC stages from the TCGA databases. (C) MYOF mRNA levels in gastric cancer samples from the TCGA database differing in lymph node metastasis status, with N0 indicating no regional lymph node metastases and N1, N2, and N3 indicating metastases in 1–3, 4–9 and ≥10 axillary lymph nodes. (D) Venn diagram showing factors correlating with MYOF expression identified with the cBioPortal, GEPIA, and MEM web tools. The shared genes were found to be CLIP1, AHNAK, ANXA2, ITPRIPL2 and LEPROT. (E) Expression of MYOF, CLIP1, AHNAK, ANXA2, ITPRIPL2 and LEPROT mRNAs in gastric cancer and normal gastric tissues in the TCGA database. (F) Receiver operating characteristic (ROC) curves comparing the ability of MYOF, CLIP1, AHNAK, ANXA2, ITPRIPL2 or LEPROT mRNA levels to predict gastric cancer. FPR: false positive rate; TPR: true positive rate. (G) Heatmap representation of MYOF, CLIP1, AHNAK, ANXA2, ITPRIPL2 and LEPROT expression profiles in tumor and normal tissues from the TCGA-STAD database. Genes with higher and lower expression in tumor samples are shown in red and blue, respectively. (H) Validation of MYOF, CLIP1, AHNAK, ANXA2, ITPRIPL2 and LEPROT mRNA expression levels in gastric cancer and normal gastric tissues in the GEO database (GSE27342). (I) Correlations between MYOF mRNA levels and the expression of correlating factors in human gastric cancer tissues from the TCGA-STAD database. Data are expressed as mean ± S.D., and P values were calculated using unpaired two-tailed Student’s t-tests or ANOVA, as appropriate. NS, not significant, *P<0.05, **P<0.01, ***P<0.001, ****P<0.0001.
Figure 2
Figure 2
Prognostic value of MYOF mRNA level in gastric cancer patients. (A–C) Kaplan–Meier analyses of (A) overall survival (OS), B) progression-free survival (PFS), and (C) post-progression survival (PPS) of gastric cancer patients with high and low levels of MYOF mRNA expression in the GEO database. (D–F) Kaplan–Meier analyses of (D) OS, (E) PFS, and (F) PPS of patients with intestinal type gastric cancer and high and low levels of MYOF mRNA expression from the GEO database. (G–I) Kaplan–Meier analyses of (G) OS, (H) PFS, and (I) PPS of patients with diffuse type gastric cancer and high and low levels of MYOF mRNA expression from the GEO database. Survival times were compared between groups using the Mantel–Cox test.
Figure 3
Figure 3
Alterations in the MYOF and correlating genes using the cBioPortal webtool. (A) Genetic alterations in the MYOF, CLIP1, AHNAK, ANXA2, ITPRIPL2 and LEPROT genes of patients in the TCGA-STAD cohort derived from the cBioPortal website. (B) Graphic representation of the location, frequency, and mutation hotspots of the MYOF gene in gastric cancer patients from the TCGA cBioPortal. (C) Immunofluorescence staining of NCI-N87 cells for MYOF (MYOF, green; DAPI, blue; Palloidin, red). Scale bar, 50 μm, 400× magnification. (D) Representative images from gastric cancer tissue and peritumor sections stained with anti-MYOF antibody. Scale bars, 200 μm, 50× magnification (main images; left); 50 μm, 200× magnification (magnified view of the regions in the dotted boxes; upper right), and 50 μm, 400× magnification (magnified view of the regions in the dotted boxes; lower right).
Figure 4
Figure 4
Biological function of MYOF in gastric cancer cells. (A) MYOF mRNA expression in gastric cancer cell lines from the Cancer Cell Line Encyclopedia database. (B) Effect of MYOF knockout on the expression of MYOF protein in NCI-N87 cells infected with empty lentiviral vector (Control) and with vectors expressing shMYOF #1, and #2, as determined by western blotting. GAPDH was used as the protein loading control. (C) Effect of MYOF knockout on MYOF mRNA expression in indicated cells by qRT-PCR. (D, E) Effects of MYOF knockout or overexpression on the expression of (D) Twist1 and (E) ARPC3 mRNAs, as determined by qRT-PCR. The data shown are the mean ± SD relative mRNA expression from three independent experiments, using triplicates of each sample in each experiment. P values were determined using unpaired two-tailed Student’s t-tests or ANOVA. ***P<0.001, ****P<0.0001. (F) Gene Set Enrichment Analysis of identified KEGG pathways in gastric cancer tissues with high and low MYOF expression levels. (G) Representative Gene Ontology (GO) pathways associated with biological processes (BP), cellular components (CC) and molecular functions (MF).
Figure 5
Figure 5
MYOF promotion of gastric cancer cell motility and intracellular reactive oxygen species (ROS). (A, B) Intracellular ROS levels (A) and DCFDA geometric mean fluorescence intensity (MFI) (B) of HGC27 gastric cancer cells alone (wild-type) or infected with empty vector or vector encoding MYOF, with the latter treated with vehicle or NAC (5 μM) for 24 h The data in (B) are shown as the mean ± SD fold changes in MFI compared with HGC27-Vector cells from three independent experiments. (C, D) Intracellular ROS levels (C) and DCFDA geometric mean fluorescence intensity (MFI) (D) of NCI-N87 gastric cancer cells alone (wild-type) or infected with empty vector or vector encoding shMYOF#1 or shMYOF#2. The data in (D) are shown as the mean ± SD fold changes in MFI compared with NCI-N87 shMYOF#2 cells from three independent experiments. (E, F) Intracellular GSH and GSSG levels, expressed as GSH/GSSG ratios (E), and intracellular NADPH and NADP+ levels, expressed as NADPH/NADP+ ratios (F), of HGC27 gastric cancer cells alone (wild-type) or infected with empty vector or vector encoding MYOF, with the latter treated with vehicle or NAC (5 μM) for 24 h Results are expressed as the mean ± SD of three independent experiments. (G, H) Intracellular GSH and GSSG levels, expressed as GSH/GSSG ratios (G), and intracellular NADPH and NADP+ levels, expressed as NADPH/NADP+ ratios (H), of NCI-N87 gastric cancer cells alone (wild-type) or infected with empty vector or vector encoding shMYOF#1 or shMYOF#2. Results are expressed as the mean ± SD of three independent experiments. (I) Representative images of cell migration assays. Scale bar, 20 μm, 200× magnification. (J, K) Statistical analysis of migratory cells. Results are reported as the mean ± SD of three independent experiments, using triplicates of each sample in each experiment. P values were determined using unpaired two-tailed Student’s t-tests or ANOVA. NS, not significant, *P<0.05, ***P<0.001, ****P<0.0001.

Similar articles

Cited by

References

    1. Wang C, Xi W, Ji J, Cai Q, Zhao Q, Jiang J, et al. . The prognostic value of HGF-c-MET signaling pathway in gastric cancer: A study based on TCGA and GEO databases. Int J Med Sci (2020) 17(13):1946–55. doi: 10.7150/ijms.44952 - DOI - PMC - PubMed
    1. Wang C, Shi M, Ji J, Cai Q, Zhao Q, Jiang J, et al. . Stearoyl-CoA desaturase 1 (SCD1) facilitates the growth and anti-ferroptosis of gastric cancer cells and predicts poor prognosis of gastric cancer. Aging (2020) 12(15):15374–91. doi: 10.18632/aging.103598 - DOI - PMC - PubMed
    1. Siegel RL, Miller KD, Fuchs HE, Jemal A. Cancer statistics, 2021. CA Cancer J Clin (2021) 71(1):7–33. doi: 10.3322/caac.21654 - DOI - PubMed
    1. Liu X, Meltzer SJ. Gastric cancer in the era of precision medicine. Cell Mol Gastroenterol Hepatol (2017) 3(3):348–58. doi: 10.1016/j.jcmgh.2017.02.003 - DOI - PMC - PubMed
    1. Kim HJ, Oh SC. Novel systemic therapies for advanced gastric cancer. J Gastric Cancer (2018) 18(1):1–19. doi: 10.5230/jgc.2018 - DOI - PMC - PubMed

LinkOut - more resources