

Review
doi: 10.3389/bjbs.2022.10426.
eCollection 2022.
SARS-CoV-2 and COVID-19: A Narrative Review
Affiliations
- PMID: 36148046
- PMCID: PMC9486701
- DOI: 10.3389/bjbs.2022.10426
Item in Clipboard
Review
SARS-CoV-2 and COVID-19: A Narrative Review
Br J Biomed Sci.
.
Abstract
The World Health Organisation has reported that the viral disease known as COVID-19, caused by SARS-CoV-2, is the leading cause of death by a single infectious agent. This narrative review examines certain components of the pandemic: its origins, early clinical data, global and UK-focussed epidemiology, vaccination, variants, and long COVID.
Keywords: COVID-19; SARS-CoV-2; long COVID; vaccination; variants.
Copyright © 2022 Blann and Heitmar.
Conflict of interest statement
The authors declare that the research was conducted in the absence of any commercial or financial relationships that could be construed as a potential conflict of interest.
Figures
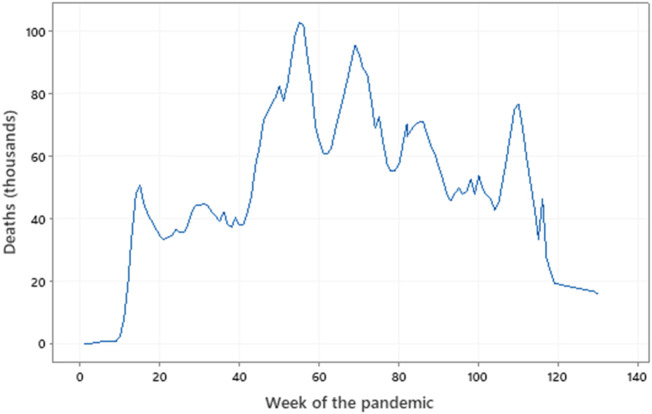
Global deaths throughout the pandemic. Data from the WHO (covid19.who-int). Week 0 = 6 January 2020, Week 60 = 22 February 2021, Week 120 = 18 April 2021. Several peaks and troughs are evident.
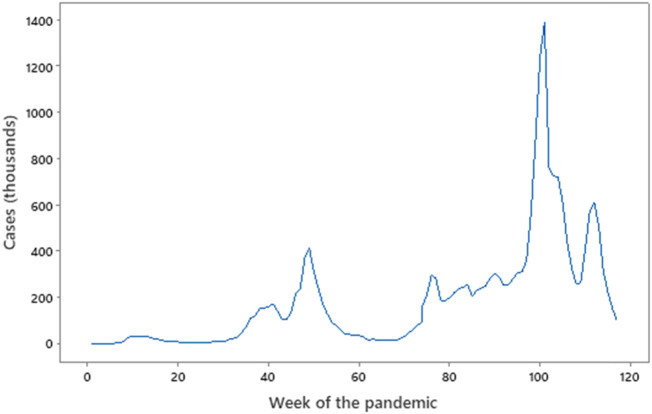
Cases vs. Week of the pandemic. Source: Office for National Statistics (http://ons.gov.uk ). Week 0 = 3 February 2020, Week 60 = 22 March 2021, Week 120 = 16 May 2022. Note the failure of the peaks to overlap in sequence with data in Figure 3, and the very minor peak of the first wave (week 10) compared to the peaks that follow. The three sub-waves from week 75 are clear.
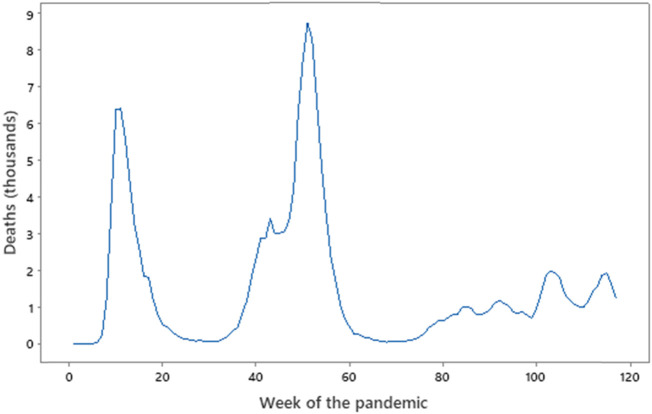
UK deaths vs. Week of the pandemic. Source: Office for National Statistics (http://ons.gov.uk ). Week 0 = 3 February 2020, Week 60 = 22 March 2021, Week 120 = 16 May 2022. Note the failure of the peaks to overlap in sequence with data in Figure 2. Deaths in the third wave from week 80 are small compared to waves one and two.
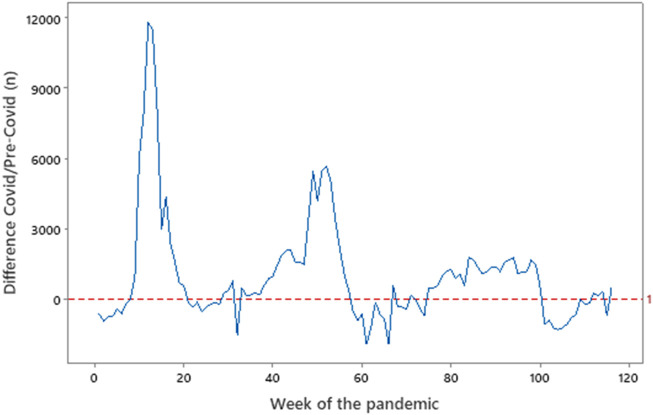
Deaths in England and Wales in the Covid vs. Pre-Covid periods. Source: Office for National Statistics (http://ons.gov.uk ), data from England and Wales. Week 0 = 3 February 2020, Week 60 = 22 March 2021, Week 120 = 16 May 2022. Where the line dips below zero, there were fewer Covid deaths in 2020–2021 than in 2015–2019.
References
-
- World Health Organisation. Covid-19 Dashboard (2019). https://www.who.int/emergencies/diseases/novel-coronavirus-2019 (Accessed May 12, 2022).
-
- World Health Organisation. World Health Organisation Report on the SARS-CoV-1 Outbreak (2015). https://www.who.int/publications/m/item/summary-of-probable-sars-cases-w... (Accessed May 12, 2022).
Publication types
MeSH terms
LinkOut - more resources
Full Text Sources
Medical
Miscellaneous