

Dysregulation and imbalance of innate and adaptive immunity are involved in the cardiomyopathy progression
- PMID: 36148059
- PMCID: PMC9485579
- DOI: 10.3389/fcvm.2022.973279
Dysregulation and imbalance of innate and adaptive immunity are involved in the cardiomyopathy progression
Abstract
Background: Cardiomyopathy is known to be a heterogeneous disease with numerous etiologies. They all have varying degrees and types of myocardial pathological changes, resulting in impaired contractility, ventricle relaxation, and heart failure. The purpose of this study was to determine the pathogenesis, immune-related pathways and important biomarkers engaged in the progression of cardiomyopathy from various etiologies.
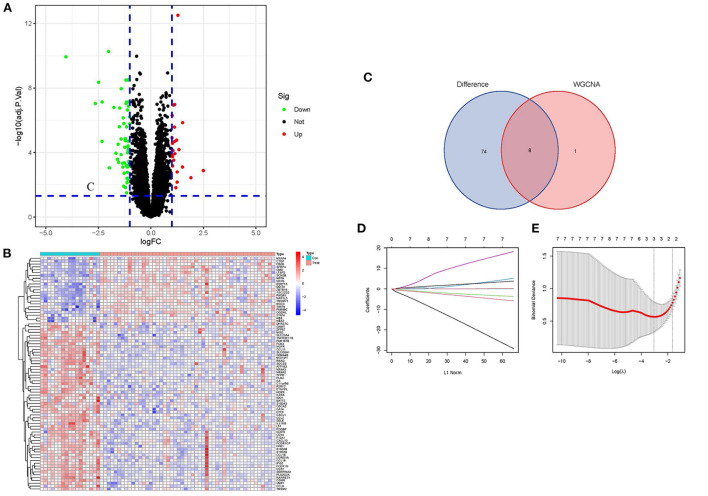
Methods: We downloaded the gene microarray data from the Gene Expression Omnibus (GEO). The hub genes between cardiomyopathy and non-cardiomyopathy control groups were identified using differential expression analysis, least absolute shrinkage and selection operator (LASSO) regression and weighted gene co-expression network analysis (WGCNA). To assess the diagnostic precision of hub genes, receiver-operating characteristic (ROC) curves as well as the area under the ROC curve (AUC) were utilized. Then, Kyoto Encyclopedia of Genes and Genomes (KEGG) enrichment pathway analysis and Gene Ontology (GO) analysis were conducted on the obtained differential genes. Finally, single-sample GSEA (ssGSEA) and Gene Set Enrichment Analysis (GSEA) were utilized to analyze the infiltration level of 28 immune cells and their relationship with hub genes based on gene expression profile data and all differential gene files.
Results: A total of 82 differentially expressed genes (DEGs) were screened after the training datasets were merged and intersected. The WGCNA analysis clustered the expression profile data into four co-expression modules, The turquoise module exhibited the strongest relationship with clinical traits, and nine candidate key genes were obtained from the module. Then we intersected DEGs with nine candidate genes. LASSO regression analysis identified the last three hub genes as promising biomarkers to distinguish the cardiomyopathy group from the non-cardiomyopathy control group. ROC curve analysis in the validation dataset revealed the sensitivity and accuracy of three hub genes as marker genes. The majority of the functional enrichment analysis results were concentrated on immunological and inflammatory pathways. Immune infiltration analysis revealed a significant correlation between regulatory T cells, type I helper T cells, macrophages, myeloid-derived suppressor cells, natural killer cells, activated dendritic cells and the abundance of immune infiltration in hub genes.
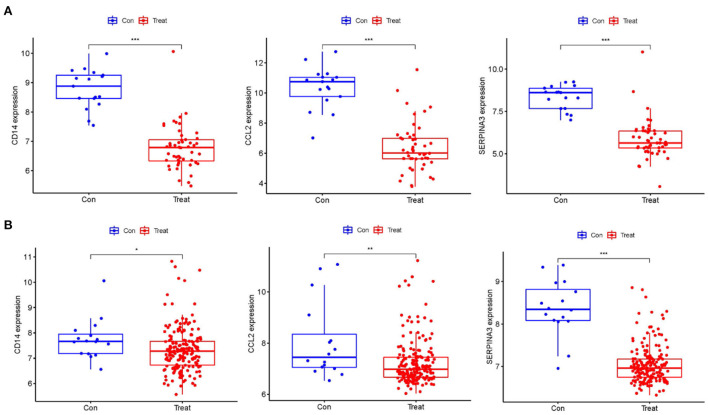
Conclusion: The hub genes (CD14, CCL2, and SERPINA3) can be used as markers to distinguish cardiomyopathy from non-cardiomyopathy individuals. Among them, SERPINA3 has the best diagnostic performance. T cell immunity (adaptive immune response) is closely linked to cardiomyopathy progression. Hub genes may protect the myocardium from injury through myeloid-derived suppressor cells, regulatory T cells, helper T cells, monocytes/macrophages, natural killer cells and activated dendritic cells. The innate immune response is crucial to this process. Dysregulation and imbalance of innate immune cells or activation of adaptive immune responses are involved in cardiomyopathy disease progression in patients.
Keywords: LASSO regression; biomarkers; cardiomyopathy; immune cell infiltration; weight gene co-expression network analysis (WGCNA).
Copyright © 2022 He, Quan, Cai, Yu, Yan, Wei, Zhang, Huang and Liu.
Conflict of interest statement
The authors declare that the research was conducted in the absence of any commercial or financial relationships that could be construed as a potential conflict of interest.
Figures


Similar articles
-
Identification of Hub Biomarkers and Immune-Related Pathways Participating in the Progression of Antineutrophil Cytoplasmic Antibody-Associated Glomerulonephritis.Front Immunol. 2022 Jan 5;12:809325. doi: 10.3389/fimmu.2021.809325. eCollection 2021. Front Immunol. 2022. PMID: 35069594 Free PMC article.
-
Comprehensive analysis to identify a novel diagnostic marker of lung adenocarcinoma and its immune infiltration landscape.Front Oncol. 2023 Jun 20;13:1199608. doi: 10.3389/fonc.2023.1199608. eCollection 2023. Front Oncol. 2023. PMID: 37409245 Free PMC article.
-
Identification of hub biomarkers and immune cell infiltration characteristics of polymyositis by bioinformatics analysis.Front Immunol. 2022 Sep 26;13:1002500. doi: 10.3389/fimmu.2022.1002500. eCollection 2022. Front Immunol. 2022. PMID: 36225941 Free PMC article.
-
Roles of the crucial mitochondrial DNA in hypertrophic cardiomyopathy prognosis and diagnosis: A review.Medicine (Baltimore). 2023 Dec 1;102(48):e36368. doi: 10.1097/MD.0000000000036368. Medicine (Baltimore). 2023. PMID: 38050313 Free PMC article. Review.
-
Extraction of Innate Immune Genes in Dairy Cattle and the Regulation of Their Expression in Early Embryos.Genes (Basel). 2024 Mar 18;15(3):372. doi: 10.3390/genes15030372. Genes (Basel). 2024. PMID: 38540431 Free PMC article. Review.
Cited by
-
Co-infections during SARS-CoV-2 infection in hematologic patients and cell therapy recipients in the omicron era: a Spanish hematopoietic stem cell transplantation and cell therapy group study.BMC Infect Dis. 2025 Jul 25;25(1):944. doi: 10.1186/s12879-025-11302-w. BMC Infect Dis. 2025. PMID: 40713537 Free PMC article.
-
CD4+ T Cell Subsets and PTPN22 as Novel Biomarkers of Immune Dysregulation in Dilated Cardiomyopathy.Int J Mol Sci. 2025 Aug 13;26(16):7806. doi: 10.3390/ijms26167806. Int J Mol Sci. 2025. PMID: 40869128 Free PMC article.
-
Targeting ERBB2 and PIK3R1 as a therapeutic strategy for dilated cardiomyopathy: A single-cell sequencing and mendelian randomization analysis.Heliyon. 2024 Feb 13;10(5):e25572. doi: 10.1016/j.heliyon.2024.e25572. eCollection 2024 Mar 15. Heliyon. 2024. PMID: 38434379 Free PMC article.
-
The let-7b-5p, miR-326, and miR-125a-3p are associated with left ventricular systolic dysfunction in post-myocardial infarction.Front Cardiovasc Med. 2023 May 12;10:1151855. doi: 10.3389/fcvm.2023.1151855. eCollection 2023. Front Cardiovasc Med. 2023. PMID: 37252118 Free PMC article.
-
Indirect Myocardial Injury in Polytrauma: Mechanistic Pathways and the Clinical Utility of Immunological Markers.J Cardiovasc Dev Dis. 2025 Jul 14;12(7):268. doi: 10.3390/jcdd12070268. J Cardiovasc Dev Dis. 2025. PMID: 40710793 Free PMC article. Review.
References
-
- Elliott P, Andersson B, Arbustini E, Bilinska Z, Cecchi F, Charron P, et al. . Classification of the cardiomyopathies: a position statement from the European Society Of Cardiology Working Group on Myocardial and Pericardial Diseases. Eur Heart J. (2008) 29:270–6. 10.1093/eurheartj/ehm342 - DOI - PubMed
LinkOut - more resources
Full Text Sources
Research Materials
Miscellaneous