

Going beyond the DSM in predicting, diagnosing, and treating autism spectrum disorder with covarying alexithymia and OCD: A structural equation model and process-based predictive coding account
- PMID: 36148114
- PMCID: PMC9485626
- DOI: 10.3389/fpsyg.2022.993381
Going beyond the DSM in predicting, diagnosing, and treating autism spectrum disorder with covarying alexithymia and OCD: A structural equation model and process-based predictive coding account
Abstract
Background: There is much overlap among the symptomology of autistic spectrum disorders (ASDs), obsessive compulsive disorders (OCDs), and alexithymia, which all typically involve impaired social interactions, repetitive impulsive behaviors, problems with communication, and mental health.
Aim: This study aimed to identify direct and indirect associations among alexithymia, OCD, cardiac interoception, psychological inflexibility, and self-as-context, with the DV ASD and depression, while controlling for vagal related aging.
Methodology: The data involved electrocardiogram (ECG) heart rate variability (HRV) and questionnaire data. In total, 1,089 participant's data of ECG recordings of healthy resting state HRV were recorded and grouped into age categories. In addition to this, another 224 participants completed an online survey that included the following questionnaires: Yale-Brown Obsessive Compulsive Scale (Y-BOCS); Toronto Alexithymia Scale 20 (TAS-20); Acceptance and Action Questionnaire (AAQII); Depression, Anxiety, and Stress Scale 21 (DAS21); Multi-dimensional Assessment of Interoceptive Awareness Scale (MAIA); and the Self-as-Context Scale (SAC).
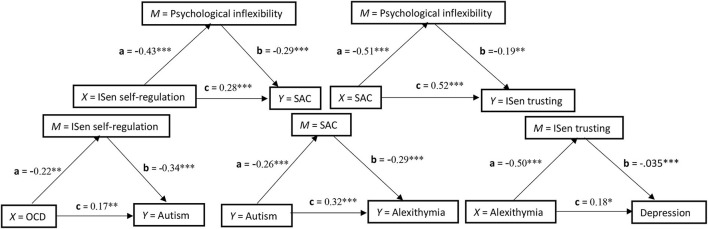
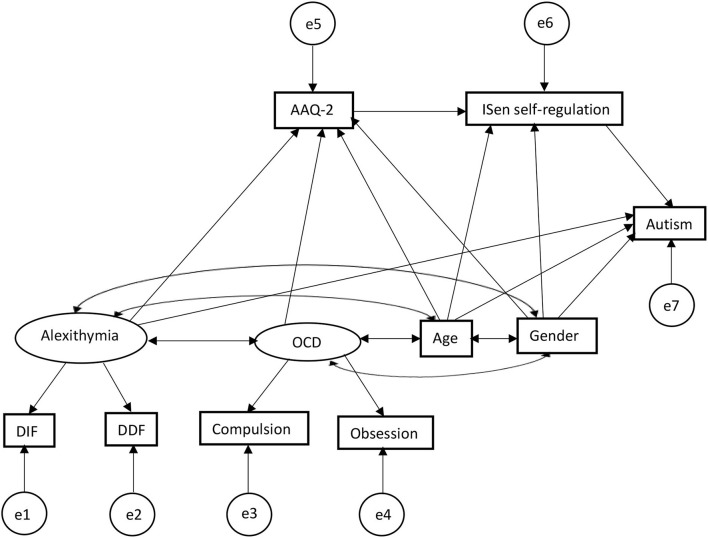
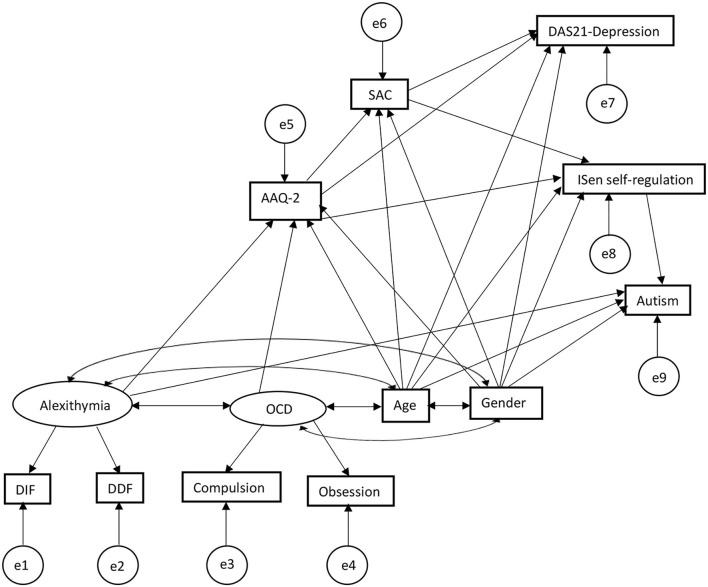
Results: Heart rate variability was shown to decrease with age when controlling for BMI and gender. In the two SEMs produced, it was found that OCD and alexithymia were causally associated with autism and depression indirectly through psychological inflexibility, SAC, and ISen interoception.
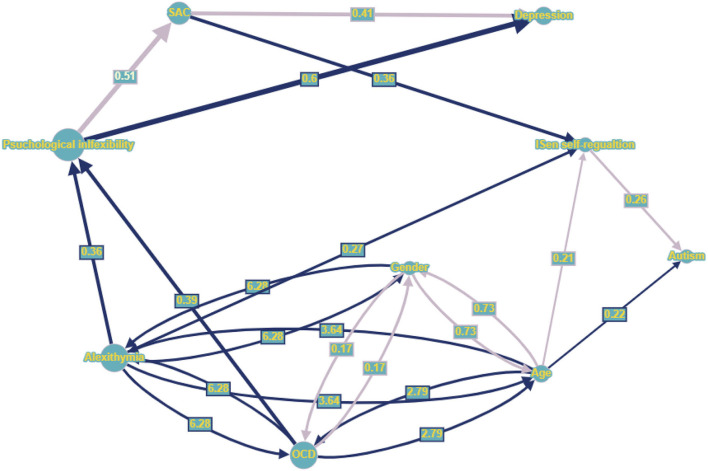
Conclusion: The results are discussed in relation to the limitations of the DSM with its categorical focus of protocols for syndromes and provide support for more flexible ideographic approaches in diagnosing and treating mental health and autism within the Extended Evolutionary Meta-Model (EEMM). Graph theory approaches are discussed in their capacity to depict the processes of change potentially even at the level of the relational frame.
Keywords: alexithymia; autism (ASD); graph theory; obsessive-compulsive disorder (OCD); psychological flexibility; structural equation model (SEM).
Copyright © 2022 Edwards.
Conflict of interest statement
The author declares that the research was conducted in the absence of any commercial or financial relationships that could be construed as a potential conflict of interest.
Figures
Similar articles
-
Associations Between Mental Health, Interoception, Psychological Flexibility, and Self-as-Context, as Predictors for Alexithymia: A Deep Artificial Neural Network Approach.Front Psychol. 2021 Mar 24;12:637802. doi: 10.3389/fpsyg.2021.637802. eCollection 2021. Front Psychol. 2021. PMID: 33868110 Free PMC article.
-
Overlap of obsessive-compulsive personality disorder and autism spectrum disorder traits among OCD outpatients: an exploratory study.Int J Psychiatry Clin Pract. 2019 Nov;23(4):297-306. doi: 10.1080/13651501.2019.1638939. Epub 2019 Aug 2. Int J Psychiatry Clin Pract. 2019. PMID: 31375037
-
Autism spectrum disorders in adult outpatients with obsessive compulsive disorder in the UK.Int J Psychiatry Clin Pract. 2018 Mar;22(1):54-62. doi: 10.1080/13651501.2017.1354029. Epub 2017 Aug 11. Int J Psychiatry Clin Pract. 2018. PMID: 28705096
-
[Current and emerging features of obsessive-compulsive disorder--trends for the revision of DSM-5].Seishin Shinkeigaku Zasshi. 2012;114(9):1023-30. Seishin Shinkeigaku Zasshi. 2012. PMID: 23198591 Review. Japanese.
-
Anxiety Disorders and Obsessive-Compulsive Disorder in Individuals with Autism Spectrum Disorder.Curr Psychiatry Rep. 2017 Oct 30;19(12):92. doi: 10.1007/s11920-017-0846-y. Curr Psychiatry Rep. 2017. PMID: 29082426 Free PMC article. Review.
Cited by
-
A functional contextual, observer-centric, quantum mechanical, and neuro-symbolic approach to solving the alignment problem of artificial general intelligence: safe AI through intersecting computational psychological neuroscience and LLM architecture for emergent theory of mind.Front Comput Neurosci. 2024 Aug 8;18:1395901. doi: 10.3389/fncom.2024.1395901. eCollection 2024. Front Comput Neurosci. 2024. PMID: 39175519 Free PMC article.
-
Interoceptive awareness in a clinical setting: the need to bring interoceptive perspectives into clinical evaluation.Front Psychol. 2024 Jun 12;15:1244701. doi: 10.3389/fpsyg.2024.1244701. eCollection 2024. Front Psychol. 2024. PMID: 38933585 Free PMC article. Review.
-
Systematic Review: Convergence and Divergence Between Autism Spectrum Disorder and Obsessive-Compulsive Disorder: Genetic, Neuroimaging, and Cognitive Findings.J Am Acad Child Adolesc Psychiatry. 2025 Jun 25:S0890-8567(25)00312-0. doi: 10.1016/j.jaac.2025.06.017. Online ahead of print. J Am Acad Child Adolesc Psychiatry. 2025. PMID: 40578755 Review.
-
Effects of manual osteopathic interventions on psychometric and psychophysiological indicators of anxiety, depression and stress in adults: a systematic review and meta-analysis of randomised controlled trials.BMJ Open. 2025 Feb 7;15(2):e095933. doi: 10.1136/bmjopen-2024-095933. BMJ Open. 2025. PMID: 39920074 Free PMC article.
References
-
- Akaike H. (1974). A new look at the statistical model identification. IEEE Trans. Automat. Contr. 19, 716–723. 10.1109/TAC.1974.1100705 - DOI
-
- Allison C., Auyeung B., Baron-Cohen S. (2012). Toward brief “red flags” for autism screening: the short autism spectrum quotient and the short quantitative checklist in 1,000 cases and 3,000 controls. J. Am. Acad. Child Adolesc. Psychiatry. 51, 202–212. e207. 10.1016/j.jaac.2011.11.003 - DOI - PubMed
-
- American Psychiatric Association (2013a). Diagnostic and Statistical Manual of Mental Disorders: DSM-5, Vol. 5. Washington, DC: American Psychiatric Association.
LinkOut - more resources
Full Text Sources