

A comprehensively prognostic and immunological analysis of actin-related protein 2/3 complex subunit 5 in pan-cancer and identification in hepatocellular carcinoma
- PMID: 36148220
- PMCID: PMC9485570
- DOI: 10.3389/fimmu.2022.944898
A comprehensively prognostic and immunological analysis of actin-related protein 2/3 complex subunit 5 in pan-cancer and identification in hepatocellular carcinoma
Erratum in
-
Corrigendum: A comprehensively prognostic and immunological analysis of actin-related protein 2/3 complex subunit 5 in pan-cancer and identification in hepatocellular carcinoma.Front Immunol. 2022 Oct 17;13:1047151. doi: 10.3389/fimmu.2022.1047151. eCollection 2022. Front Immunol. 2022. PMID: 36325327 Free PMC article.
Abstract
Background: Actin-related protein 2/3 complex subunit 5 (ARPC5) is one of the members of actin-related protein 2/3 complex and plays an important role in cell migration and invasion. However, little is known about the expression pattern, prognosis value, and biological function of ARPC5 in pan-cancer. Thus, we focus on ARPC5 as cut point to explore a novel prognostic and immunological biomarker for cancers.
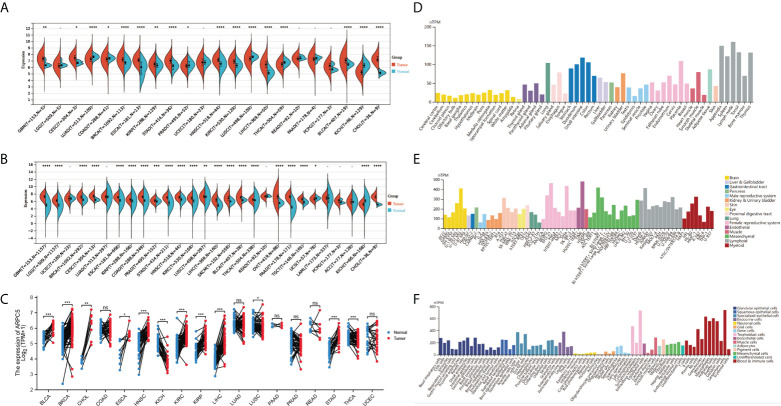
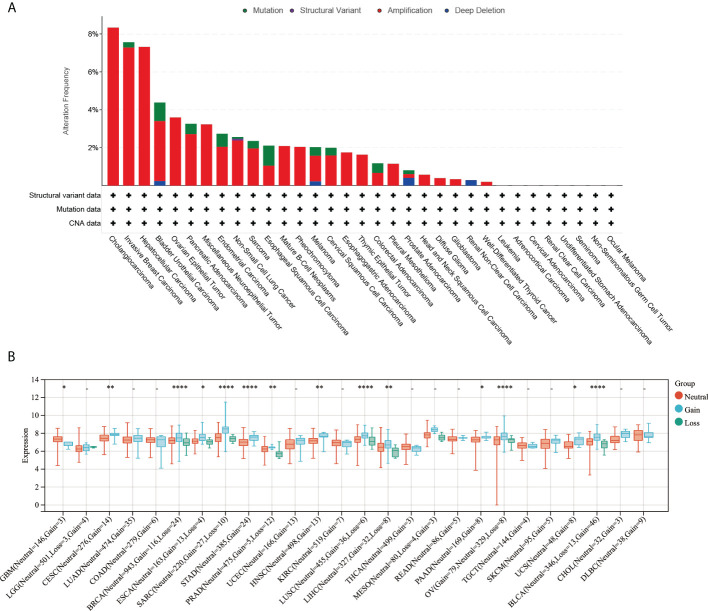
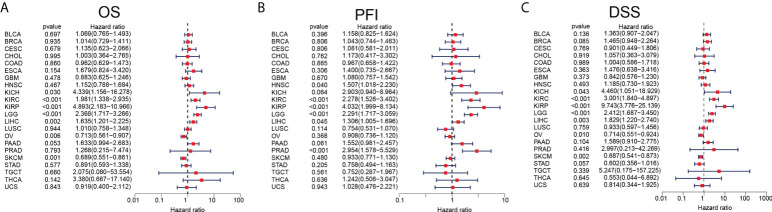
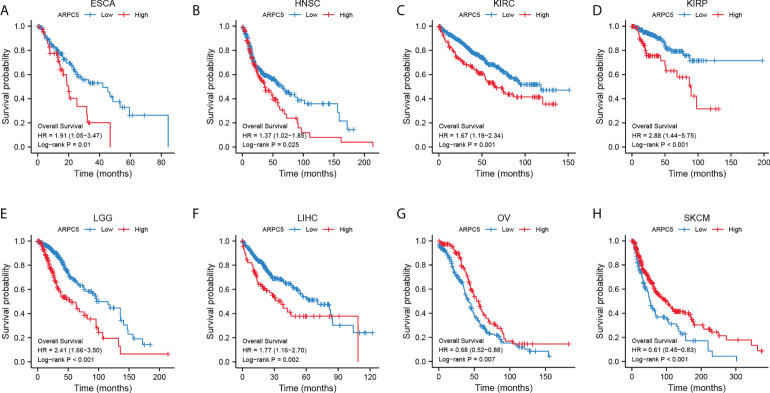
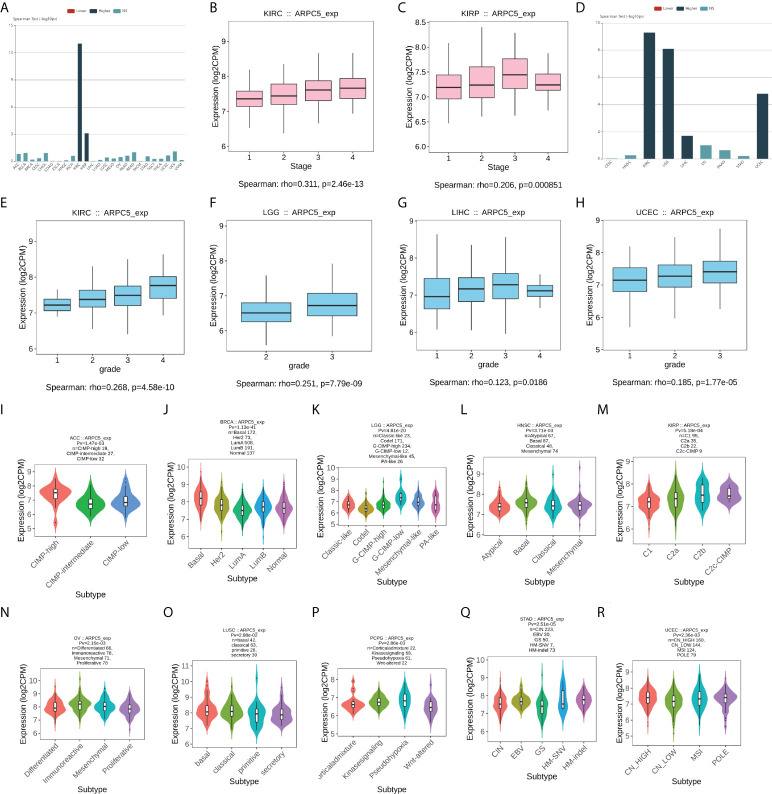
Methods: The public databases, including TCGA, GTEx, and UCEC, were used to analyze ARPC5 expression in pan-cancer. The Human Protein Atlas website was applied to obtain the expression of ARPC5 in different tissues, cell lines, and single-cell types. Univariate Cox regression analysis and Kaplan-Meier analysis were used to explore the prognosis value of ARPC5 in various cancers. Spearman's correlation analysis was performed to investigate the association between ARPC5 expression and tumor microenvironment scores, immune cell infiltration, immune-related genes, TMB, MSI, RNA modification genes, DNA methyltransferases, and tumor stemness. Moreover, qPCR, Western blot, and immunohistochemistry were carried out to examine the differential expression of ARPC5 in HCC tissues and cell lines. CCK8, EdU, flow cytometry, wound-healing assays, and transwell assays were conducted to explore its role in tumor proliferation, apoptosis, migration, and invasion among HCC cells.
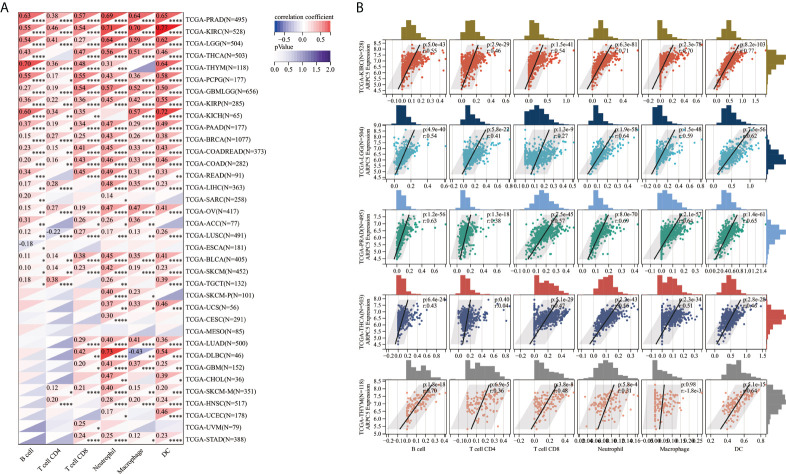
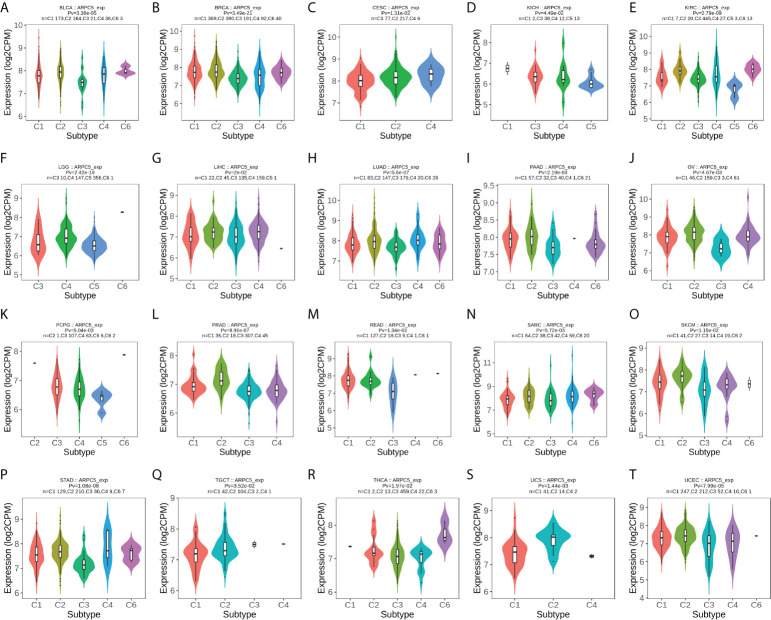
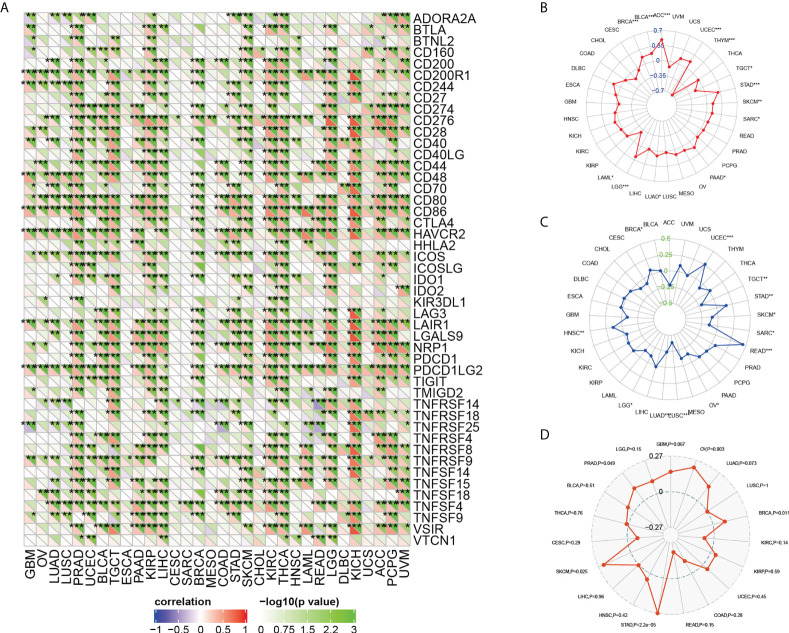
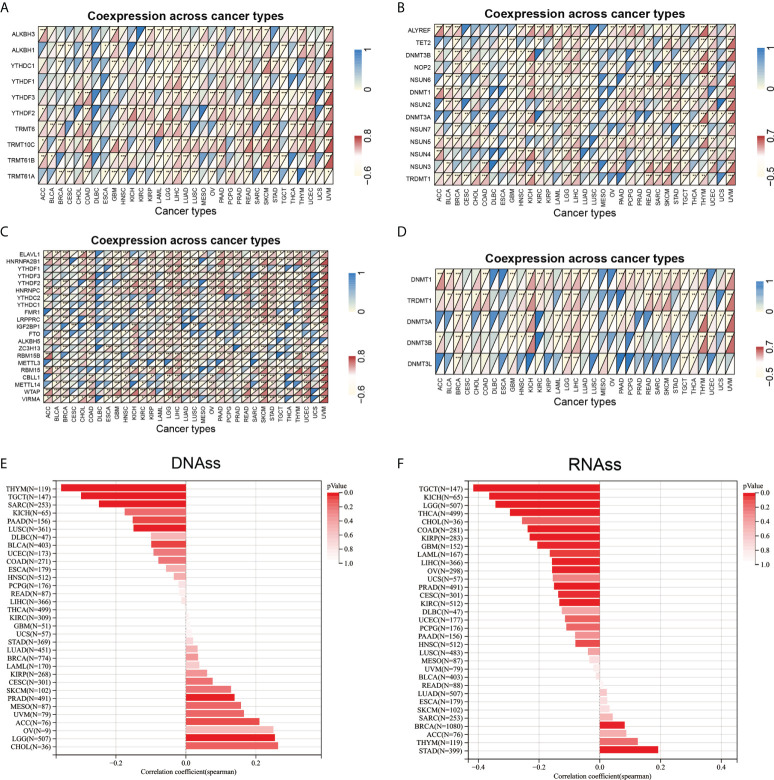
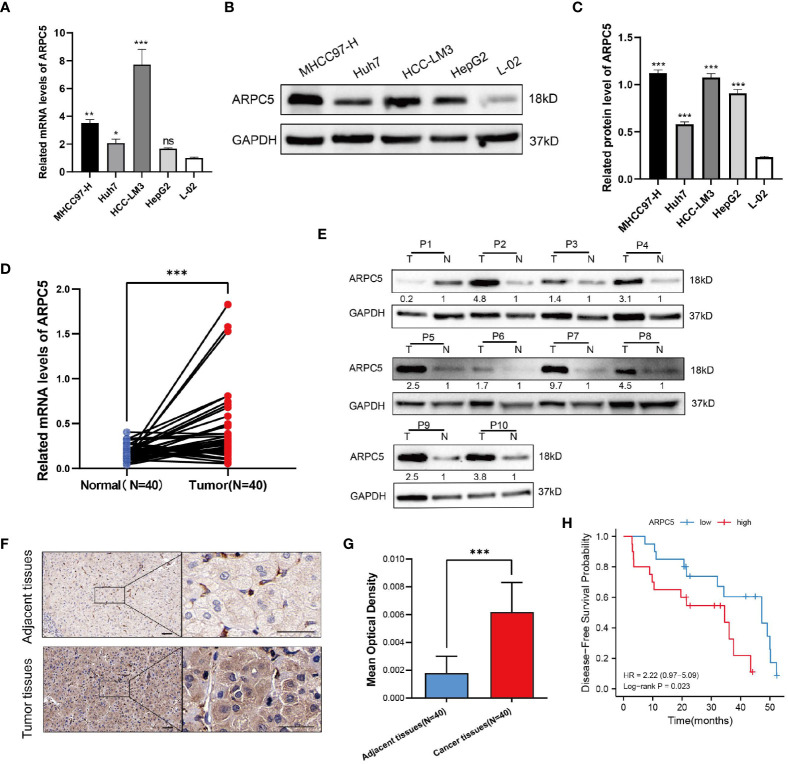
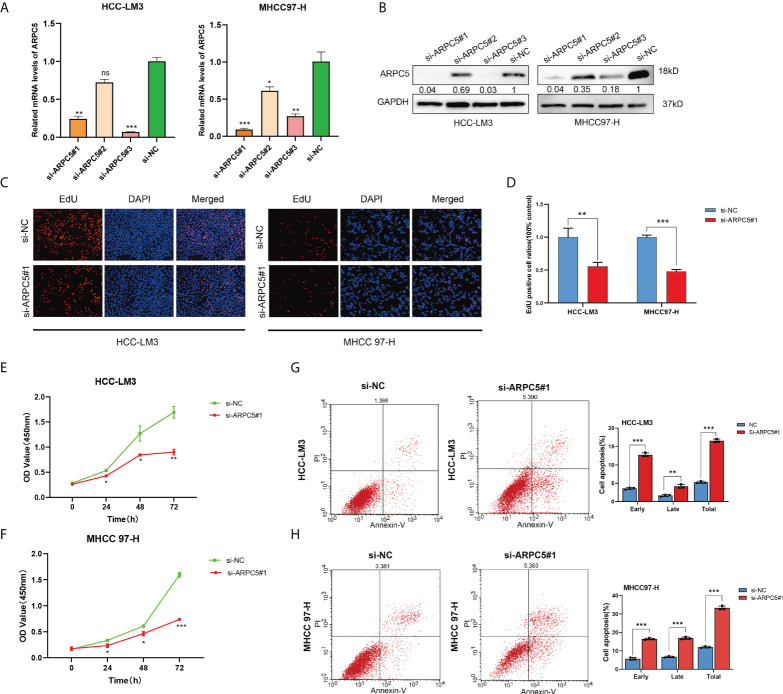
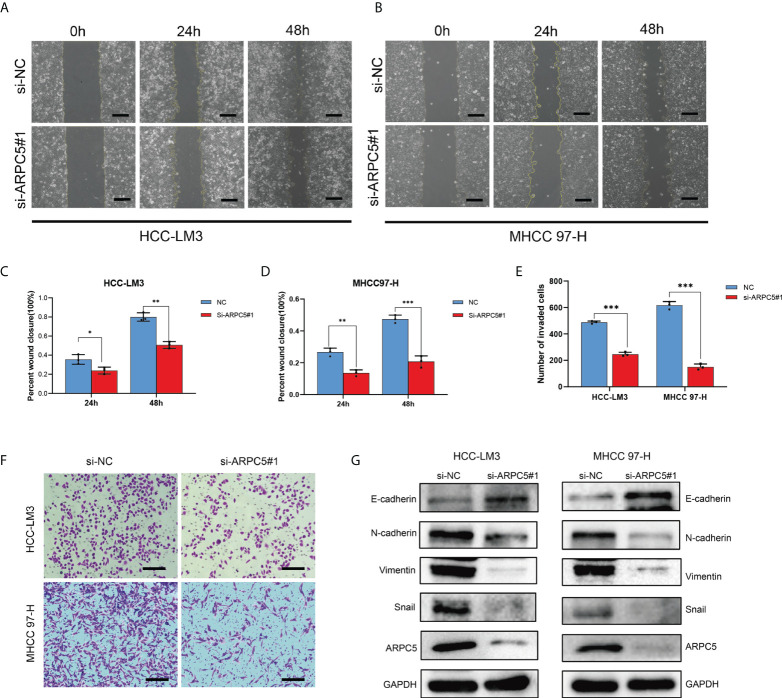
Results: ARPC5 expression was upregulated in most cancer types and significantly associated with worse prognosis in KIRC, KIRP, LGG, and LIHC. mRNA expression of ARPC5 showed low tissue and cell specificity in normal tissues, cell lines, and single-cell types. ARPC5 expression was positively correlated with the tumor microenvironment scores, immune infiltrating cells, immune checkpoint-related genes in most cancers. ARPC5 in STAD and BRCA was positively associated with TMB, MSI, and neoantigens. We also discovered that ARPC5 was correlated with the expression of m1A-related genes, m5C-related genes, m6A-related genes, and DNA methyltransferases. In experiment analyses, we found that ARPC5 was significantly highly expressed in HCC tissues and HCC cells. Functionally, silencing ARPC5 dramatically decreased proliferation, migration, and invasion ability of HCC cells.
Conclusions: ARPC5 expression affects the prognosis of multiple tumors and is closely correlated to tumor immune infiltration and immunotherapy. Furthermore, ARPC5 may function as an oncogene and promote tumor progression in HCC.
Keywords: ARPC5; biomarker; hepatocellular carcinoma; immune; pan-cancer; prognosis.
Copyright © 2022 Huang, Sun, Hou, Liu and Wu.
Conflict of interest statement
The authors declare that the research was conducted in the absence of any commercial or financial relationships that could be construed as a potential conflict of interest.
Figures
Similar articles
-
Comprehensively prognostic and immunological analysis of VRK Serine/Threonine Kinase 1 in pan-cancer and identification in hepatocellular carcinoma.Aging (Albany NY). 2023 Dec 28;15(24):15504-15524. doi: 10.18632/aging.205389. Epub 2023 Dec 28. Aging (Albany NY). 2023. PMID: 38157278 Free PMC article.
-
ARPC2: A Pan-Cancer Prognostic and Immunological Biomarker That Promotes Hepatocellular Carcinoma Cell Proliferation and Invasion.Front Cell Dev Biol. 2022 Jun 6;10:896080. doi: 10.3389/fcell.2022.896080. eCollection 2022. Front Cell Dev Biol. 2022. PMID: 35733852 Free PMC article.
-
ARPC5 acts as a potential prognostic biomarker that is associated with cell proliferation, migration and immune infiltrate in gliomas.BMC Cancer. 2023 Oct 3;23(1):937. doi: 10.1186/s12885-023-11433-w. BMC Cancer. 2023. PMID: 37789267 Free PMC article.
-
Pan-cancer analysis of the prognostic and immunological role of GJB2: a potential target for survival and immunotherapy.Front Oncol. 2023 Jun 23;13:1110207. doi: 10.3389/fonc.2023.1110207. eCollection 2023. Front Oncol. 2023. PMID: 37427102 Free PMC article. Review.
-
Non-coding RNA methylation modifications in hepatocellular carcinoma: interactions and potential implications.Cell Commun Signal. 2023 Dec 18;21(1):359. doi: 10.1186/s12964-023-01357-0. Cell Commun Signal. 2023. PMID: 38111040 Free PMC article. Review.
Cited by
-
Proteomics of adjacent-to-tumor samples uncovers clinically relevant biological events in hepatocellular carcinoma.Natl Sci Rev. 2023 Jun 2;10(8):nwad167. doi: 10.1093/nsr/nwad167. eCollection 2023 Aug. Natl Sci Rev. 2023. PMID: 37575948 Free PMC article.
-
Alterations of lipid-related genes during anti-tuberculosis treatment: insights into host immune responses and potential transcriptional biomarkers.Front Immunol. 2023 Oct 31;14:1210372. doi: 10.3389/fimmu.2023.1210372. eCollection 2023. Front Immunol. 2023. PMID: 38022579 Free PMC article.
-
Multi-omics analysis reveals the involvement of origin recognition complex subunit 6 in tumor immune regulation and malignant progression.Front Immunol. 2023 Oct 12;14:1236806. doi: 10.3389/fimmu.2023.1236806. eCollection 2023. Front Immunol. 2023. PMID: 37901236 Free PMC article.
-
Analysis and validation of the potential of the MYO1E gene in pancreatic adenocarcinoma based on a bioinformatics approach.Oncol Lett. 2023 May 19;26(1):285. doi: 10.3892/ol.2023.13871. eCollection 2023 Jul. Oncol Lett. 2023. PMID: 37274465 Free PMC article.
-
Elevated Fcy receptor expression augments pro-inflammatory macrophage phagocytosis in systemic sclerosis and associated rheumatic diseases.Rheumatology (Oxford). 2025 Jun 1;64(6):3975-3988. doi: 10.1093/rheumatology/keae688. Rheumatology (Oxford). 2025. PMID: 39672802 Free PMC article.
References
-
- Laurila E, Savinainen K, Kuuselo R, Karhu R, Kallioniemi A. Characterization of the 7q21-q22 amplicon identifies ARPC1A, a subunit of the Arp2/3 complex, as a regulator of cell migration and invasion in pancreatic cancer. Genes Chromosomes Cancer (2009) 48(4):330–9. doi: 10.1002/gcc.20643 - DOI - PubMed
Publication types
MeSH terms
Substances
LinkOut - more resources
Full Text Sources
Medical