

Oral N-acetylcysteine decreases IFN-γ production and ameliorates ischemia-reperfusion injury in steatotic livers
- PMID: 36148239
- PMCID: PMC9486542
- DOI: 10.3389/fimmu.2022.898799
Oral N-acetylcysteine decreases IFN-γ production and ameliorates ischemia-reperfusion injury in steatotic livers
Abstract
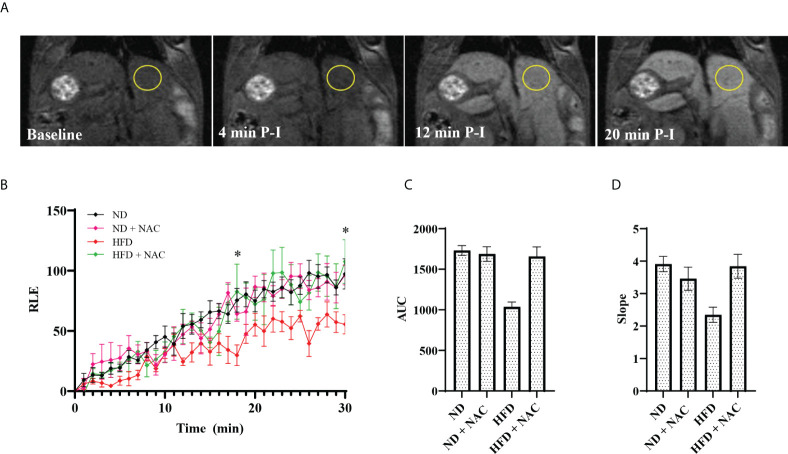
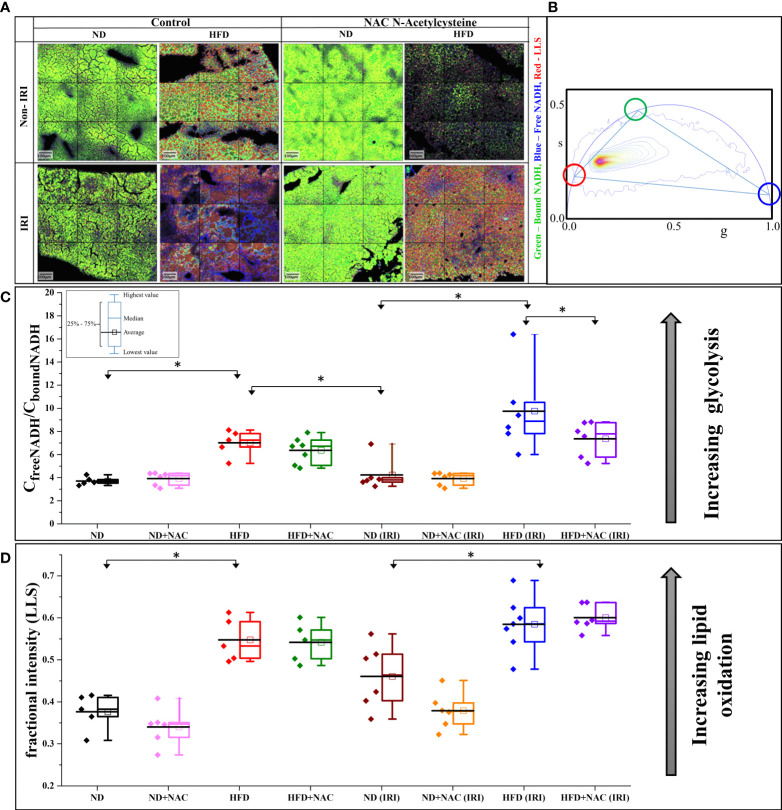
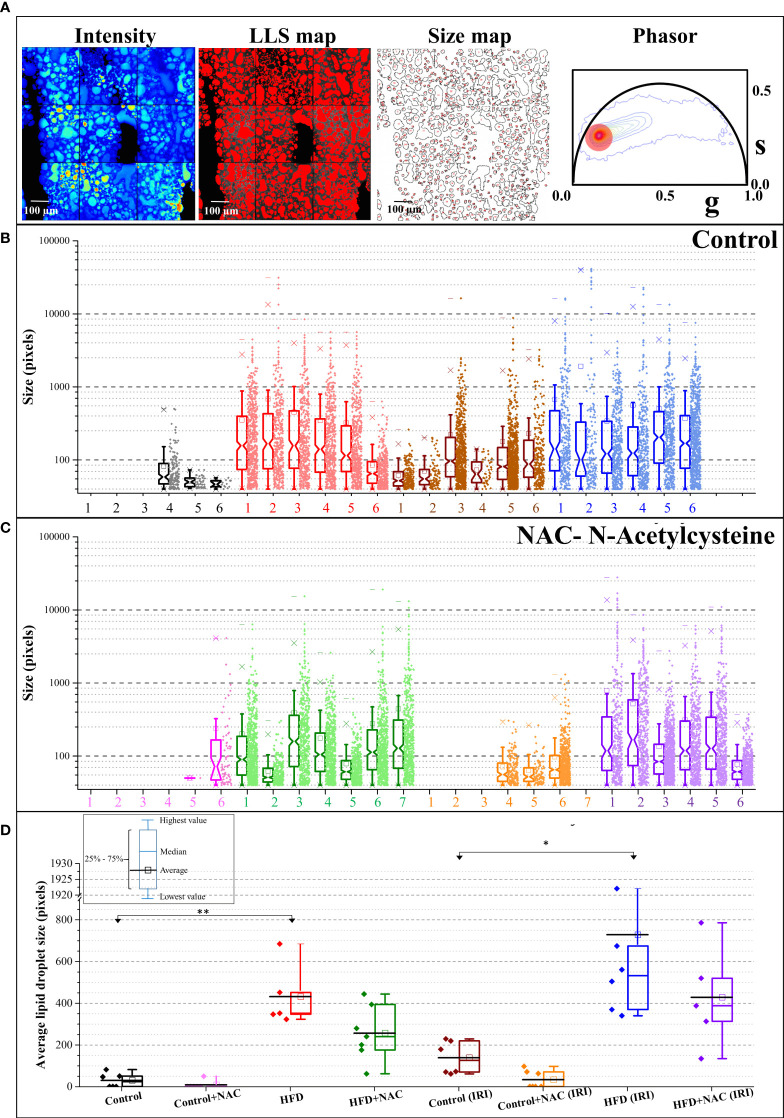
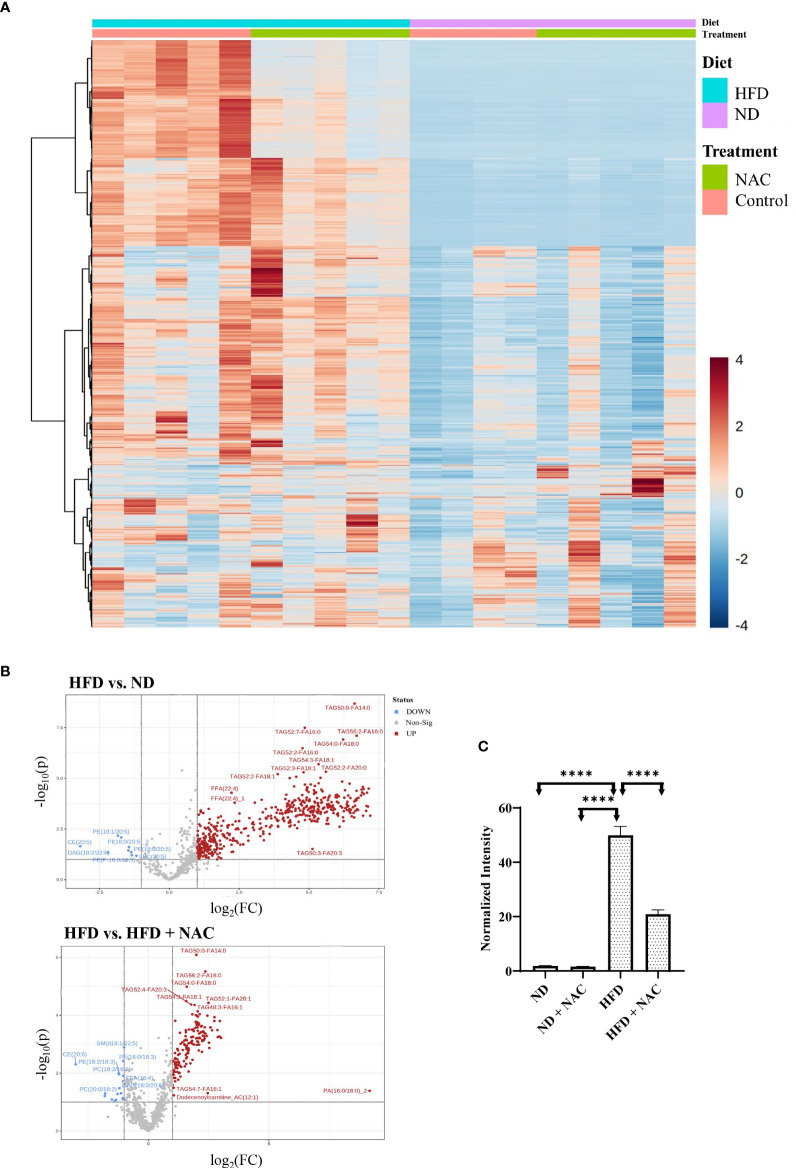
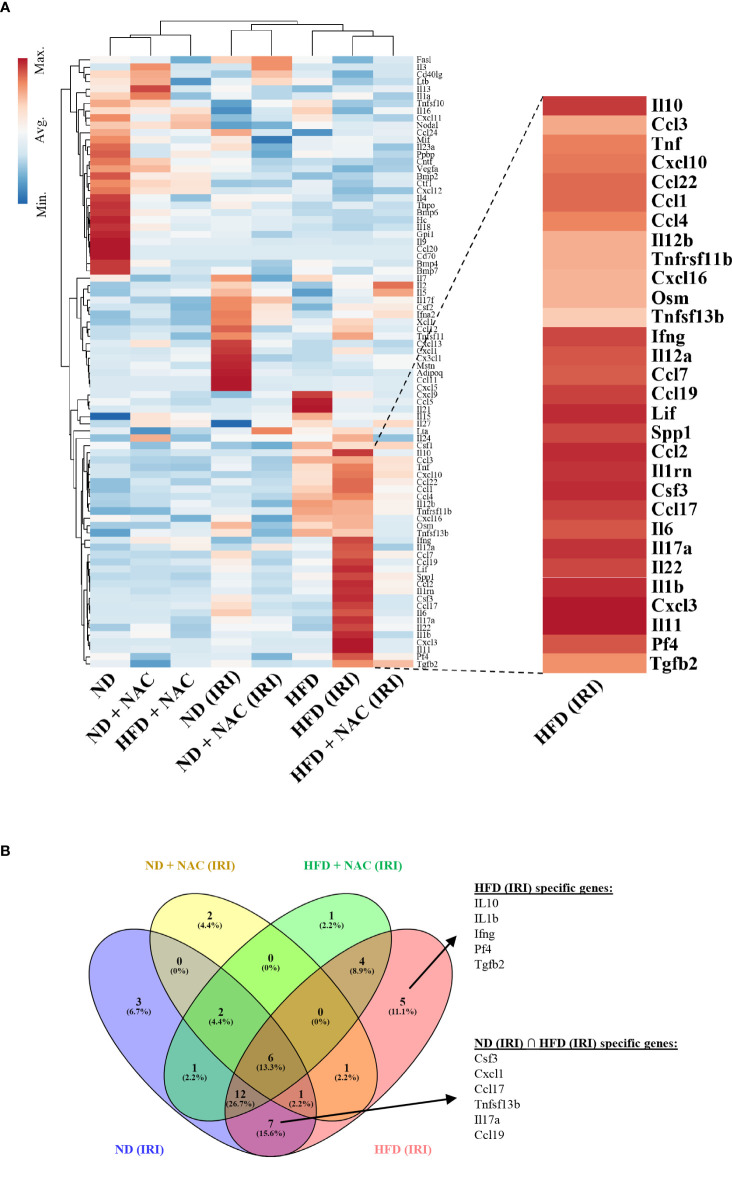
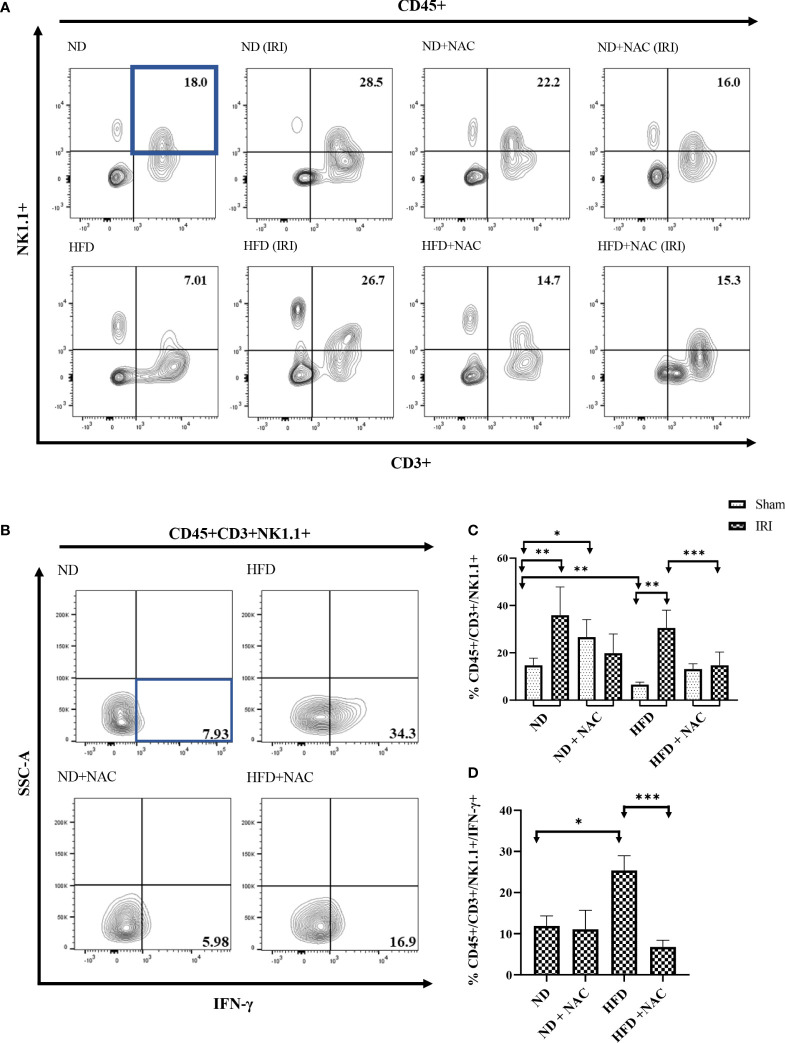
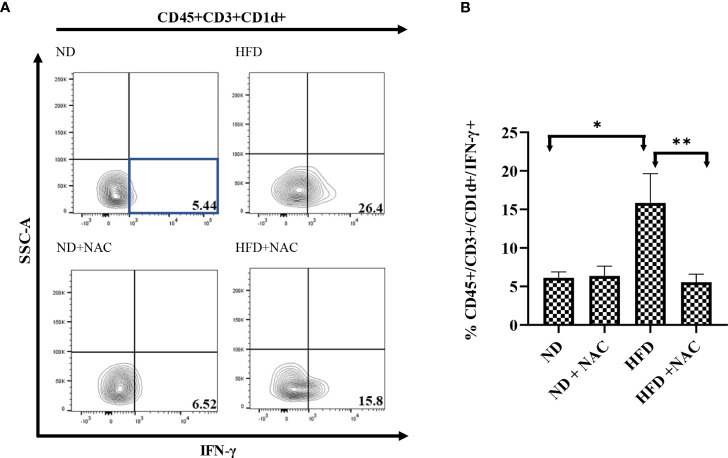
Type 1 Natural Killer T-cells (NKT1 cells) play a critical role in mediating hepatic ischemia-reperfusion injury (IRI). Although hepatic steatosis is a major risk factor for preservation type injury, how NKT cells impact this is understudied. Given NKT1 cell activation by phospholipid ligands recognized presented by CD1d, we hypothesized that NKT1 cells are key modulators of hepatic IRI because of the increased frequency of activating ligands in the setting of hepatic steatosis. We first demonstrate that IRI is exacerbated by a high-fat diet (HFD) in experimental murine models of warm partial ischemia. This is evident in the evaluation of ALT levels and Phasor-Fluorescence Lifetime (Phasor-FLIM) Imaging for glycolytic stress. Polychromatic flow cytometry identified pronounced increases in CD45+CD3+NK1.1+NKT1 cells in HFD fed mice when compared to mice fed a normal diet (ND). This observation is further extended to IRI, measuring ex vivo cytokine expression in the HFD and ND. Much higher interferon-gamma (IFN-γ) expression is noted in the HFD mice after IRI. We further tested our hypothesis by performing a lipidomic analysis of hepatic tissue and compared this to Phasor-FLIM imaging using "long lifetime species", a byproduct of lipid oxidation. There are higher levels of triacylglycerols and phospholipids in HFD mice. Since N-acetylcysteine (NAC) is able to limit hepatic steatosis, we tested how oral NAC supplementation in HFD mice impacted IRI. Interestingly, oral NAC supplementation in HFD mice results in improved hepatic enhancement using contrast-enhanced magnetic resonance imaging (MRI) compared to HFD control mice and normalization of glycolysis demonstrated by Phasor-FLIM imaging. This correlated with improved biochemical serum levels and a decrease in IFN-γ expression at a tissue level and from CD45+CD3+CD1d+ cells. Lipidomic evaluation of tissue in the HFD+NAC mice demonstrated a drastic decrease in triacylglycerol, suggesting downregulation of the PPAR-γ pathway.
Keywords: IFN-gamma; N-acetylcysteine (NAC); NKT (natural killer T) cell; gadoxetate disodium; hepatic steatosis; ischemia-reperfusion injury (IRI); liver transplantation; phasor-FLIM.
Copyright © 2022 Liggett, Kang, Ranjit, Rodriguez, Loh, Patil, Cui, Duttargi, Nguyen, He, Lee, Oza, Frank, Kwon, Li, Kallakury, Libby, Levi, Robson, Fishbein, Cui, Albanese, Khan and Kroemer.
Conflict of interest statement
Georgetown University filed a patent related to this manuscript. KK, WC, and AK are named as inventors on this application and declare that as a potential conflict of interest. The remaining authors declare that the research was conducted in the absence of any commercial or financial relationships that could be construed as a potential conflict of interest.
Figures

Similar articles
-
Type 1 Innate Lymphoid Cells Are Proinflammatory Effector Cells in Ischemia-Reperfusion Injury of Steatotic Livers.Front Immunol. 2022 Jun 27;13:899525. doi: 10.3389/fimmu.2022.899525. eCollection 2022. Front Immunol. 2022. PMID: 35833123 Free PMC article.
-
CXCR6 deficiency ameliorates ischemia-reperfusion injury by reducing the recruitment and cytokine production of hepatic NKT cells in a mouse model of non-alcoholic fatty liver disease.Int Immunopharmacol. 2019 Jul;72:224-234. doi: 10.1016/j.intimp.2019.04.021. Epub 2019 Apr 16. Int Immunopharmacol. 2019. PMID: 31002999
-
Short-term therapy with peroxisome proliferation-activator receptor-alpha agonist Wy-14,643 protects murine fatty liver against ischemia-reperfusion injury.Hepatology. 2010 Mar;51(3):996-1006. doi: 10.1002/hep.23420. Hepatology. 2010. PMID: 20131406
-
Pathophysiological Changes During Ischemia-reperfusion Injury in Rodent Hepatic Steatosis.In Vivo. 2020 May-Jun;34(3):953-964. doi: 10.21873/invivo.11863. In Vivo. 2020. PMID: 32354880 Free PMC article. Review.
-
Updates on the Immune Cell Basis of Hepatic Ischemia-Reperfusion Injury.Mol Cells. 2023 Sep 30;46(9):527-534. doi: 10.14348/molcells.2023.0099. Epub 2023 Aug 22. Mol Cells. 2023. PMID: 37691258 Free PMC article. Review.
Cited by
-
Fluorescence Lifetime Nanoscopy of Liposomal Irinotecan Onivyde: From Manufacturing to Intracellular Processing.ACS Appl Bio Mater. 2023 Oct 16;6(10):4277-4289. doi: 10.1021/acsabm.3c00478. Epub 2023 Sep 12. ACS Appl Bio Mater. 2023. PMID: 37699572 Free PMC article.
-
Interferon-α stimulates DExH-box helicase 58 to prevent hepatocyte ferroptosis.Mil Med Res. 2024 Apr 15;11(1):22. doi: 10.1186/s40779-024-00524-9. Mil Med Res. 2024. PMID: 38622688 Free PMC article.
-
Precision sirolimus dosing in children: The potential for model-informed dosing and novel drug monitoring.Front Pharmacol. 2023 Mar 20;14:1126981. doi: 10.3389/fphar.2023.1126981. eCollection 2023. Front Pharmacol. 2023. PMID: 37021042 Free PMC article. Review.
-
Enhancing Cardiomyocyte Resilience to Ischemia-Reperfusion Injury: The Therapeutic Potential of an Indole-Peptide-Tempo Conjugate (IPTC).ACS Omega. 2024 Sep 13;9(38):39401-39418. doi: 10.1021/acsomega.4c02725. eCollection 2024 Sep 24. ACS Omega. 2024. PMID: 39346824 Free PMC article.
-
Comprehensive transcriptomic analysis and meta-analysis identify therapeutic effects of N-acetylcysteine in nonalcoholic fatty liver disease.Front Pharmacol. 2023 May 15;14:1186582. doi: 10.3389/fphar.2023.1186582. eCollection 2023. Front Pharmacol. 2023. PMID: 37256235 Free PMC article.
References
-
- Ranjit S, Dobrinskikh E, Montford J, Dvornikov A, Lehman A, Orlicky DJ, et al. . Label-free fluorescence lifetime and second harmonic generation imaging microscopy improves quantification of experimental renal fibrosis. Kidney Int (2016) 90(5):1123–8. doi: 10.1016/j.kint.2016.06.030 - DOI - PMC - PubMed
Publication types
MeSH terms
Substances
Grants and funding
LinkOut - more resources
Full Text Sources
Molecular Biology Databases
Research Materials
Miscellaneous