

Resetting the circadian clock of Alzheimer's mice via GLP-1 injection combined with time-restricted feeding
- PMID: 36148311
- PMCID: PMC9487156
- DOI: 10.3389/fphys.2022.911437
Resetting the circadian clock of Alzheimer's mice via GLP-1 injection combined with time-restricted feeding
Erratum in
-
Corrigendum: Resetting the circadian clock of Alzheimer's mice via GLP-1 injection combined with time-restricted feeding.Front Physiol. 2022 Nov 21;13:1077956. doi: 10.3389/fphys.2022.1077956. eCollection 2022. Front Physiol. 2022. PMID: 36479341 Free PMC article.
Abstract
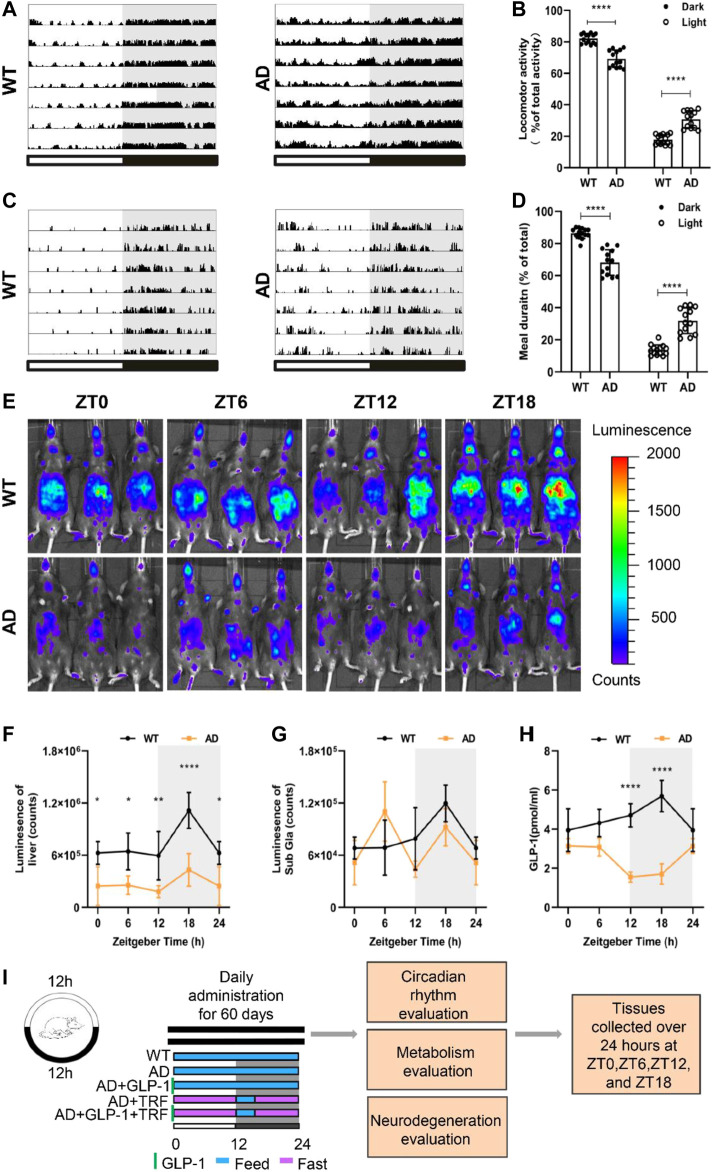
Circadian rhythm disturbances are the most common symptoms during the early onset of AD. Circadian rhythm disorders aggravate the deposition of amyloid plaques in the brains of AD patients. Therefore, improving the circadian rhythm of AD patients might slow down the pathological development of neurodegeneration. Circadian regulation is driven by a master clock in suprachiasmatic nuclei (SCN) and peripheral clock located in peripheral organs. The rhythmic feeding-fasting cycle has been proved to dominant cue to entrain peripheral clocks. We hypothesized that dietary intervention to a certain period of time during the dark phase might entrain the clock and reset the disrupted daily rhythms of AD mice. In this study, exogenous glucagon-like peptide-1 (GLP-1) treatment, time-restricted feeding (TRF), and the combination were used to examine the effect of overall circadian rhythm and neurodegenerative pathogenesis of transgenic AD mice. It was confirmed that GLP-1 administration together with time-restricted feeding improves circadian rhythm of 5 × FAD mice including the physiological rhythm of the activity-rest cycle, feeding-fasting cycle, core body temperature, and hormone secretion. Furthermore, GLP-1 and TRF treatments improved the diurnal metabolic homeostasis, spatial cognition, and learning of 5 × FAD mice. The aberrant expression of clock genes, including Baml1, Clock, and Dbp, was improved in the hypothalamus, and pathological changes in neurodegeneration and neuroinflammation were also observed in AD mice with dual treatment.
Keywords: Alzheimer’s disease; amyloid-β; circadian rhythm; glucagon-like peptide-1; time-restricted feeding.
Copyright © 2022 Dong, Cheng and Zhao.
Conflict of interest statement
The authors declare that the research was conducted in the absence of any commercial or financial relationships that could be construed as a potential conflict of interest.
Figures


Similar articles
-
Natural food intake patterns have little synchronizing effect on peripheral circadian clocks.BMC Biol. 2020 Nov 6;18(1):160. doi: 10.1186/s12915-020-00872-7. BMC Biol. 2020. PMID: 33158435 Free PMC article.
-
Feeding cues alter clock gene oscillations and photic responses in the suprachiasmatic nuclei of mice exposed to a light/dark cycle.J Neurosci. 2005 Feb 9;25(6):1514-22. doi: 10.1523/JNEUROSCI.4397-04.2005. J Neurosci. 2005. PMID: 15703405 Free PMC article.
-
Feeding Time Entrains the Olfactory Bulb Circadian Clock in Anosmic PER2::LUC Mice.Neuroscience. 2018 Nov 21;393:175-184. doi: 10.1016/j.neuroscience.2018.10.009. Epub 2018 Oct 12. Neuroscience. 2018. PMID: 30321586
-
Time Restricted Feeding to the Light Cycle Dissociates Canonical Circadian Clocks and Physiological Rhythms in Heart Rate.Front Pharmacol. 2022 May 12;13:910195. doi: 10.3389/fphar.2022.910195. eCollection 2022. Front Pharmacol. 2022. PMID: 35645828 Free PMC article. Review.
-
Time-restricted feeding regulates molecular mechanisms with involvement of circadian rhythm to prevent metabolic diseases.Nutrition. 2021 Sep;89:111244. doi: 10.1016/j.nut.2021.111244. Epub 2021 Mar 17. Nutrition. 2021. PMID: 33930788 Review.
Cited by
-
The impacts of sex and the 5xFAD model of Alzheimer's disease on the sleep and spatial learning responses to feeding time.Front Neurol. 2024 Jul 31;15:1430989. doi: 10.3389/fneur.2024.1430989. eCollection 2024. Front Neurol. 2024. PMID: 39144714 Free PMC article.
-
Linkage of circadian rhythm disruptions with Alzheimer's disease and therapeutic interventions.Acta Pharm Sin B. 2025 Jun;15(6):2945-2965. doi: 10.1016/j.apsb.2025.04.011. Epub 2025 Apr 15. Acta Pharm Sin B. 2025. PMID: 40654342 Free PMC article. Review.
-
Impact of Modern Lifestyle on Circadian Health and Its Contribution to Adipogenesis and Cancer Risk.Cancers (Basel). 2024 Nov 1;16(21):3706. doi: 10.3390/cancers16213706. Cancers (Basel). 2024. PMID: 39518143 Free PMC article. Review.
-
Relationship between APOE, PER2, PER3 and OX2R Genetic Variants and Neuropsychiatric Symptoms in Patients with Alzheimer's Disease.Int J Environ Res Public Health. 2023 Mar 1;20(5):4412. doi: 10.3390/ijerph20054412. Int J Environ Res Public Health. 2023. PMID: 36901420 Free PMC article.
References
LinkOut - more resources
Full Text Sources