. 2022 Sep;2(9):987-1004.
doi: 10.1158/2767-9764.crc-21-0135. Epub 2022 Sep 15.

Tumor Cell Extrinsic Synaptogyrin 3 Expression as a Diagnostic and Prognostic Biomarker in Head and Neck Cancer

Affiliations

Tumor Cell Extrinsic Synaptogyrin 3 Expression as a Diagnostic and Prognostic Biomarker in Head and Neck Cancer

Ryan M Murphy et al. Cancer Res Commun. 2022 Sep.

Abstract

Over 70% of oropharyngeal head and neck squamous cell carcinoma (HNSC) cases in the United States are positive for human papillomavirus (HPV) yet biomarkers for stratifying oropharyngeal head and neck squamous cell carcinoma (HNSC) patient risk are limited. We used immunogenomics to identify differentially expressed genes in immune cells of HPV(+) and HPV(-) squamous carcinomas. Candidate genes were tested in clinical specimens using both quantitative RT-PCR and IHC and validated by IHC using the Carolina Head and Neck Cancer Study (CHANCE) tissue microarray of HNSC cases. We performed multiplex immunofluorescent staining to confirm expression within the immune cells of HPV(+) tumors, receiver operating characteristic (ROC) curve analyses, and assessed survival outcomes. The neuronal gene Synaptogyrin-3 (SYNGR3) is robustly expressed in immune cells of HPV(+) squamous cancers. Multiplex immunostaining and single cell RNA-seq analyses confirmed SYNGR3 expression in T cells, but also unexpectedly in B cells of HPV(+) tumors. ROC curve analyses revealed that combining SYNGR3 and p16 provides more sensitivity and specificity for HPV detection compared to p16 IHC alone. SYNGR3-high HNSC patients have significantly better prognosis with five-year OS and DSS rates of 60% and 71%, respectively. Moreover, combining p16 localization and SYNGR3 expression can further risk stratify HPV(+) patients such that high cytoplasmic, low nuclear p16 do significantly worse (Hazard Ratio, 8.6; P = 0.032) compared to patients with high cytoplasmic, high nuclear p16. SYNGR3 expression in T and B cells is associated with HPV status and enhanced survival outcomes of HNSC patients.

Keywords: Diagnostic biomarkers; HPV(+) HNSC; Head; Neck & Oral Cancers; Prognostic biomarkers; Tumor Immune Microenvironment biomarker.


Conflict of interest statement

R.M. Murphy reports grants from NIH NIDCR during the conduct of the study. S. Kumar reports a patent to Method for quantifying DNA fragments in a sample by size issued, licensed, and with royalties paid and a patent to Compositions and methods for the selective detection of tumor-derived viral DNA issued, licensed, and with royalties paid. P.Y.F. Zeng reports a patent to prognosticate HPV+ head and neck cancer patients pending. D.N. Hayes reports grants from NCI during the conduct of the study. G.P. Gupta reports personal fees and other from Naveris outside the submitted work; in addition, G.P. Gupta has a patent to detect tumor-modified HPV in blood issued, licensed, and with royalties paid. C.V. Pecot reports a patent to US Provisional 63/215,674 pending. A.L. Amelio reports personal fees from LG Life Sciences outside the submitted work; in addition, A.L. Amelio reports a patent to USPTO Provisional 63/215,674 pending. No other disclosures were reported.

Figures

FIGURE 1
FIGURE 1
HPV(+) HNSC tumors exhibit a unique immunogenomic signature associated with SYNGR3hi Th1 T cells. A, Comparison of SYNGR3 expression according to squamous tumor type and HPV status. Data were extracted from TCGA for HNSC, CESC, ESCA, and LUSC RNA-seq datasets and log2 median-centered expression plotted according to HPV status. TCGA = The Cancer Genome Atlas; HPV = human papillomavirus; HNSC = head and neck squamous cell carcinoma; CESC = cervical and endocervical squamous cell carcinoma; ESCA = esophageal squamous cell carcinoma; LUSC = lung squamous cell carcinoma. B, Comparison of SYNGR3 expression according to HPV status. Data for HPV(+)OPSCCs and HPV(−) OPSCCs were extracted from the GSE65858 dataset and log2 median-centered expression plotted according to HPV status. Scale of y-axis set at the closest integer to the lowest sample values (6.0) to visualize the spread in expression across all of the samples. C, Unsupervised hierarchical clustering of immune-related genes (n = 1,500) expressed in patients (n = 109) from the HNSC TCGA RNA-seq dataset. D, Unsupervised hierarchical clustering of immune-related genes (n = 8) expressed specifically in Th1 T cells of patients (n = 109) from the HNSC TCGA RNA-seq dataset. E, Unsupervised hierarchical clustering of immune-related genes (n = 8) expressed specifically in Th1 T cells of patients (n = 109) from the CESC TCGA RNA-seq dataset.
FIGURE 2
FIGURE 2
Validation of elevated SYNGR3 mRNA and protein in HPV(+) HNSC patient tumors. A, Schematic of fresh-frozen human HNSC patient tumors categorized by HPV assay clinical diagnoses, including p16 IHC and HPV16 ISH. DN = double negative (n = 4), SP1 = single positive for p16 IHC (n = 3), DP = double positive for p16 IHC and HPV16 ISH (n = 3). B, qRT-PCR analysis of CDKN2A (gene name for p16 protein) mRNA levels. CDKN2A expression was normalized to RPL23 mRNA levels and fold expression was calculated relative to the average of the DN group. Data are presented as the mean ± SEM (n = 4 technical replicates; one-way ANOVA test, ns = not significant). C, qRT-PCR analysis of SYNGR3 and CCNA1 mRNA levels. SYNGR3 and CCNA1 expression were normalized to RPL23 mRNA levels and fold expression was calculated relative to the average of the DN group. Data are presented as the mean ± SEM (n = 4 technical replicates; one-way ANOVA test; *, P < 0.05; **, P < 0.01). D, Analysis of SYNGR3 protein expression in the fresh-frozen tumor validation cohort. Representative 1× and high magnification 20× inset images of SYNGR3 IHC staining within the tumor and stroma of sections according to each respective HPV assay category. E, Quantification of SYNGR3 IHC staining in D represented as H-score. Data are presented as mean ± SEM (*, P < 0.05).
FIGURE 3
FIGURE 3
Antibody validation confirms that SYNGR3 protein is expressed at significantly higher levels in HPV(+) HNSC. A, Schematic of TMA composed of FFPE HNSC patient tumor cores categorized by HPV assay clinical diagnoses, including p16 IHC and HPV16 ISH. DN = double negative (n = 103), SP1 = single positive for p16 IHC (n = 69), SP2 = single positive for HPV16 ISH (n = 5), DP = double positive for p16 IHC and HPV16 ISH (n = 13). Positive p16 IHC cores were defined as equal to or greater than 70% of cells with a score of 1, 2, or 3 in either the nucleus or cytoplasm. HPV ISH positive cores were defined as any cells with a nuclear score of 1, 2, or 3. B, Comparison of SYNGR3 protein expression in HNSC patient tumors. Representative images and high magnification 20× inset ROIs of SYNGR3 IHC staining depicting SYNGR3 expression within the tumor stroma shown for cores with the highest percentage of stained cells in each category of IHC scores [0 = negative (no staining for SYNGR3); 1 = low; 2 = medium; 3 = high]. C, Quantification of SYNGR3 IHC staining of CHANCE TMA by HPV assay category delineated in A represented as H-score. Data are presented as mean ± SEM (***, P < 0.001).
FIGURE 4
FIGURE 4
Codetection of SYNGR3 and p16 provides a tractable pair of IHC-only biomarkers for identifying HPV status in HNSC. ROC curves plotting sensitivity by specificity of H-score (left) and percent positive cells (right, cells scoring 1–3) using two independent antibodies (A and B) for SYNGR3 IHC staining of CHANCE TMA cases with known HPV status as determined by ddPCR. AUC = area under the curve.
FIGURE 5
FIGURE 5
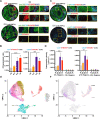
T and B cells in the stromal compartment have the strongest correlation with high SYNGR3 expression. A, Representative multiplex IHC staining of TMA cores for SYNGR3 (red), CD3 (cyan, pan T-cell marker), pan-CK (green, pan-cytokeratin), and DAPI (purple, nuclei) with enumeration of SYNGR3+/CD3+ cells in CK+ and CK− regions. Scale bar = 400 μm. B, Quantification of IHC of SYNGR3 and CD3 (T cells; left) or SYNGR3 and CD45 (all immune cells; right) according to HPV assay category. Data represented as number of coexpressing cells in all ROIs. Expression data are presented as mean ± SEM (***, P < 0.001; ****, P < 0.0001). C, Representative multiplex IHC staining of TMA cores for SYNGR3 (red), CD45 (cyan, pan immune cell marker), p16 (green, tumor), and DAPI (purple, nuclei) with enumeration of SYNGR3+/CD3+ cells in p16+ and p16− regions. Scale bar = 400 μm. D, Quantification of IHC of SYNGR3 and CD3 (T cells; left) or SYNGR3 and CD45 (all immune cells; right) according to HPV assay category separated by epithelial/stromal ROIs. Epithelial/tumor regions were defined by either pan-CK (left) or p16 IHC (right), and included the tumor stroma analysis (defined by 25 μm on either side of tumor border). Data represented as density of coexpressing cells. Expression data are presented as mean ± SEM (**, P < 0.01; ***, P < 0.001). E and F, Single-cell RNA-seq data of HNSC HPV(+) tumors confirms SYNGR3 expression in T and B cells. Expression data are presented as uniform manifold approximation and projection (UMAP) plots.
FIGURE 6
FIGURE 6
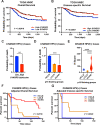
Relationship between high SYNGR3 expression and DSS of patients with HPV(+) HNSC. Kaplan–Meier curves for OS (A) and DSS (B) of patients with TCGA HNSC stratified by SYNGR3 expression from tumor RNA-seq data using UCSC Xenabrowser. High SYNGR3 = top quartile mRNA expression, Low SYNGR3 = bottom quartile mRNA expression; P < 0.05. C, Probability of death in HPV(+) CHANCE TMA patients stratified according to SYNGR3 expression levels. (**, P < 0.01). D, Probability of death in HPV(+) CHANCE TMA patients stratified by p16 cytoplasmic and nuclear expression by p16 IHC into localization categories. High cytoplasmic (HC) = cytoplasmic H-score of 50 and above; low cytoplasmic (LC) = cytoplasmic H score below 50; high nuclear (HN) = nuclear H-score of 70 and above; low nuclear (LN) = nuclear H-score below 70. (***, P < 0.001). E, Comparison of SYNGR3 protein expression by IHC stain of whole HPV(+) CHANCE TMA cores separated by the p16 localization categories defined in D. Expression data are presented as violin plot of H-score and presented as mean ± SEM (****, P < 0.0001). F and G, Survival curves of following multivariate analysis of HPV(+) CHANCE TMA patients adjusted for age, sex, race, smoking status, alcohol status, and tumor site. Patients separated by p16 localization category defined in D. Unadjusted curves can be found in Supplementary Fig. S4.

Similar articles

Cited by

References

    1. Bray F, Ferlay J, Soerjomataram I, Siegel RL, Torre LA, Jemal A. Global cancer statistics 2018: GLOBOCAN estimates of incidence and mortality worldwide for 36 cancers in 185 countries. CA Cancer J Clin 2018;68:394–424. - PubMed
    1. Global Burden of Disease Cancer Collaboration; Fitzmaurice C, Allen C, Barber RM, Barregard L, Bhutta ZA, et al. . Global, regional, and national cancer incidence, mortality, years of life lost, years lived with disability, and disability-adjusted life-years for 32 cancer groups, 1990 to 2015: a systematic analysis for the global burden of disease study. JAMA Oncol 2016;3:524–48. - PMC - PubMed
    1. Johnson DE, Burtness B, Leemans CR, Lui VWY, Bauman JE, Grandis JR. Head and neck squamous cell carcinoma. Nat Rev Dis Primers 2020;6:92. - PMC - PubMed
    1. Siegel RL, Miller KD, Fuchs HE, Jemal A. Cancer statistics, 2021. CA Cancer J Clin 2021;71:7–33. - PubMed
    1. Sacco AG, Cohen EE. Current treatment options for recurrent or metastatic head and neck squamous cell carcinoma. J Clin Oncol 2015;33:3305–15. - PubMed

Publication types

MeSH terms