. 2022 Dec;44(1):1545-1557.
doi: 10.1080/0886022X.2022.2126789.

Activation of AMPK-PGC-1α pathway ameliorates peritoneal dialysis related peritoneal fibrosis in mice by enhancing mitochondrial biogenesis

Affiliations

Activation of AMPK-PGC-1α pathway ameliorates peritoneal dialysis related peritoneal fibrosis in mice by enhancing mitochondrial biogenesis

Jun Wu et al. Ren Fail. 2022 Dec.

Abstract

Background: The pathogenesis of peritoneal dialysis (PD)-related peritoneal fibrosis (PF) is not clearly understood, and current treatment options are limited.

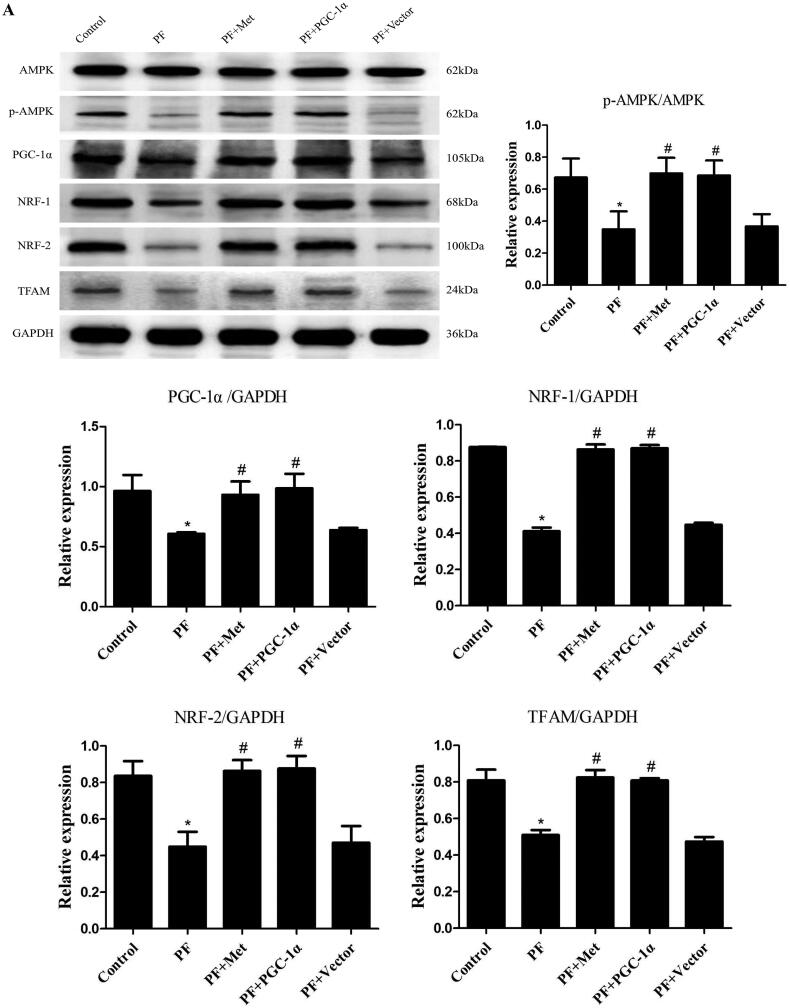
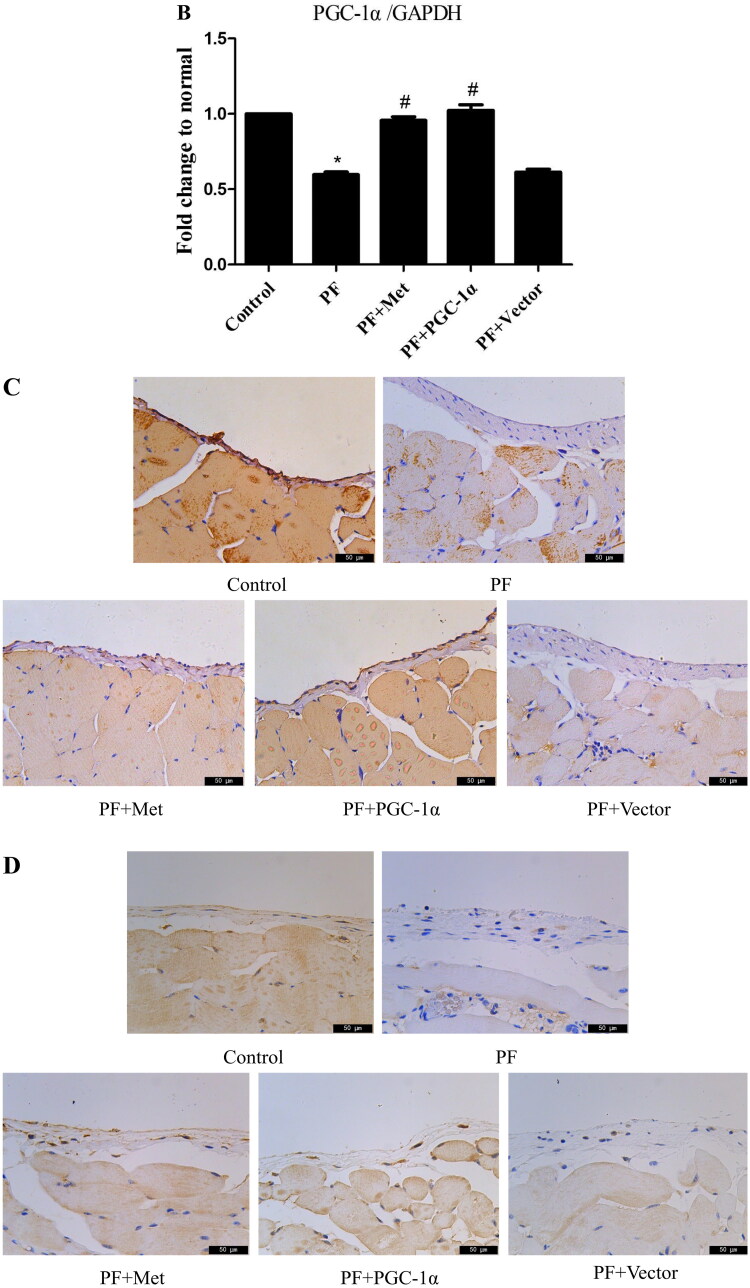
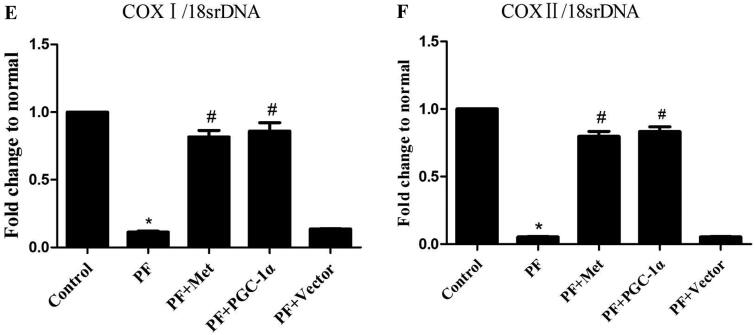
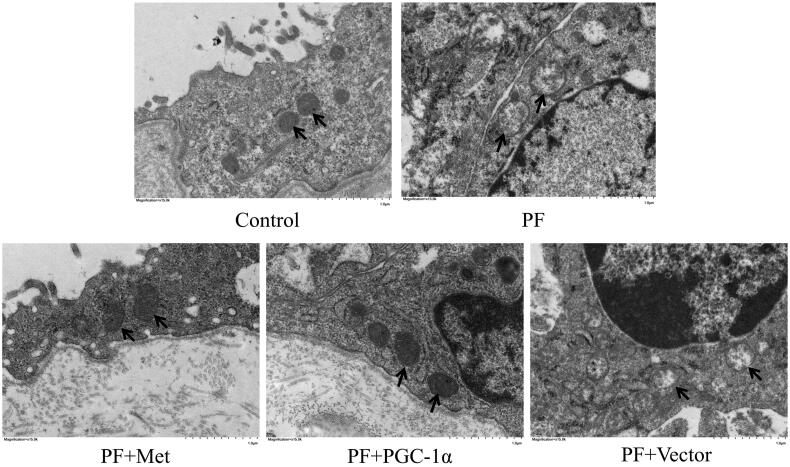
Methods: In this study, the effect of PD-related PF on mitochondrial biogenesis was investigated, and the effect of activation of the adenosine monophosphate-activated protein kinase (AMPK)-PGC-1α (peroxisome proliferator-activated receptor γ coactivator-1α) pathway on PF was evaluated in mice.

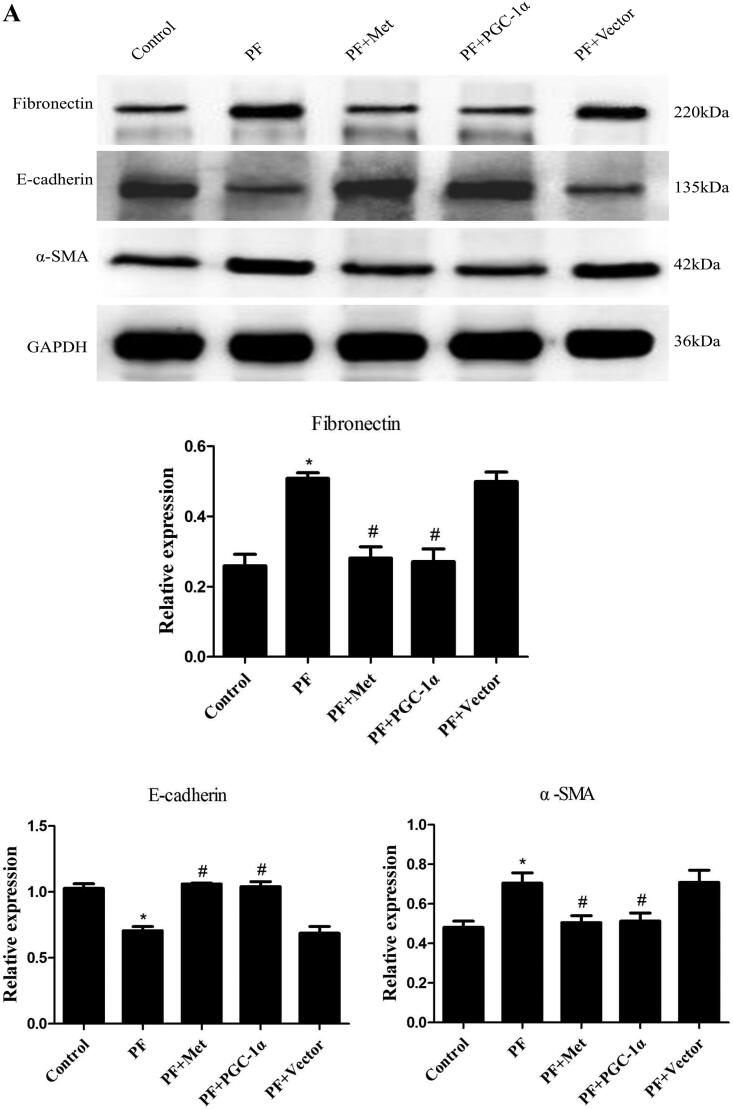
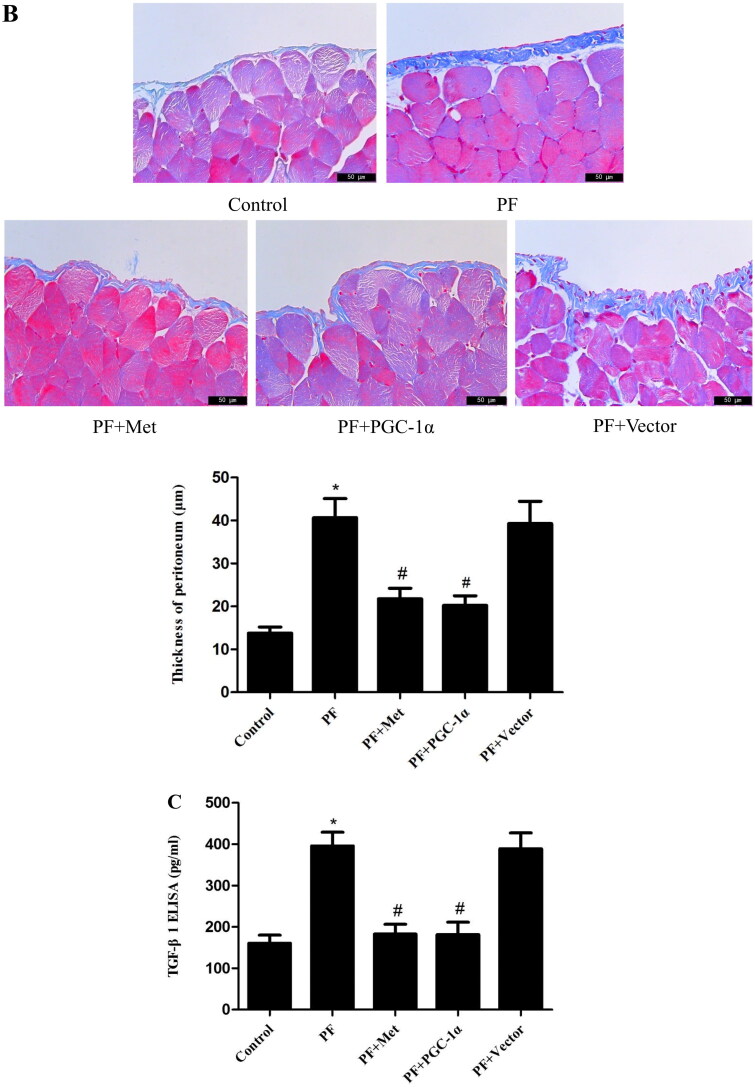
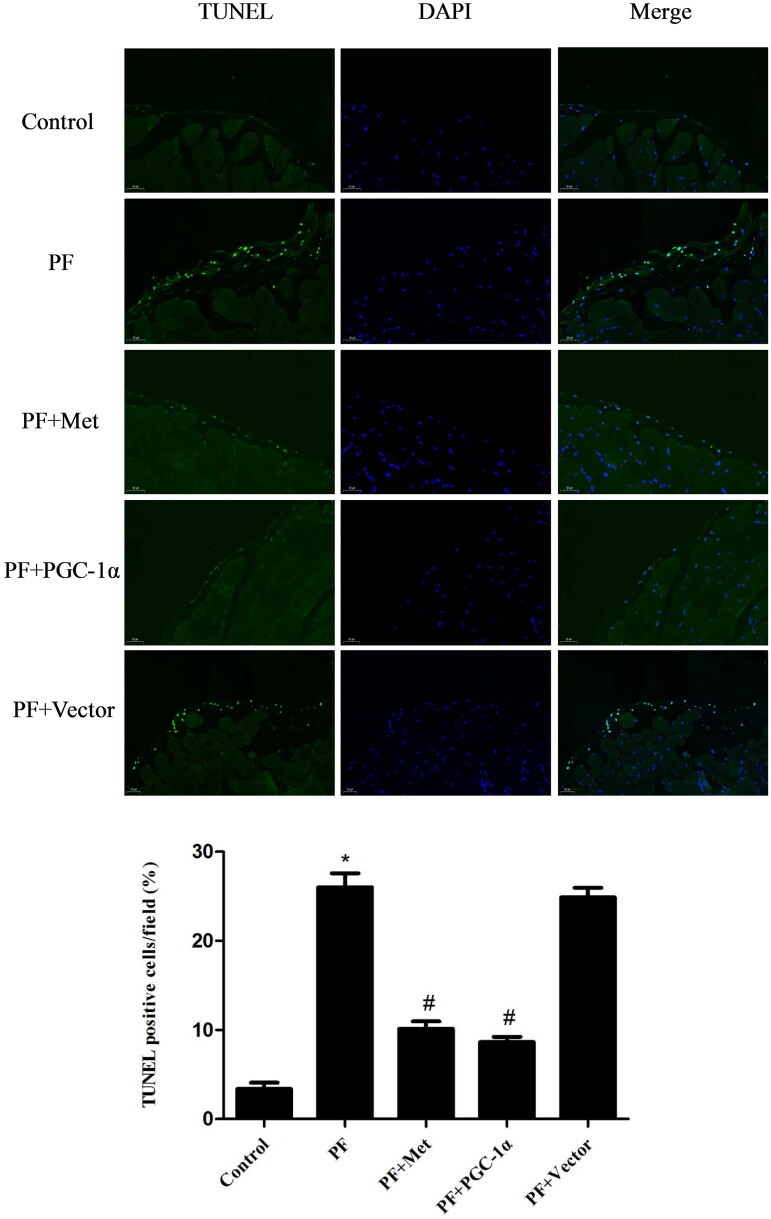
Results: In a mouse model of PD-related PF, AMPK-PGC-1α signaling (phospho-AMPK, PGC-1α, NRF-1, NRF-2 and TFAM expression) was downregulated, mitochondrial DNA (mtDNA) levels were reduced, and mitochondrial structure was damaged in the peritoneum. In addition, TdT-mediated dUTP nick-end labeling (TUNEL) staining showed typical apoptosis characteristics in peritoneal mesothelial cells (PMCs). Activation of the AMPK-PGC-1α pathway (PGC-1α overexpression or metformin, which is an agonist of AMPK) upregulated phospho-AMPK, PGC-1α, nuclear respiratory factors 1 (NRF-1) and 2 (NRF-2), and mitochondrial transcription factor A (TFAM) expression and mtDNA content, improved mitochondrial morphological manifestations, inhibited apoptosis of PMCs and alleviated PF.

Conclusion: Our study may suggest that activation of the AMPK-PGC-1α pathway ameliorates PD-related PF by enhancing mitochondrial biogenesis.

Keywords: AMPK; PGC-1α; Peritoneal dialysis; mitochondrial biogenesis; peritoneal fibrosis.


Conflict of interest statement

No potential conflict of interest was reported by the author(s).

Figures

Figure 1.
Figure 1.
Reduced mitochondrial biogenesis capacity in a mouse model of PF. A mouse model of PD-induced PF was established. Animals were randomly divided into five groups: the control group, peritoneal fibrosis group (PF), peritoneal fibrosis + metformin group (PF + Met), peritoneal fibrosis + PGC-1α overexpression group (PF + PGC-1α), and peritoneal fibrosis + empty vector group (PF + Vector). (A) Immunoblotting was used to evaluate the expression of p-AMPK, PGC-1α, NRF-1, NRF-2 and TFAM. (B) RT–PCR was used to evaluate the mRNA expression of PGC-1α. (C&D) Immunohistochemistry was used to evaluate NRF-1 and NRF-2 expression (magnification ×400). (E&F) RT–PCR was used to evaluate the mtDNA amount. The ratio of COX I or COX II to 18S rDNA was calculated, indicating the relative mitochondrial copy number. The obtained results are representative of three independent experiments. *p < 0.05 vs. Control. #p < 0.05 vs. PF. PD: peritoneal dialysis; p-AMPK: phospho-adenosine monophosphate-activated protein kinase; PGC-1α: peroxisome proliferator-activated receptor γ coactivator-1α; NRF: nuclear respiratory factor; TFAM: mitochondrial transcription factor A. RT–PCR: real-time polymerase chain reaction; mtDNA: mitochondrial DNA; COX: cytochrome c oxidase.
Figure 1.
Figure 1.
Reduced mitochondrial biogenesis capacity in a mouse model of PF. A mouse model of PD-induced PF was established. Animals were randomly divided into five groups: the control group, peritoneal fibrosis group (PF), peritoneal fibrosis + metformin group (PF + Met), peritoneal fibrosis + PGC-1α overexpression group (PF + PGC-1α), and peritoneal fibrosis + empty vector group (PF + Vector). (A) Immunoblotting was used to evaluate the expression of p-AMPK, PGC-1α, NRF-1, NRF-2 and TFAM. (B) RT–PCR was used to evaluate the mRNA expression of PGC-1α. (C&D) Immunohistochemistry was used to evaluate NRF-1 and NRF-2 expression (magnification ×400). (E&F) RT–PCR was used to evaluate the mtDNA amount. The ratio of COX I or COX II to 18S rDNA was calculated, indicating the relative mitochondrial copy number. The obtained results are representative of three independent experiments. *p < 0.05 vs. Control. #p < 0.05 vs. PF. PD: peritoneal dialysis; p-AMPK: phospho-adenosine monophosphate-activated protein kinase; PGC-1α: peroxisome proliferator-activated receptor γ coactivator-1α; NRF: nuclear respiratory factor; TFAM: mitochondrial transcription factor A. RT–PCR: real-time polymerase chain reaction; mtDNA: mitochondrial DNA; COX: cytochrome c oxidase.
Figure 2.
Figure 2.
Mitochondrial alterations in a mouse model of PF. To determine the effect of PF on mitochondrial morphology, we observed the mitochondrial changes in PMCs in parietal peritoneal tissue using TEM. Typical TEM images are displayed (magnification ×15,000). PMCs: peritoneal mesothelial cells; TEM: transmission electron microscopy; PF: peritoneal fibrosis; PF + Met: peritoneal fibrosis + metformin; PF + PGC-1α: peritoneal fibrosis + PGC-1α overexpression; PF + Vector: peritoneal fibrosis + empty adenoviral vector.
Figure 3.
Figure 3.
Activation of the AMPK-PGC-1α pathway alleviates PF. (A) Immunoblotting was used to evaluate the effect of activation of the AMPK-PGC-1α pathway on the expression of fibrosis molecules, including fibronectin, α-SMA and E-cadherin, in the visceral peritoneal membrane. (B) Masson’s trichrome staining was used to measure the degree of PF. Representative histology of parietal peritoneal tissue is shown with a quantitation bar of peritoneal thickness (magnification ×400). (C) TGF-β1 expression in the peritoneal dialysis effluent was determined by ELISA. The results are representative of three independent experiments. *p < 0.05 vs. Control. #p < 0.05 vs. PF. α-SMA: α-smooth muscle actin; ELISA: Enzyme-linked immunosorbent assay; PF: peritoneal fibrosis; PF + Met: peritoneal fibrosis + metformin; PF + PGC-1α: peritoneal fibrosis + PGC-1α overexpression; PF + Vector: peritoneal fibrosis + empty adenoviral vector.
Figure 3.
Figure 3.
Activation of the AMPK-PGC-1α pathway alleviates PF. (A) Immunoblotting was used to evaluate the effect of activation of the AMPK-PGC-1α pathway on the expression of fibrosis molecules, including fibronectin, α-SMA and E-cadherin, in the visceral peritoneal membrane. (B) Masson’s trichrome staining was used to measure the degree of PF. Representative histology of parietal peritoneal tissue is shown with a quantitation bar of peritoneal thickness (magnification ×400). (C) TGF-β1 expression in the peritoneal dialysis effluent was determined by ELISA. The results are representative of three independent experiments. *p < 0.05 vs. Control. #p < 0.05 vs. PF. α-SMA: α-smooth muscle actin; ELISA: Enzyme-linked immunosorbent assay; PF: peritoneal fibrosis; PF + Met: peritoneal fibrosis + metformin; PF + PGC-1α: peritoneal fibrosis + PGC-1α overexpression; PF + Vector: peritoneal fibrosis + empty adenoviral vector.
Figure 4.
Figure 4.
Activation of the AMPK-PGC-1α pathway inhibited the apoptosis of PMCs. The apoptosis of PMCs in parietal peritoneal tissue was revealed using a TUNEL assay. Representative images are displayed (magnification ×400). Quantitative analysis of TUNEL-positive cells. The results are representative of three independent experiments. *p < 0.05 vs. Control. #p < 0.05 vs. PF. PMCs: peritoneal mesothelial cells; TUNEL: TdT-mediated dUTP nick-end labeling; PF: peritoneal fibrosis; PF + Met: peritoneal fibrosis + metformin; PF + PGC-1α: peritoneal fibrosis + PGC-1α overexpression; PF + Vector: peritoneal fibrosis + empty adenoviral vector.

References

    1. Li PK, Chow KM, Van de Luijtgaarden MW, et al. . Changes in the worldwide epidemiology of peritoneal dialysis. Nat Rev Nephrol. 2017;13(2):90–103. - PubMed
    1. Davies SJ. Peritoneal dialysis-current status and future challenges. Nat Rev Nephrol. 2013;9(7):399–408. - PubMed
    1. Devuyst O, Margetts PJ, Topley N.. The pathophysiology of the peritoneal membrane. J Am Soc Nephrol. 2010;21(7):1077–1085. - PubMed
    1. Zhou Q, Bajo MA, Del Peso G, et al. . Preventing peritoneal membrane fibrosis in peritoneal dialysis patients. Kidney Int. 2016;90(3):515–524. - PubMed
    1. Krediet RT, Struijk DG.. Peritoneal changes in patients on long-term peritoneal dialysis. Nat Rev Nephrol. 2013;9(7):419–429. - PubMed

LinkOut - more resources