. 2023 Apr 19;146(4):1697-1713.
doi: 10.1093/brain/awac342.

Inhibition of YAP/TAZ-driven TEAD activity prevents growth of NF2-null schwannoma and meningioma

Affiliations

Inhibition of YAP/TAZ-driven TEAD activity prevents growth of NF2-null schwannoma and meningioma

Liyam Laraba et al. Brain. .

Erratum in

Abstract

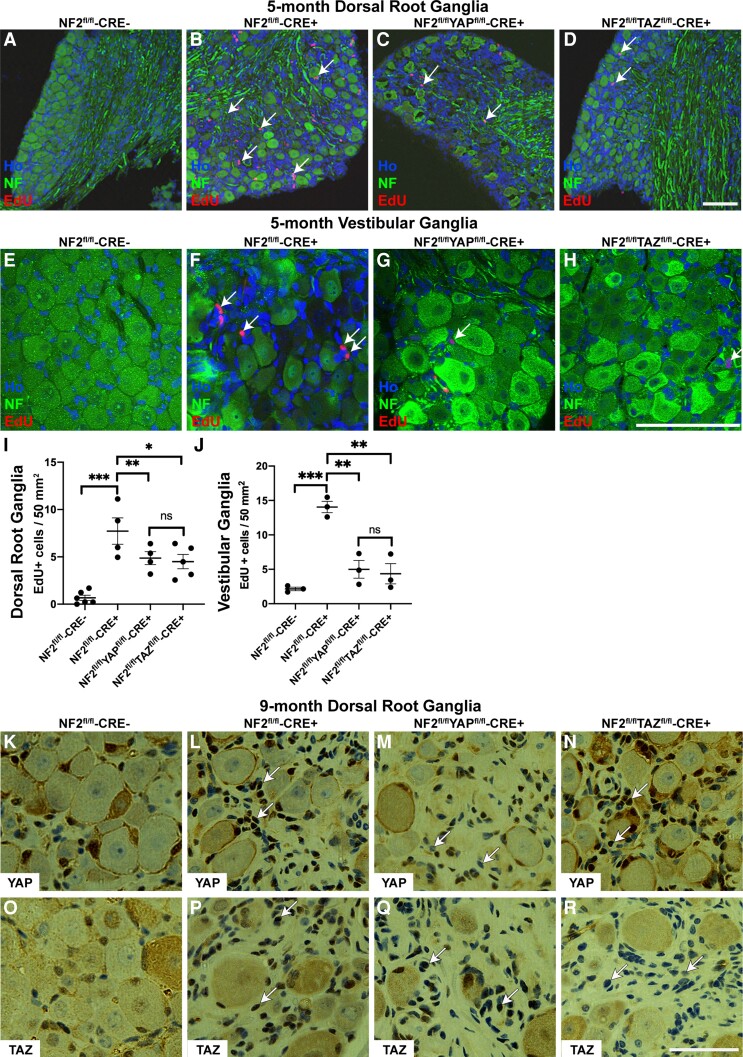
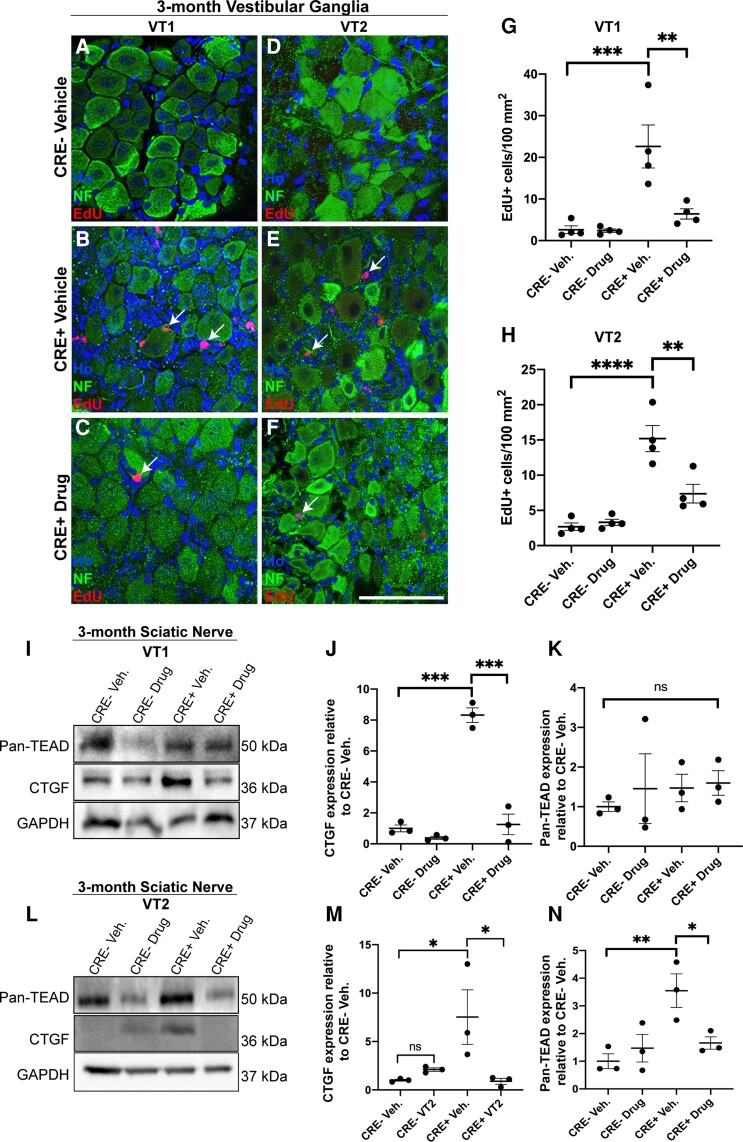
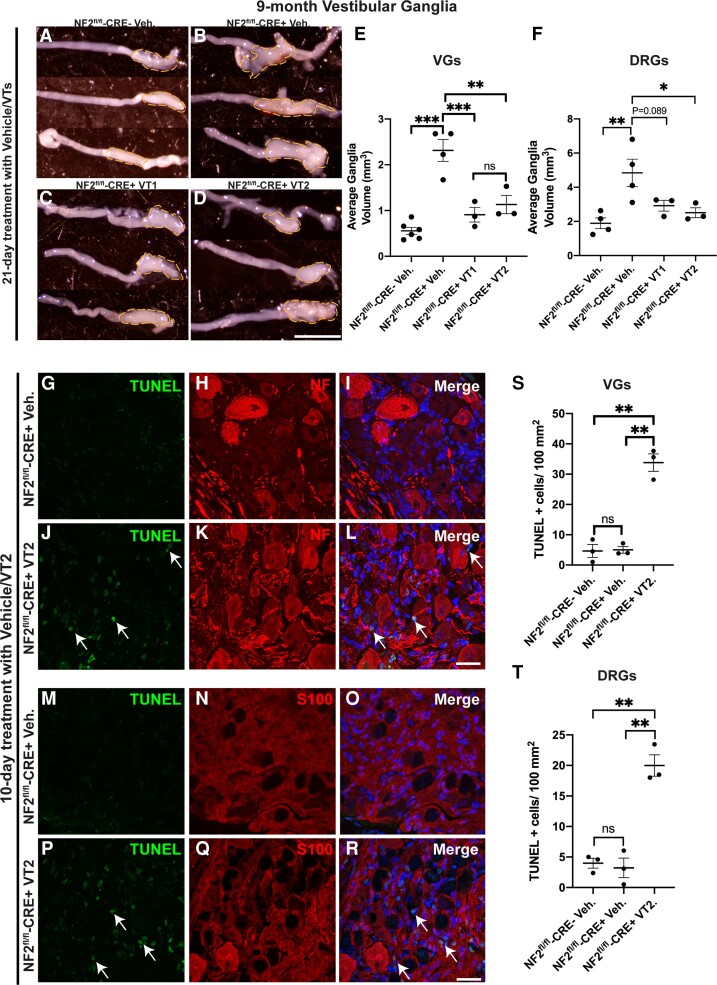
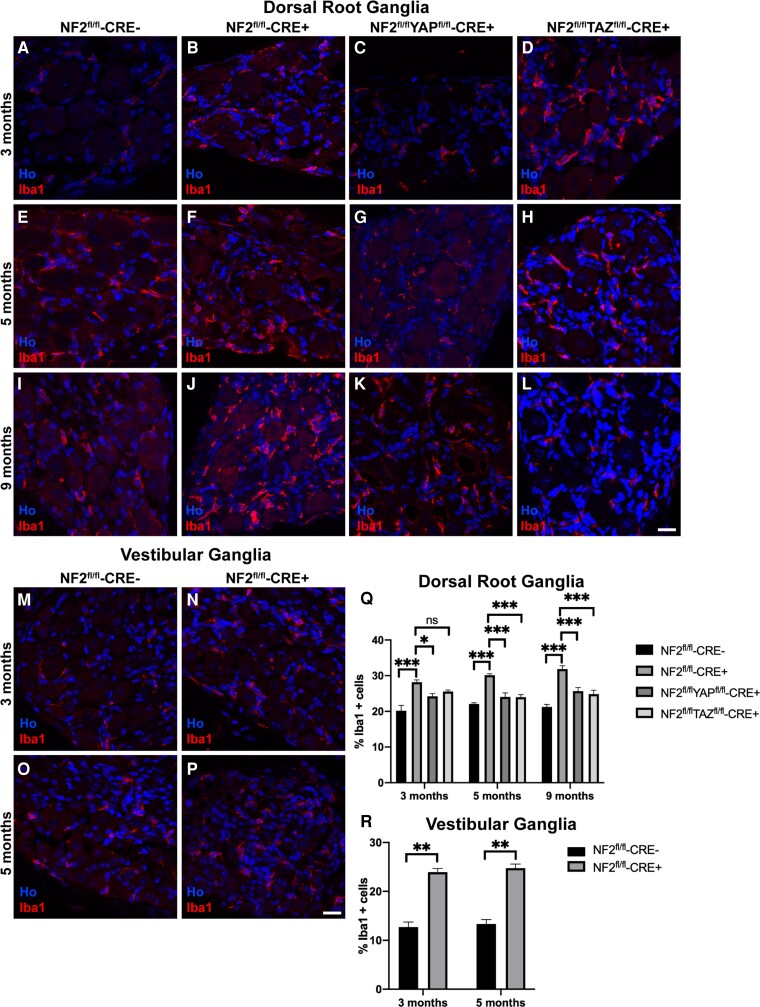
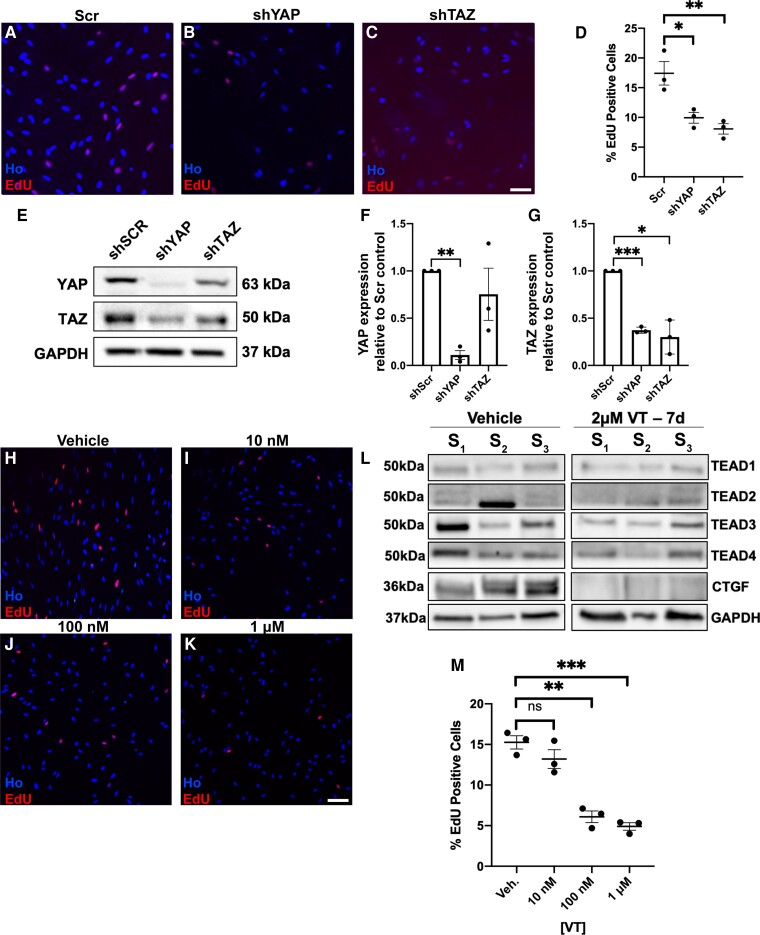
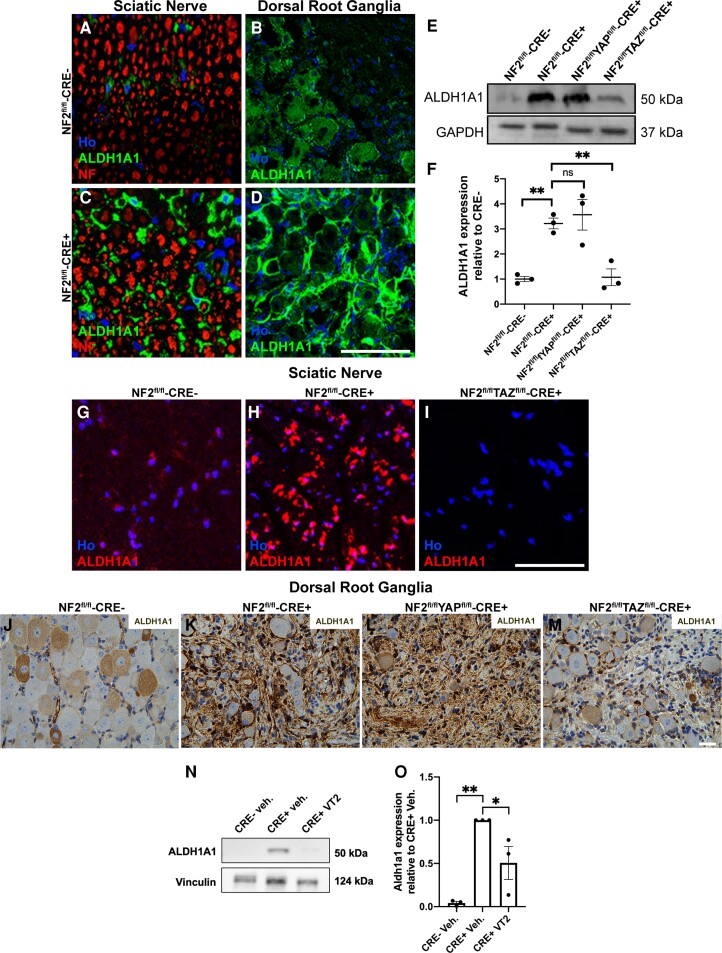
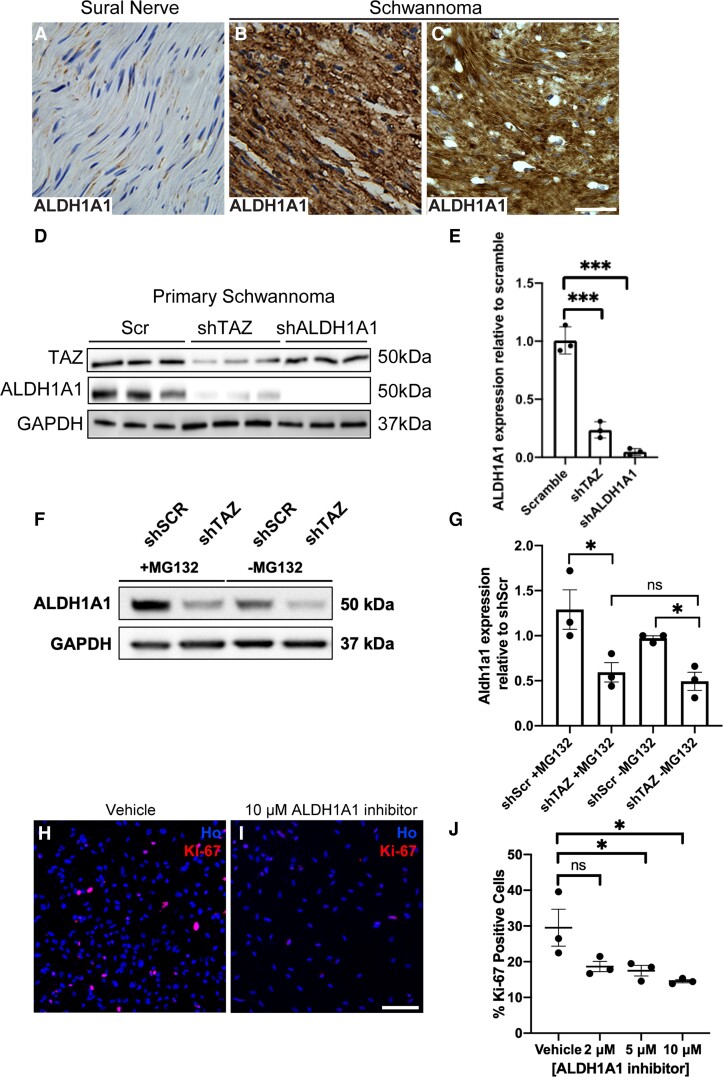
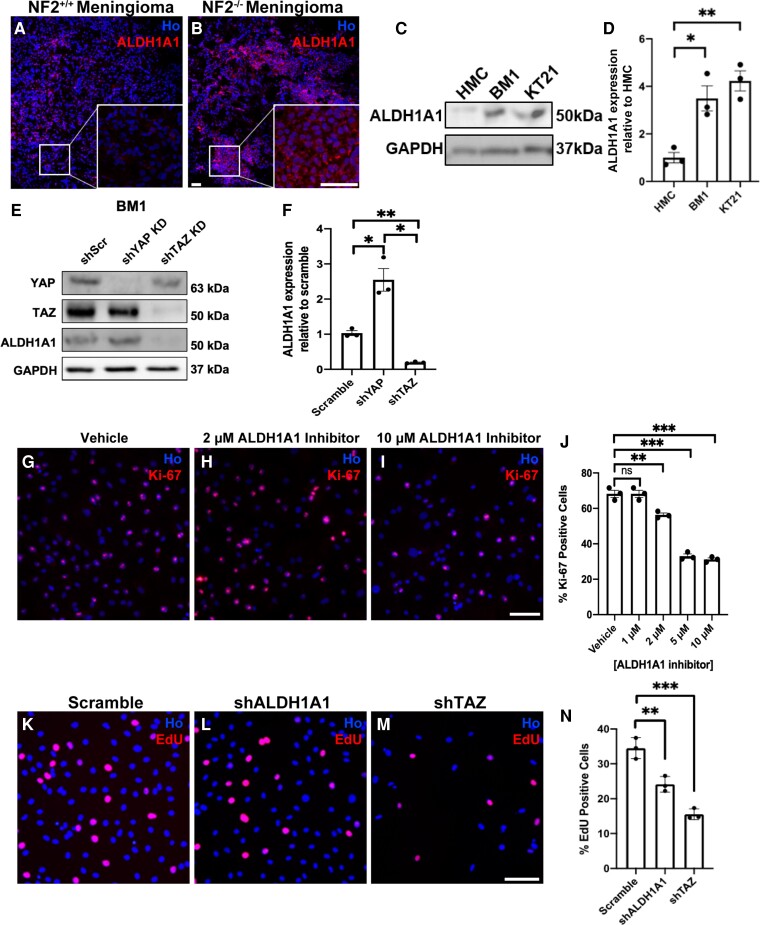
Schwannoma tumours typically arise on the eighth cranial nerve and are mostly caused by loss of the tumour suppressor Merlin (NF2). There are no approved chemotherapies for these tumours and the surgical removal of the tumour carries a high risk of damage to the eighth or other close cranial nerve tissue. New treatments for schwannoma and other NF2-null tumours such as meningioma are urgently required. Using a combination of human primary tumour cells and mouse models of schwannoma, we have examined the role of the Hippo signalling pathway in driving tumour cell growth. Using both genetic ablation of the Hippo effectors YAP and TAZ as well as novel TEAD palmitoylation inhibitors, we show that Hippo signalling may be successfully targeted in vitro and in vivo to both block and, remarkably, regress schwannoma tumour growth. In particular, successful use of TEAD palmitoylation inhibitors in a preclinical mouse model of schwannoma points to their potential future clinical use. We also identify the cancer stem cell marker aldehyde dehydrogenase 1A1 (ALDH1A1) as a Hippo signalling target, driven by the TAZ protein in human and mouse NF2-null schwannoma cells, as well as in NF2-null meningioma cells, and examine the potential future role of this new target in halting schwannoma and meningioma tumour growth.

Keywords: Hippo pathway; Merlin; TEAD proteins; meningioma; schwannoma.


Conflict of interest statement

T.T.T. and L.P. are employees of Vivace Therapeutics and have equity interest in Vivace Therapeutics.

Figures

Figure 1
Figure 1
Proliferation of schwannoma cells in the DRG and VG is dependent upon both YAP and TAZ proteins. (AH) Images of DRG (AD) and VG (EH) from 5-month-old mice stained for EdU and neurofilament (NF); sections were counterstained with Hoechst to reveal nuclei (Ho). Arrows indicate EdU-positive nuclei in the areas of the ganglia in close proximity to the neuronal cell bodies; note fewer proliferating cells in NF2/YAP (C and G) and NF2/TAZ (D and H) than in NF2 single null (B and F) ganglia. (I and J) Quantification of EdU-positive cells per area of ganglion tissue of DRG (I) and VG (J). Note significant decreases in proliferation in both NF2/YAP and NF2/TAZ ganglia. (KR) Staining of DRG sections from 9-month-old control (NF2fl/flCRE-; K and O), NF2 single null (NF2fl/flCRE+; L and P), NF2/YAP double null (NF2fl/fl/YAPfl/flCRE+; M and Q) and NF2/TAZ double null (NF2fl/fl/TAZfl/flCRE+; N and R) animals. Panels KN show staining with YAP antibody; panels OR with TAZ antibody. Note raised nuclear expression of YAP in NF2 single (L; arrows) and NF2/TAZ double (N; arrows) null tissue, which is lost in NF2/YAP double null tissue (M; arrows). For TAZ staining, note raised nuclear TAZ expression in NF2 single (P; arrows) and NF2/YAP double (Q; arrows) null tissue, which is not present in NF2/TAZ double null DRG tissue (R; arrows). AD and I, n = 4; EH and J, n = 3; KR, n = 3 for each genotype examined. Data presented in graphs are means ± SEM using one-way ANOVA with Bonferroni’s multiple comparison tests. *P < 0.05; **P < 0.01; ***P < 0.001; ns, not significant. Scale bars = AH 75 μm, KR 50 μm.
Figure 2
Figure 2
Treatment of mice with VT1 or VT2 TEAD auto-palmitoylation inhibitors significantly inhibits proliferation of vestibular schwannoma tumours in vivo. Data from 3-month-old NF2fl/fl-CRE- (CRE-) and NF2fl/fl-CRE+ (CRE+) animals treated with vehicle (Veh), 10 mg/kg/day VT1 or 30 mg/kg/day VT2 by oral gavage for 21 consecutive days. A–-H. Both VT1 and VT2 significantly block tumour cell growth as measured by EdU incorporation in vestibular ganglion tissue. AF. Represenatitve images of vestibular ganglion from CRE- and CRE+ 3-month-old animals treated with either vehicle (A, B, D and E), VT1 (C) or VT2 (F). Note no EdU-positive cells are seen in CRE- animals with vehicle and that for CRE+ animals, numbers of EdU-positive cells (indicated by arrows) are reduced upon treatment with either VT1 (C) or VT2 (F). (G and H) Quantification of numbers of EdU-positive cells per area of ganglion tissue from animals treated with vehicle (Veh) or VT1 (Drug, G) or VT2 (Drug, H) compounds. Note significant decreases in proliferation in CRE+ animals treated with either VT1 or VT2. IN. Representative western blots and quantification to show target engagement of VT1 and VT2 in regulating connective tissue growth factor (CTGF) and TEAD protein expression in sciatic nerve tissue of CRE- and CRE+ mice. I. Western blot of sciatic nerve of 3-month-old mice treated for 21 days with either Vehicle (Veh), VT1 (Drug, I) or Vehicle or VT2 (Drug, L). (J and K) Quantification of western blot in I. (M, N) Quantification of western blot in L. Note significant decrease in TEAD target CTGF by both VT1 and VT2 in sciatic nerve tissue in vivo (J and M) and reduction in TEAD protein expression by VT2 (N) but not by VT1 (K). For data in AH, n = 4 mice for each genotype and drug treatment. For data in J, K, M and N, n = 3 mice for each genotype and drug treatment. Data presented in graphs are means ± SEM using one-way ANOVA with Bonferroni’s multiple comparison tests. *P < 0.05; **P < 0.01; ***P < 0.001. Scale bar = 50 μm in AF.
Figure 3
Figure 3
Treatment of mice with VT auto-palmitoylation inhibitors significantly increases apoptosis and reduces tumour volumes in VG and DRG in 9-month-old NF2fl/fl-CRE+ (NF2fl/fl-CRE+) mice. NF2fl/fl-CRE- (NF2fl/fl-CRE-) and NF2fl/fl-CRE+ animals were treated with vehicle (Veh), 10 mg/kg/day VT1 or 30 mg/kg/day VT2 by oral gavage for 10 or 21 consecutive days. (AD) Representative brightfield micrographs of three different unilateral VG from: NF2fl/fl-CRE- Veh-treated mice (A), NF2fl/fl-CRE+ Veh-treated mice (B), NF2fl/fl-CRE+ VT1-treated mice (C) and NF2fl/fl-CRE+ VT2-treated mice (D), all mice were treated for 21 consecutive days. Scale bar = 20 μm. (E) Quantification of average bilateral VG volume in AD, for NF2fl/fl-CRE- Veh-treated mice (n = 6 ganglia, n = 3 mice), NF2fl/fl-CRE+ Veh-treated mice (n = 4 ganglia, n = 3 mice), NF2fl/fl-CRE+ VT1-treated mice (n = 3 ganglia, n = 3 mice) and NF2fl/fl-CRE+ VT2-treated mice (n = 3 ganglia, n = 3 mice). (F) Quantification of average bilateral lumbar 4 DRG volume, for NF2fl/fl-CRE- and NF2fl/fl-CRE+ Veh-treated mice (n = 8 ganglia, n = 3 mice), for NF2fl/fl-CRE+ VT1- and NF2fl/fl-CRE+ VT2-treated mice (n = 3 ganglia, n = 3 mice). (GR) Representative immunofluorescence of n = 3 different VGs with in situ apoptosis detected by terminal deoxynucleotidyl transferase dUTP nick-end labelling (TUNEL) assay, following oral gavage with either vehicle or 30 mg/kg/day VT2 for 10 days. TUNEL+ nuclei (arrows; J, L, P and R) were significantly increased in NF2fl/fl-CRE+ VT2-treated mice compared to NF2fl/fl-CRE+ Veh-treated mice. Neurofilament (NF; H and K) counterstain (merged with Hoechst counterstain (I and L) reveals increased apoptosis in cells surrounding neuronal cell bodies of the VG in NF2fl/fl-CRE+ VT2-treated mice. S100 counterstain (N and Q merged with Hoechst counterstain (O and R) reveals apoptosis is increased in S100+ schwannoma cells of NF2fl/fl-CRE+ VT2-treated mice. Scale bars = 20 μm. (S and T) Quantification of TUNEL+ cells/100 mm2 in VG (S) and DRG (T). In E and F, data presented as mean ± SEM using one-way ANOVA with Tukey’s multiple comparisons tests. In S and T, data presented as mean ± SEM using Brown–Forsythe and Welch ANOVA with Dunnett’s T3 multiple comparisons test. **P < 0.01; ***P < 0.001; ns = non-significant.
Figure 4
Figure 4
Increased numbers of macrophages in NF2-null DRG tissue is dependent upon YAP and TAZ. (AL) Staining of DRG sections from NF2fl/fl-CRE- (A, E and I), NF2fl/fl-CRE+ (B, F and J), NF2fl/flYAPfl/fl-CRE+ (C, G and K) and NF2fl/flTAZfl/fl-CRE+ (D, H and L) animals at 3, 5 and 9 months of age with pan-macrophage marker Iba1 antibody. Note time-dependent increase in numbers of Iba1-positive macrophages in NF2fl/fl-CRE+ DRG between 3 (B), 5 (F) and 9 (J) months. (MP) Staining of sections of VG tissue from NF2fl/fl-CRE- (M and O) and NF2fl/fl-CRE+ (N and P) at 3 and 5 months of age with Iba1 antibody. (Q) Quantification of % macrophages of total cell number in DRG tissues. (R) Quantification of percentage of macrophages at 3 and 5 months in NF2fl/fl-CRE- and NF2fl/fl-CRE+ VG tissue. For data presented, n = 3 mice for each genotype and age. Data presented in graphs are means ± SEM; in Q and R, two-way ANOVA was used with Tukey’s multiple comparison test. *P < 0.05; **P < 0.01; ***P < 0.001. Scale bars = 25 μm.
Figure 5
Figure 5
Knockdown of either YAP or TAZ or use of TEAD auto-palmitoylation inhibitors inhibits human schwannoma cell proliferation. (AG) Lentiviral knockdown of either YAP or TAZ significantly reduces proliferation of human NF2-null schwannoma cells. (AC) Representative images of EdU-positive cells, counterstained with Hoechst (Ho) from scrambled control (Scr, A), YAP knockdown (shYAP, B) and TAZ knockdown (shTAZ, C). (D) Quantification of percentage positive EdU cells for each condition. (EG) Western blot (E) and quantification (F and G) confirming YAP or TAZ knockdown in cells; note that knockdown of TAZ does not significantly affect levels of YAP (F), but knockdown of YAP does significantly lower levels of TAZ (G). (HK) TEAD auto-palmitoylation inhibitor (VT3) decreases human schwannoma cell proliferation in a dose-dependent manner. (L) Expression of four TEAD isoforms (TEAD1–4) in cells from three human schwannoma tumours S1, S2 and S3 treated with either vehicle (left) or 2 μm VT3 for 7 days (VT, right). (M) Quantification of schwannoma cell proliferation with increasing concentrations of auto-palmitoylation inhibitor VT3. N = 3 for all data shown. Data presented in graphs are means ± SEM. Data analysis in D was one-way ANOVA with Bonferroni’s correction, in F and G matched one-way ANOVAs with the Geisser–Greenhouse correction and Tukey’s multiple comparisons test and M one-way ANOVA with Bonferroni’s correction. *P < 0.05; **P < 0.01; ***P < 0.001. Scale bars = 25 μm.
Figure 6
Figure 6
Expression of ALDH1A1 is TAZ-dependent in mouse Schwann cells and schwannoma tissue. (AD) Immunolabelling of NF2fl/fl-CRE- (A and B) and NF2fl/flCRE+ (C and D) sciatic nerve (A and C) and dorsal root ganglion (DRG; B and D) tissue showing elevated expression of ALDH1A1 in NF2-null mouse tissue. In sciatic nerve, ALDH1A1 staining appears associated with the non-myelinating Schwann cells. In DRG, high ALDH1A1 expression was seen in the cells surrounding the neuronal cell bodies. (E) Western blot showing raised ALDH1A1 expression in NF2fl/flCRE+ sciatic nerve, which was reduced in NF2fl/flTAZfl/fl-CRE+ but not NF2fl/flYAPfl/fl-CRE+ animals. (F) Quantification of western blot in E. (GI) Immunolabelling of transverse sections of sciatic nerve, showing elevated ALDH1A1 in NF2fl/fl-CRE+ nerve (H), but reduced in NF2fl/flTAZfl/fl-CRE+ double null nerves (I). (JM) ALDH1A1 staining of DRG tissue paraffin sections from control NF2fl/fl-CRE- (J), NF2fl/fl-CRE+ (K), NF2fl/flYAPfl/fl-CRE+ (L) and NF2fl/flTAZfl/fl-CRE+ (M) double-null mice. (N and O) Representative western blot (N) and quantification (O) of ALDH1A1 expression in sciatic nerve from NF2fl/fl-CRE- and CRE+ vehicle- or VT2-treated mice. For data presented, n = 3 mice for each genotype and age. Data presented in graphs are means ± SEM. In F, for analysis, a one-way ANOVA with Bonferroni’s correction was used. In O, for analysis, a one-way ANOVA with Tukey’s multiple comparisons correction was used. *P < 0.05, **P < 0.01; ns = not significant. Scale bars in AD and GI = 50 μm, JM = 25 μm.
Figure 7
Figure 7
ALDH1A1 is upregulated in human schwannoma and is a TAZ target. (AC) Staining of control human nerve (A) and two human schwannoma samples (B and C) showing strong expression of ALDH1A1 in all tumour cells. (D) Knockdown experiments in human schwannoma cells. Lentiviral-mediated shRNA knockdown of TAZ (shTAZ) reduces ALDH1A1 protein levels in cells; knockdown of ALDH1A1 was used as a positive control. (E) Quantification of western blot data in D. (F) Representative western blot for ALDH1A1 expression in primary human schwannoma cells with either knockdown of TAZ (shTAZ) or scramble control (shSCR), treated with 10 μM MG132 (+MG132) or DMSO vehicle control (−MG132) (F). Note suppression of ALDH1A1 protein levels is not reversed by proteasome inhibition by MG132. (G) Quantification of F. (HJ) Use of ALDH1A1-specific inhibitor reduces proliferation of primary human schwannoma cells. Ki67 stain of vehicle control (H) or 10 μM ALDH1A1 inhibitor 1 (I). (J) Quantification of percentage Ki-67-positive schwannoma cells with increasing concentrations of ALDH1A1 inhibitor 1. For data presented, n = 3. Data presented in graphs are means ± SEM. Statistical analysis shown in E and J is one-way ANOVA with Bonferroni’s correction; in G a one-way ANOVA with Tukey’s multiple comparisons test. *P < 0.05; ***P < 0.001; ns = not significant. Scale bars in AC, H and I = 25 μm.
Figure 8
Figure 8
ALDH1A1 is upregulated in NF2-null human meningioma tissue and cells. (A and B) Staining of sections of NF2-postive (NF2+/+, A) and NF2-null (NF2−/−, B) meningioma tissue shows higher ALDH1A1 in NF2-null tumours. Boxes show enlarged section of the tumour with strong cytoplasmic stain of ALDH1A1 protein. (C) Western blot of control human meningeal cells (HMC), BenMen-1 (BM1) and KT21-MG1 (KT21) meningioma cells showing elevated ALDH1A1 expression in both human NF2-null cell lines. (D) Quantification of western blot in C. (E) Lentiviral shRNA knockdown of YAP or TAZ in BenMen-1 cells showing that ALDH1A1 expression is dependent upon TAZ. (F) Quantification of western blot in E. (GI) ALDH1A1 inhibitor 1 reduces proliferation of BenMen-1 cells. (J) Quantification of percentage Ki-67-positive cells with increasing ALDH1A1 inhibitor concentrations. (KM) Comparison of the effects of shRNA knockdown of ALDH1A1 (L) and TAZ (M) upon cell proliferation in BenMen-1 cells. (N) Quantification of percentage EdU-positive cells. For data presented, n = 3. Data presented in graphs are means ± SEM. Statistical analysis shown is a one-way ANOVA with Bonferroni’s correction. *P < 0.05; **P < 0.01; ***P < 0.001; ns = not significant. Scale bars = 25 μm.

References

    1. Antinheimo J, Sankila R, Carpen O, Pukkala E, Sainio M, Jaaskelainen J. Population-based analysis of sporadic and type 2 neurofibromatosis-associated meningiomas and schwannomas. Neurology. 2000;54:71–76. - PubMed
    1. Ostrom QT, Cioffi G, Waite K, Kruchko C, Barnholtz-Sloan JS. CBTRUS Statistical report: Primary brain and other central nervous system tumors diagnosed in the United States in 2014–2018. Neuro Oncol. 2021;23(12 Suppl 2):iii1–iii105. - PMC - PubMed
    1. Hilton DA, Hanemann CO. Schwannomas and their pathogenesis. Brain Pathol. 2014;24:205–220. - PMC - PubMed
    1. Asthagiri AR, Parry DM, Butman JA, et al. . Neurofibromatosis type 2. Lancet. 2009;373:1974–1986. - PMC - PubMed
    1. Evans DG, Moran A, King A, Saeed S, Gurusinghe N, Ramsden R. Incidence of vestibular schwannoma and neurofibromatosis 2 in the north west of England over a 10-year period: Higher incidence than previously thought. Otol Neurotol. 2005;26:93–97. - PubMed

Publication types

Substances