. 2023 Jan;30(1):204-214.
doi: 10.1111/ene.15575. Epub 2022 Oct 26.

Electroencephalography functional connectivity-A biomarker for painful polyneuropathy

Affiliations

Electroencephalography functional connectivity-A biomarker for painful polyneuropathy

Leah Shafran Topaz et al. Eur J Neurol. 2023 Jan.

Abstract

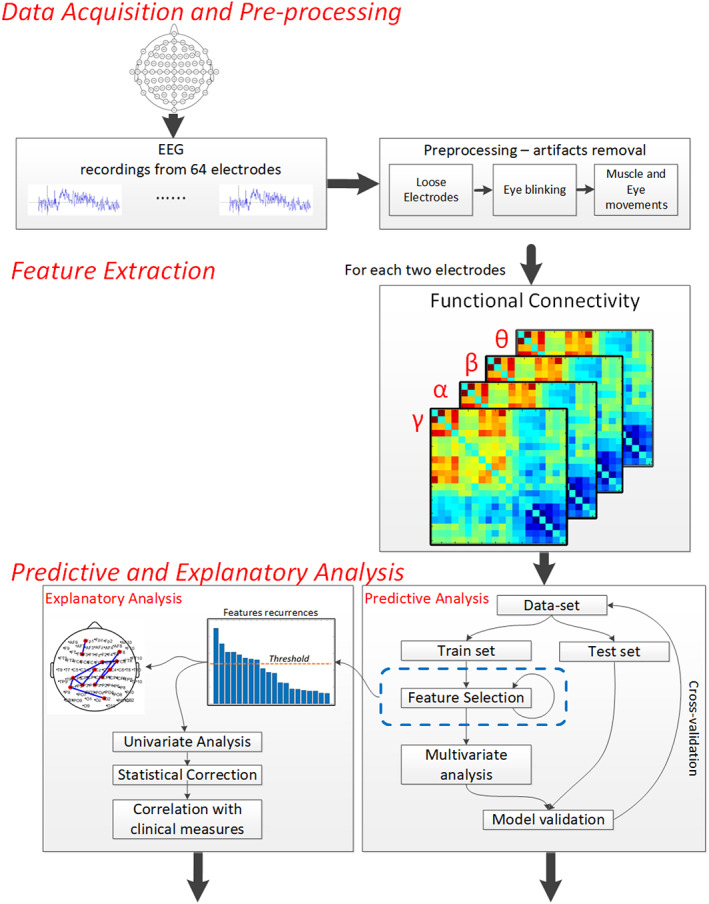
Background and purpose: Advanced analysis of electroencephalography (EEG) data has become an essential tool in brain research. Based solely on resting state EEG signals, a data-driven, predictive and explanatory approach is presented to discriminate painful from non-painful diabetic polyneuropathy (DPN) patients.

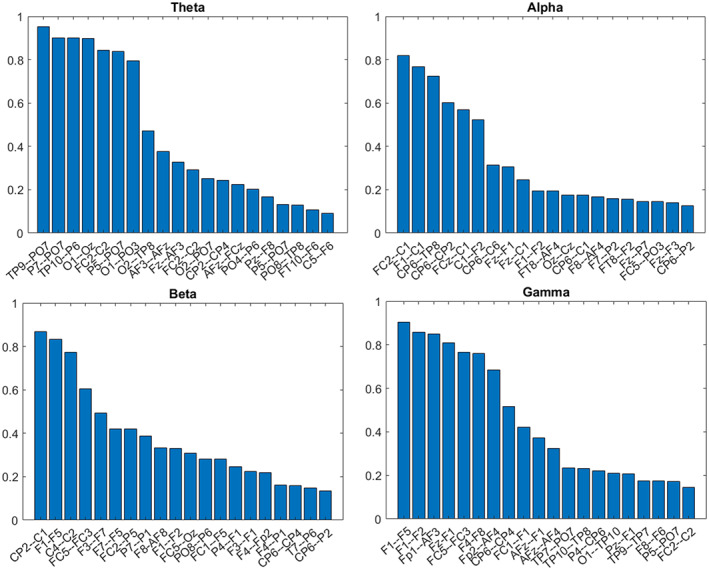
Methods: Three minutes long, 64 electrode resting-state recordings were obtained from 180 DPN patients. The analysis consisted of a mixture of traditional, explanatory and machine learning analyses. First, the 10 functional bivariate connections best differentiating between painful and non-painful patients in each EEG band were identified and the relevant receiver operating characteristic was calculated. Later, those connections were correlated with selected clinical parameters.

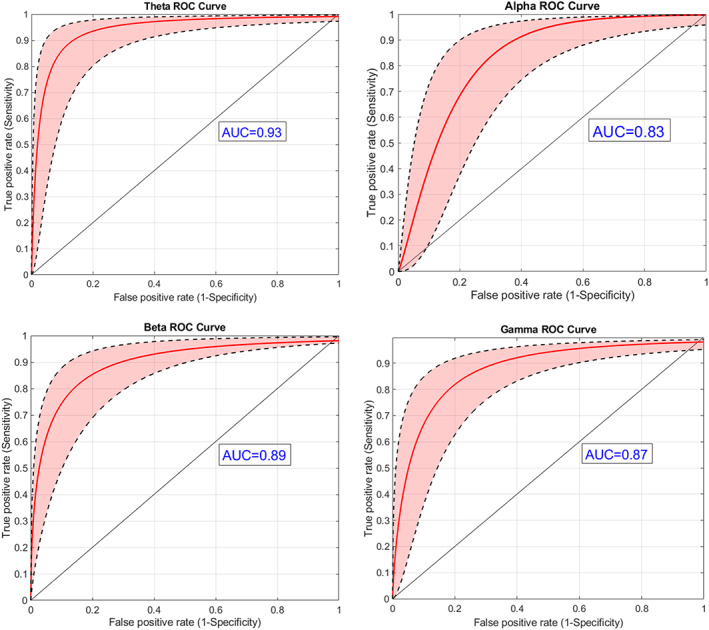
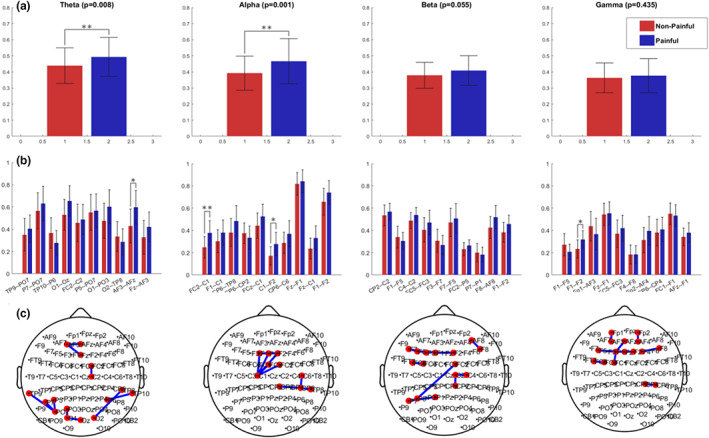
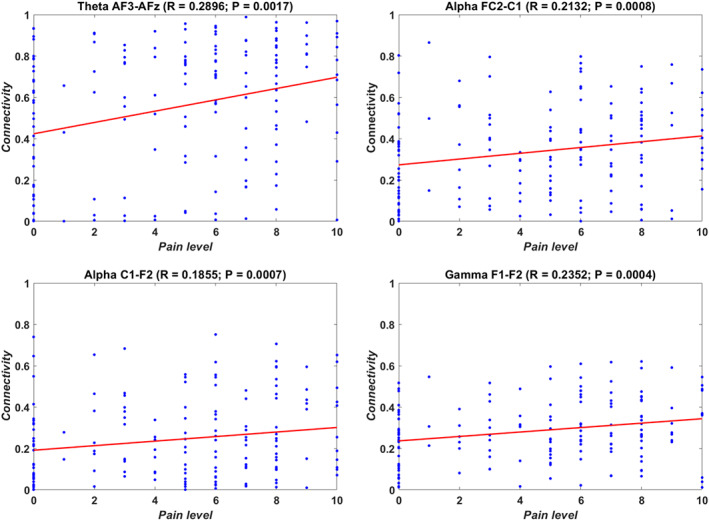
Results: Predictive analysis indicated that theta and beta bands contain most of the information required for discrimination between painful and non-painful polyneuropathy patients, with area under the receiver operating characteristic curve values of 0.93 for theta and 0.89 for beta bands. Assessing statistical differences between the average magnitude of functional connectivity values and clinical pain parameters revealed that painful DPN patients had significantly higher cortical functional connectivity than non-painful ones (p = 0.008 for theta and p = 0.001 for alpha bands). Moreover, intra-band analysis of individual significant functional connections revealed a positive correlation with average reported pain in the previous 3 months in all frequency bands.

Conclusions: Resting state EEG functional connectivity can serve as a highly accurate biomarker for the presence or absence of pain in DPN patients. This highlights the importance of the brain, in addition to the peripheral lesions, in generating the clinical pain picture. This tool can probably be extended to other pain syndromes.

Trial registration: ClinicalTrials.gov NCT02402361.

Keywords: biomarkers for pain; functional connectivity; multivariate analysis; painful polyneuropathy; resting state EEG.


Conflict of interest statement

No authors declare a conflict of interest related to this work.

Figures

FIGURE 1
FIGURE 1
The analysis scheme is composed of three main stages: (i) data acquisition and pre‐processing; (ii) feature extraction, including calculation of functional connectivity values between each possible pair of electrodes for each of the standard frequency bands, using the MSC and applying the ReliefF algorithm to rank the features, aiming to choose the top 10 representing the best informative subset; (iii) predictive analysis—a multivariate analysis and ROC curve representation of the selected functional connections
FIGURE 2
FIGURE 2
Functional connections differentiating between painful and non‐painful diabetic neuropathy patients. The x‐axis represents the selected functional connections, and the y‐axis describes the recurrence (i.e., histogram) of each connection out of 300 reiterations on a 0–1 range. The higher the score, the higher the likelihood of the specific pair being selected in a replicative study. For example, the leftmost column in the alpha range (FC2–C1) represents an 80% chance of being found significant again in similar studies
FIGURE 3
FIGURE 3
Grouping of painful/non‐painful patients based on brain connectivity: ROC analysis (red line), with standard deviation confidence intervals (black broken lines) based on the 10 selected functional connections for each one of the frequency bands. The black diagonal line indicates an AUC of 0.5. It is evident that the theta and beta bands contain most of the information required for discrimination between painful and non‐painful neuropathy patients as reflected in the ROC curve AUC values: 0.93 for the theta band and 0.895 for the beta band. Nevertheless, the discriminability based on alpha and gamma data was relatively high as well, with AUCs of 0.83 and 0.87, respectively
FIGURE 4
FIGURE 4
(a) Average connectivity values of the 10 most differentiating connections for the painful (red) and non‐painful (blue) DPN patients; (b) within‐band particular functional connections average values; (c) the cortical locations of those functional connections. Asterisks indicate significant connections after Bonferroni correction (*p < 0.05; **p < 0.005)
FIGURE 5
FIGURE 5
Correlations between connectivity values of selected electrode couples and average self‐reported pain intensity in the previous 3 months on a numerical pain rating scale

References

    1. Hansen TM, Mark EB, Olesen SS, Gram M, Frøkjær JB, Drewes AM. Characterization of cortical source generators based on electroencephalography during tonic pain. J Pain Res. 2017;10:1401‐1409. doi:10.2147/JPR.S132909 - DOI - PMC - PubMed
    1. Furman AJ, Meeker TJ, Rietschel JC, et al. Cerebral peak alpha frequency predicts individual differences in pain sensitivity. Neuroimage. 2018;167:203‐210. doi:10.1016/J.NEUROIMAGE.2017.11.042 - DOI - PubMed
    1. Pinheiro ES, de Queirós FC, Montoya P, et al. Electroencephalographic patterns in chronic pain: a systematic review of the literature. Schalk G, ed. PLoS ONE. 2016;11(2):e0149085. doi:10.1371/journal.pone.0149085 - DOI - PMC - PubMed
    1. Ploner M, May ES. Electroencephalography and magnetoencephalography in pain research—current state and future perspectives. Pain. 2018;159(2):206‐211. doi:10.1097/j.pain.0000000000001087 - DOI - PubMed
    1. Boord P, Siddall PJ, Tran Y, Herbert D, Middleton J, Craig A. Electroencephalographic slowing and reduced reactivity in neuropathic pain following spinal cord injury. Spinal Cord. 2008;46(2):118‐123. doi:10.1038/SJ.SC.3102077 - DOI - PubMed

Publication types

Associated data