Microenvironment components and spatially resolved single-cell transcriptome atlas of breast cancer metastatic axillary lymph nodes
- PMID: 36148946
- PMCID: PMC9828062
- DOI: 10.3724/abbs.2022131
Microenvironment components and spatially resolved single-cell transcriptome atlas of breast cancer metastatic axillary lymph nodes
Abstract
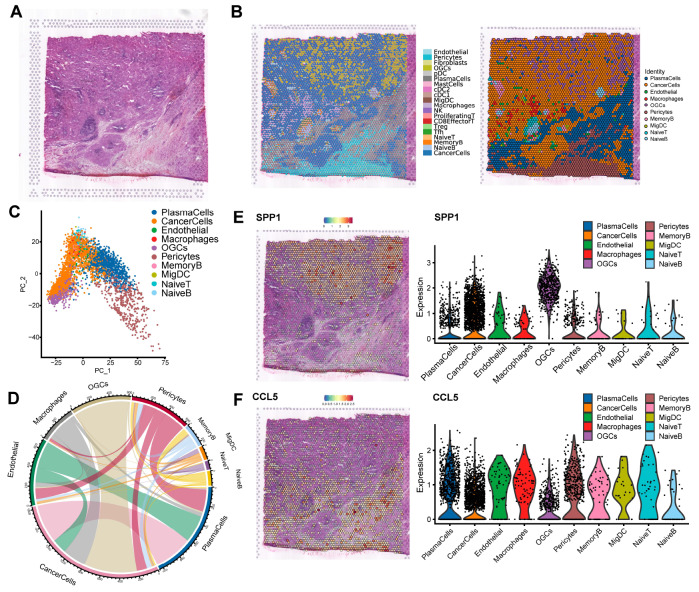
As an indicator of clinical prognosis, lymph node metastasis of breast cancer has drawn great attention. Many reports have revealed the characteristics of metastatic breast cancer cells, however, the effect of breast cancer cells on the microenvironment components of lymph nodes and spatial transcriptome atlas remains unclear. In this study, by integrating single-cell RNA sequencing (scRNA-seq) and spatial transcriptomics, we investigate the transcriptional profiling of six surgically excised lymph node samples and the spatial organization of one positive lymph node. We identify the existence of osteoclast-like giant cells (OGC) which have high expressions of CD68 and CD163, the biomarkers of tumor-associated macrophages (TAMs). Through a spatially resolved transcriptomic method, we find that OGCs are scattered among metastatic breast cancer cells. In the lymph node microenvironment with breast cancer cell infiltration, TAMs are enriched in protumoral pathways including NF-κB signaling pathways and NOD-like receptor signaling pathways. Further subclustering demonstrates the potential differentiation trajectory in which macrophages develop from a state of active chemokine production to a state of active lymphocyte activation. This study is the first to integrate scRNA-seq and spatial transcriptomics in the tumor microenvironment of axillary lymph nodes, offering a systematic approach to delve into breast cancer lymph node metastasis.
Keywords: breast cancer; metastasis; microenvironment; single-cell RNA sequencing; spatial transcriptomics.
Conflict of interest statement
The authors declare that they have no conflict of interest.
Figures


Similar articles
-
Intra-patient spatial comparison of non-metastatic and metastatic lymph nodes reveals the reduction of CD169+ macrophages by metastatic breast cancers.EBioMedicine. 2024 Sep;107:105271. doi: 10.1016/j.ebiom.2024.105271. Epub 2024 Aug 21. EBioMedicine. 2024. PMID: 39173531 Free PMC article.
-
Single-cell profiling transcriptomic reveals cellular heterogeneity and cellular crosstalk in breast cancer lymphatic node, bone, and brain metastases.Sci Rep. 2025 Jan 17;15(1):2217. doi: 10.1038/s41598-025-85531-z. Sci Rep. 2025. PMID: 39820531 Free PMC article.
-
Single-cell and spatial transcriptomics reveal metastasis mechanism and microenvironment remodeling of lymph node in osteosarcoma.BMC Med. 2024 May 17;22(1):200. doi: 10.1186/s12916-024-03319-w. BMC Med. 2024. PMID: 38755647 Free PMC article.
-
[Multi-omics prediction of lymph node metastasis status in breast cancer].Zhonghua Zhong Liu Za Zhi. 2024 May 23;46(5):391-398. doi: 10.3760/cma.j.cn112152-20230822-00093. Zhonghua Zhong Liu Za Zhi. 2024. PMID: 38742352 Review. Chinese.
-
The lymph node microenvironment and its role in the progression of metastatic cancer.Semin Cell Dev Biol. 2015 Feb;38:98-105. doi: 10.1016/j.semcdb.2015.01.008. Epub 2015 Jan 22. Semin Cell Dev Biol. 2015. PMID: 25620792 Free PMC article. Review.
Cited by
-
ReCIDE: robust estimation of cell type proportions by integrating single-reference-based deconvolutions.Brief Bioinform. 2024 Jul 25;25(5):bbae422. doi: 10.1093/bib/bbae422. Brief Bioinform. 2024. PMID: 39177263 Free PMC article.
-
Ultrasound-responsive spherical nucleic acid against c-Myc/PD-L1 to enhance anti-tumoral macrophages in triple-negative breast cancer progression.Sci China Life Sci. 2024 Apr;67(4):698-710. doi: 10.1007/s11427-023-2433-y. Epub 2023 Nov 30. Sci China Life Sci. 2024. PMID: 38151609
-
Spatial transcriptomics in breast cancer: providing insight into tumor heterogeneity and promoting individualized therapy.Front Immunol. 2024 Dec 19;15:1499301. doi: 10.3389/fimmu.2024.1499301. eCollection 2024. Front Immunol. 2024. PMID: 39749323 Free PMC article. Review.
-
The Dose Rate of Corpuscular Ionizing Radiation Strongly Influences the Severity of DNA Damage, Cell Cycle Progression and Cellular Senescence in Human Epidermoid Carcinoma Cells.Curr Issues Mol Biol. 2024 Dec 6;46(12):13860-13880. doi: 10.3390/cimb46120828. Curr Issues Mol Biol. 2024. PMID: 39727956 Free PMC article.
-
Single-cell transcriptomics provide insight into metastasis-related subsets of breast cancer.Breast Cancer Res. 2023 Oct 19;25(1):126. doi: 10.1186/s13058-023-01728-y. Breast Cancer Res. 2023. PMID: 37858183 Free PMC article. Review.
References
-
- Sung H, Ferlay J, Siegel RL, Laversanne M, Soerjomataram I, Jemal A, Bray F. Global cancer statistics 2020: GLOBOCAN estimates of incidence and mortality worldwide for 36 cancers in 185 countries. CA Cancer J Clin. . 2021;71:209–249. doi: 10.3322/caac.21660. - DOI - PubMed
-
- Bartelink H, Horiot JC, Poortmans P, Struikmans H, Van den Bogaert W, Barillot I, Fourquet A, et al. Recurrence rates after treatment of breast cancer with standard radiotherapy with or without additional radiation. N Engl J Med. . 2001;345:1378–1387. doi: 10.1056/NEJMoa010874. - DOI - PubMed
-
- Pesce C, Morrow M. The need for lymph node dissection in nonmetastatic breast cancer. Annu Rev Med. . 2013;64:119–129. doi: 10.1146/annurev-med-052511-135500. - DOI - PubMed
-
- de Boer M, van Dijck JAAM, Bult P, Borm GF, Tjan-Heijnen VCG. Breast cancer prognosis and occult lymph node metastases, isolated tumor cells, and micrometastases. JNCI J Natl Cancer Institute. . 2010;102:410–425. doi: 10.1093/jnci/djq008. - DOI - PubMed
-
- Hinshaw DC, Shevde LA. The tumor microenvironment innately modulates cancer progression. Cancer Res. . 2019;79:4557–4566. doi: 10.1158/0008-5472.CAN-18-3962. - DOI - PMC - PubMed
MeSH terms
LinkOut - more resources
Full Text Sources
Medical
Molecular Biology Databases
Research Materials