Review
. 2022 Oct;28(10):1955-1969.
doi: 10.3201/eid2810.220391.

Demographic and Socioeconomic Factors Associated with Fungal Infection Risk, United States, 2019

Review

Demographic and Socioeconomic Factors Associated with Fungal Infection Risk, United States, 2019

Emily Rayens et al. Emerg Infect Dis. 2022 Oct.

Abstract

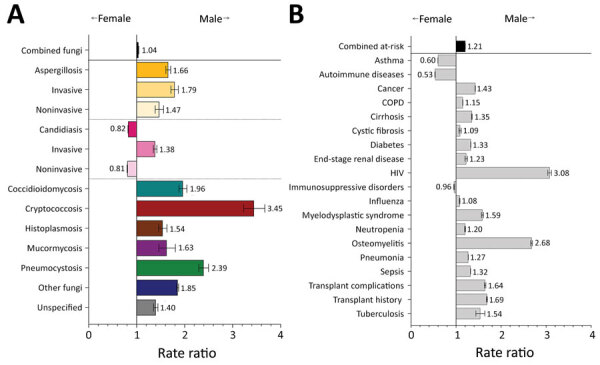
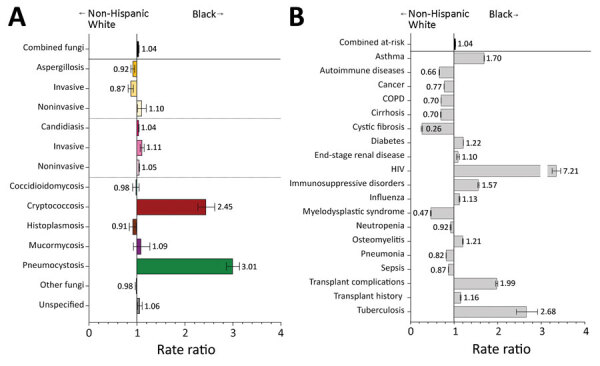
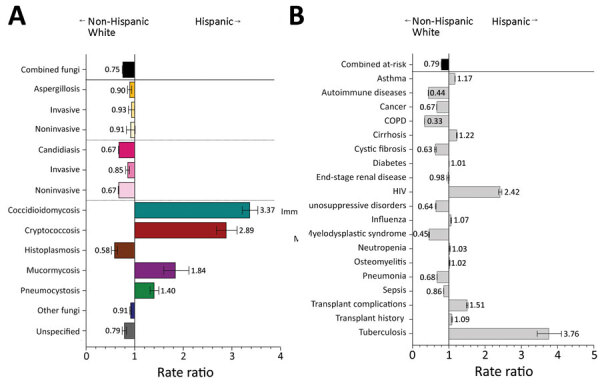
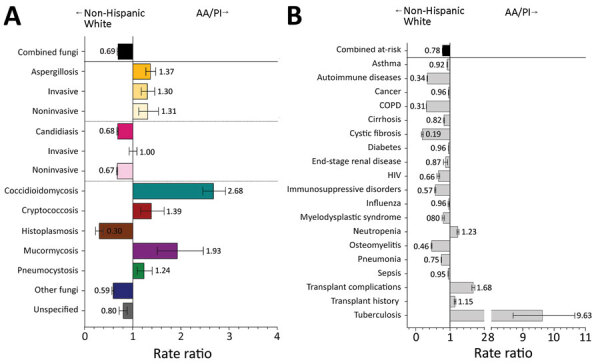
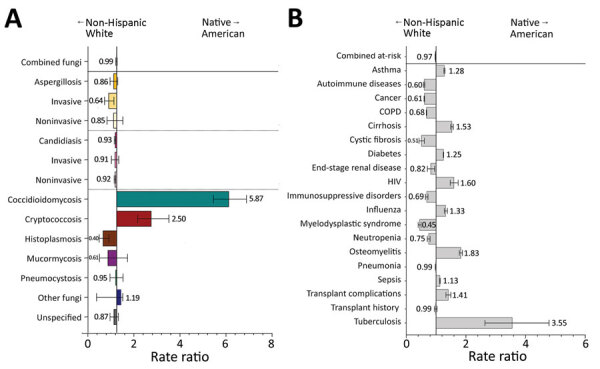
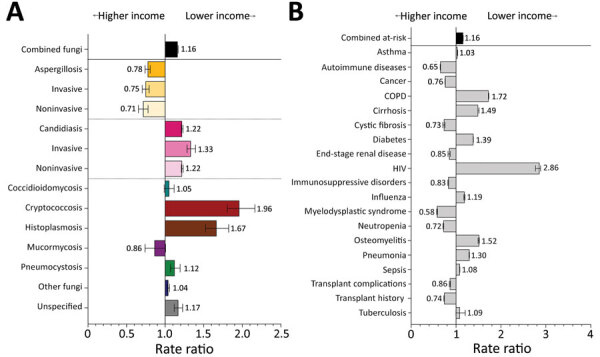
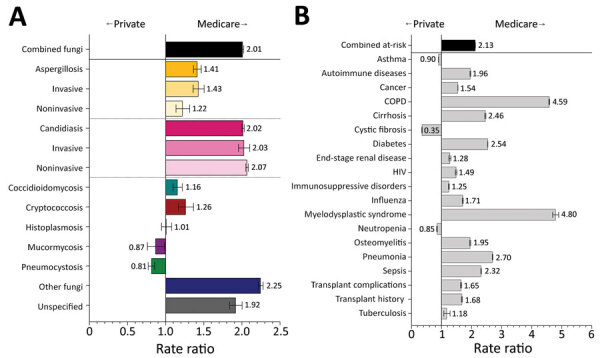
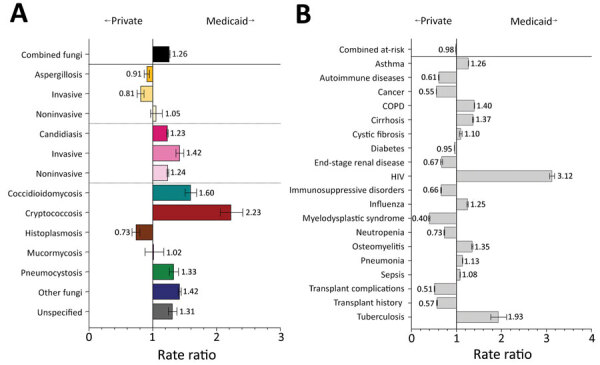
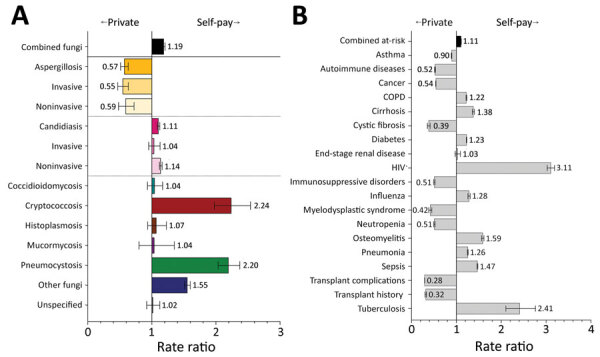
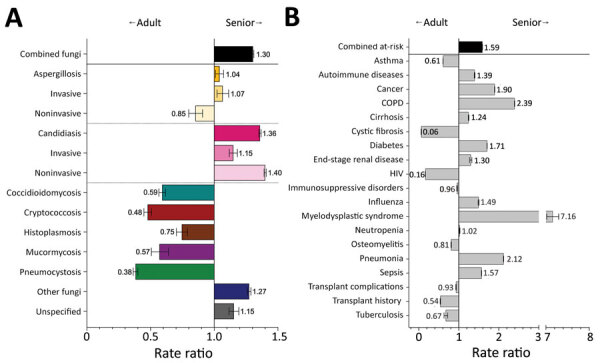
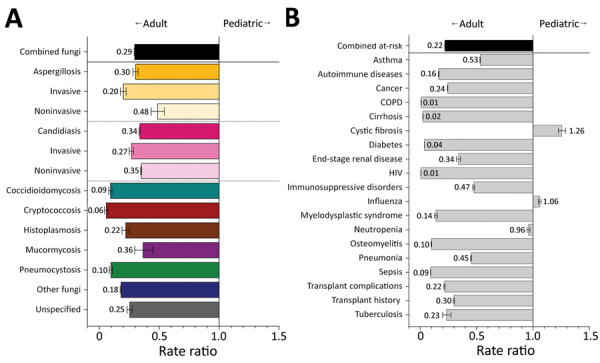
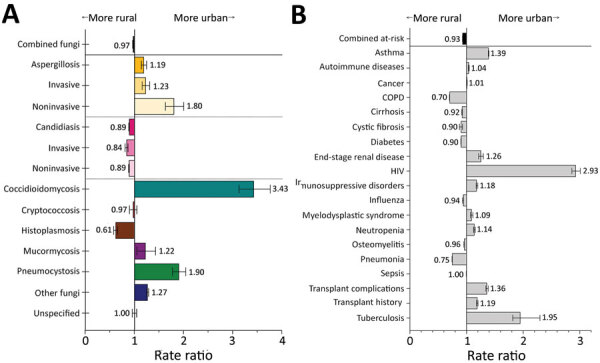
Fungal infections cause substantial rates of illness and death. Interest in the association between demographic factors and fungal infections is increasing. We analyzed 2019 US hospital discharge data to assess factors associated with fungal infection diagnosis, including race and ethnicity and socioeconomic status. We found male patients were 1.5–3.5 times more likely to have invasive fungal infections diagnosed than were female patients. Compared with hospitalizations of non-Hispanic White patients, Black, Hispanic, and Native American patients had 1.4–5.9 times the rates of cryptococcosis, pneumocystosis, and coccidioidomycosis. Hospitalizations associated with lower-income areas had increased rates of all fungal infections, except aspergillosis. Compared with younger patients, fungal infection diagnosis rates, particularly for candidiasis, were elevated among persons >65 years of age. Our findings suggest that differences in fungal infection diagnostic rates are associated with demographic and socioeconomic factors and highlight an ongoing need for increased physician evaluation of risk for fungal infections.

Keywords: Fungi; United States; health care costs; healthcare disparities; minority health; mycoses; social class; socioeconomic factors.


Figures

Figure 1
Figure 1
Comparison of rate ratios for fungal infections and risk conditions by sex among hospitalized patients, United States, 2019. A) Diagnosed fungal infections; B) risk conditions. Bars and numerals indicated rate ratios; error bars indicate 95% CIs. COPD, chronic obstructive pulmonary disease.
Figure 2
Figure 2
Comparison of rate ratios for fungal infections and risk conditions among non-Hispanic White and Black hospitalized patients, United States, 2019. A) Diagnosed fungal infections; B) risk conditions. Bars and numerals indicated rate ratios; error bars indicate 95% CIs. COPD, chronic obstructive pulmonary disease.
Figure 3
Figure 3
Comparison of rate ratios for fungal infections and risk conditions among hospitalized non-Hispanic White and Hispanic patients, United States, 2019. A) Diagnosed fungal infections; B) risk conditions. Bars and numerals indicated rate ratios; error bars indicate 95% CIs. COPD, chronic obstructive pulmonary disease.
Figure 4
Figure 4
Comparison of rate ratios for fungal infections and risk conditions among hospitalized non-Hispanic White and AA/PI patients, United States, 2019. A) Diagnosed fungal infections; B) risk conditions. Bars and numerals indicated rate ratios; error bars indicate 95% CIs. AA/PI, Asian American/Pacific Islander; COPD, chronic obstructive pulmonary disease.
Figure 5
Figure 5
Comparison of rate ratios for fungal infections and risk conditions among hospitalized non-Hispanic White and Native American patients, United States, 2019. A) Diagnosed fungal infections; B) risk conditions. Bars and numerals indicated rate ratios; error bars indicate 95% CIs. COPD, chronic obstructive pulmonary disease.
Figure 6
Figure 6
Comparison of rate ratios for fungal infections and risk conditions by income among hospitalized patients, United States, 2019. A) Diagnosed fungal infections; B) risk conditions. Income levels were determined by postal code; patients from postal codes with incomes in the highest quartile were compared with patients from postal codes with incomes in the lowest quartile. Bars and numerals indicated rate ratios; error bars indicate 95% CIs. COPD, chronic obstructive pulmonary disease.
Figure 7
Figure 7
Comparison of rate ratios for fungal infections and risk conditions by billing type (private insurance vs. Medicare) among hospitalized patients, United States, 2019. A) Diagnosed fungal infections; B) risk conditions. Bars and numerals indicated rate ratios; error bars indicate 95% CIs. COPD, chronic obstructive pulmonary disease.
Figure 8
Figure 8
Comparison of rate ratios for fungal infections and risk conditions by billing type (private insurance vs. Medicaid) among hospitalized patients, United States, 2019. A) Diagnosed fungal infections; B) risk conditions. Bars and numerals indicated rate ratios; error bars indicate 95% CIs. COPD, chronic obstructive pulmonary disease.
Figure 9
Figure 9
Comparison of rate ratios for fungal infections and risk conditions by billing type (private insurance vs. self-pay) among hospitalized patients, United States, 2019. A) Diagnosed fungal infections; B) risk conditions. Bars and numerals indicated rate ratios; error bars indicate 95% CIs. COPD, chronic obstructive pulmonary disease.
Figure 10
Figure 10
Comparison of rate ratios for fungal infections and risk conditions among adult and senior hospitalized patients, United States, 2019. A) Diagnosed fungal infections; B) risk conditions. Adult patients are persons 18–64 years of age; senior patients are >65 years of age. Bars and numerals indicated rate ratios; error bars indicate 95% CIs. COPD, chronic obstructive pulmonary disease.
Figure 11
Figure 11
Comparison of rate ratios for fungal infections and risk conditions among adult and pediatric hospitalized patients, United States, 2019. A) Diagnosed fungal infections; B) risk conditions. Adult patients are persons 18–64 years of age; pediatric patients are <17 years of age. Bars and numerals indicated rate ratios; error bars indicate 95% CIs. COPD, chronic obstructive pulmonary disease.
Figure 12
Figure 12
Comparison of rate ratios for fungal infections and risk conditions by residential location (urban vs. rural) among hospitalized patients, United States, 2019. A) Diagnosed fungal infections; B) risk conditions. Persons from more urban settings are considered those whose resident county has a population >50,000. Bars and numerals indicated rate ratios; error bars indicate 95% CIs. COPD, chronic obstructive pulmonary disease.

Similar articles

Cited by

References

    1. Bongomin F, Gago S, Oladele RO, Denning DW. Global and multi-national prevalence of fungal diseases–estimate precision. J Fungi (Basel). 2017;3:57. 10.3390/jof3040057 - DOI - PMC - PubMed
    1. Rayens E, Norris KA. Prevalence and healthcare burden of fungal infections in the United States, 2018. Open Forum Infect Dis. 2022;9:ofab593. - PMC - PubMed
    1. Rayens E, Norris KA, Cordero JF. Mortality trends in risk conditions and invasive mycotic disease in the United States, 1999–2018. Clin Infect Dis. 2022;74:309–18. 10.1093/cid/ciab336 - DOI - PMC - PubMed
    1. Morris A, Netravali M, Kling HM, Shipley T, Ross T, Sciurba FC, et al. Relationship of pneumocystis antibody response to severity of chronic obstructive pulmonary disease. Clin Infect Dis. 2008;47:e64–8. 10.1086/591701 - DOI - PMC - PubMed
    1. Pilmis B, Puel A, Lortholary O, Lanternier F. New clinical phenotypes of fungal infections in special hosts. Clin Microbiol Infect. 2016;22:681–7. 10.1016/j.cmi.2016.05.016 - DOI - PubMed

Publication types