

Internal noise measures in coarse and fine motion direction discrimination tasks and the correlation with autism traits
- PMID: 36149675
- PMCID: PMC9520516
- DOI: 10.1167/jov.22.10.19
Internal noise measures in coarse and fine motion direction discrimination tasks and the correlation with autism traits
Abstract
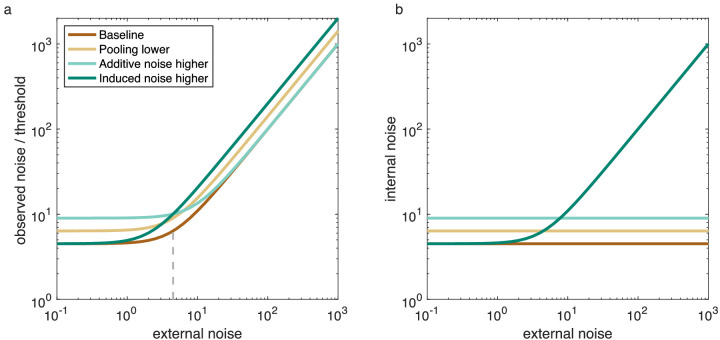
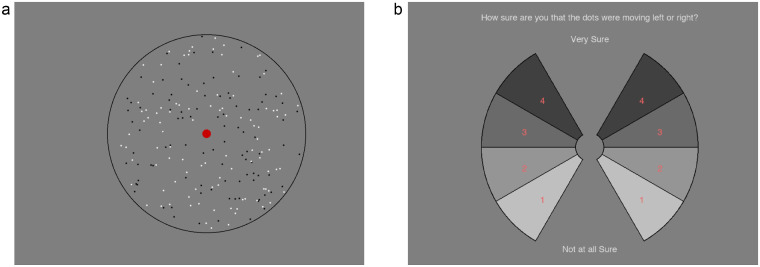
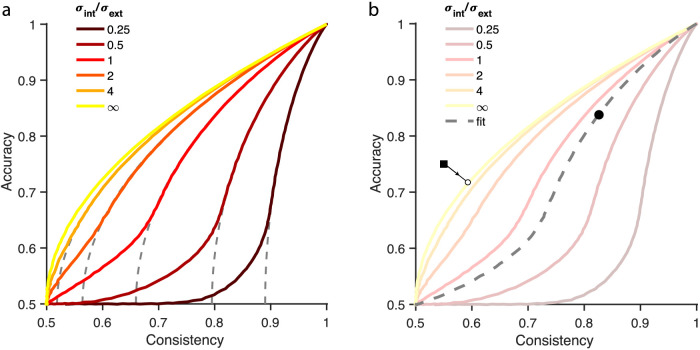
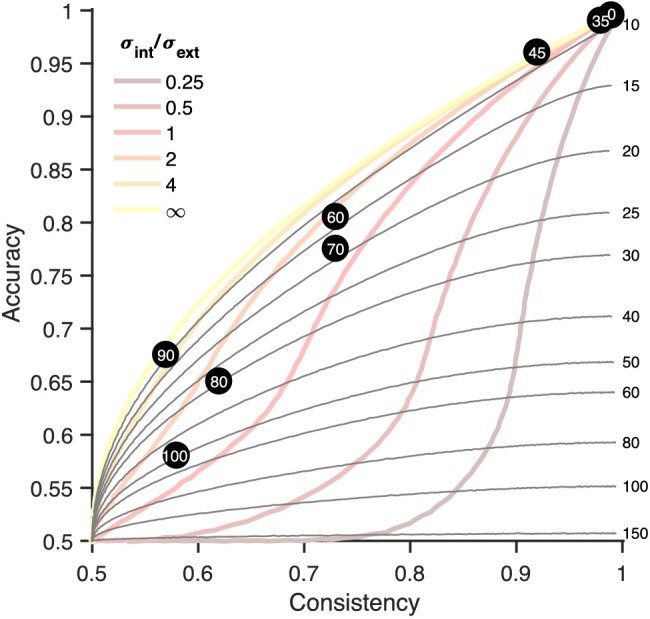
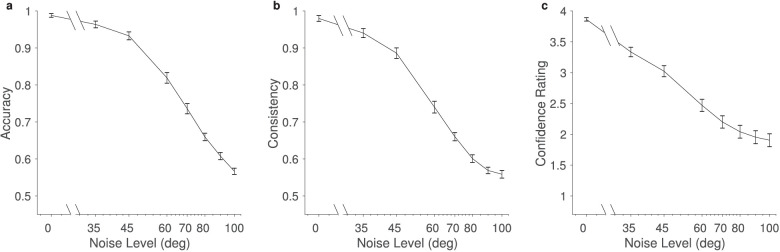
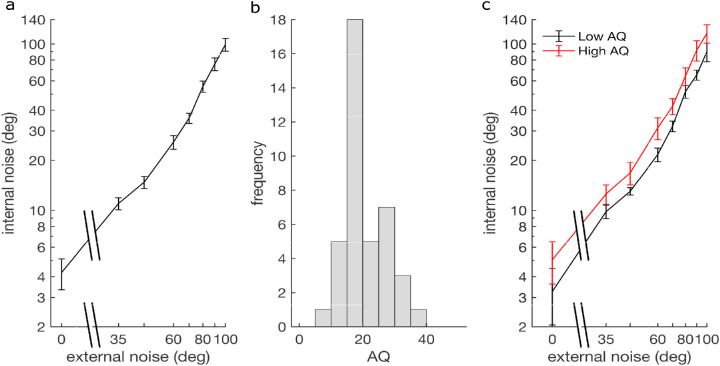
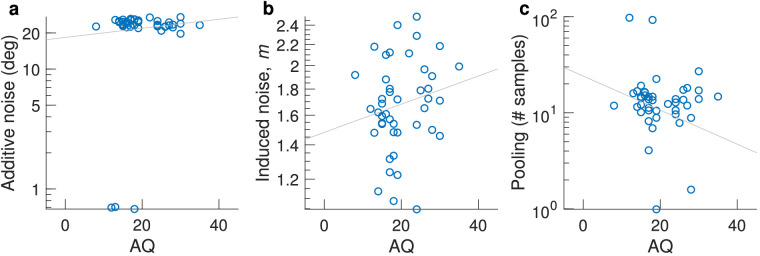
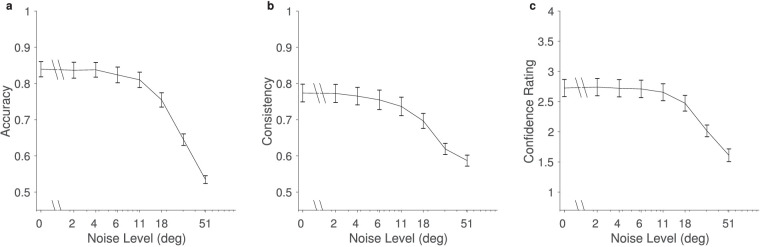
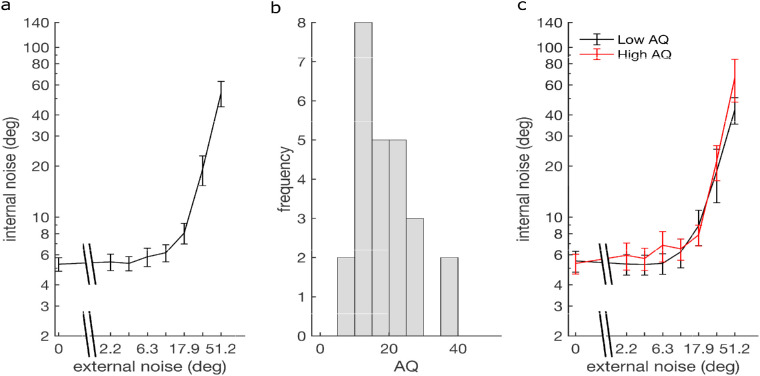
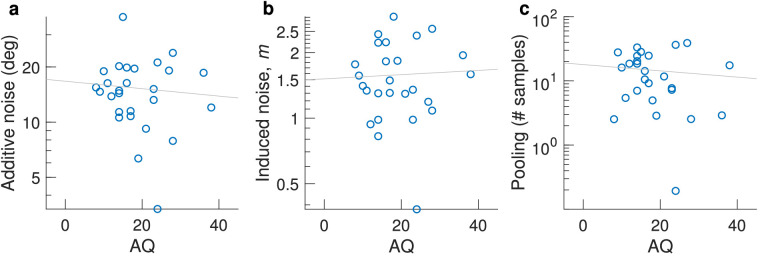
Motion perception is essential for visual guidance of behavior and is known to be limited by both internal additive noise (i.e., a constant level of random fluctuations in neural activity independent of the stimulus) and motion pooling (global integration of local motion signals across space). People with autism spectrum disorder (ASD) display abnormalities in motion processing, which have been linked to both elevated noise and abnormal pooling. However, to date, the impact of a third limit-induced internal noise (internal noise that scales up with increases in external stimulus noise)-has not been investigated in motion perception of any group. Here, we describe an extension on the double-pass paradigm to quantify additive noise and induced noise in a motion paradigm. We also introduce a new way to experimentally estimate motion pooling. We measured the impact of induced noise on direction discrimination, which we ascribe to fluctuations in decision-related variables. Our results are suggestive of higher internal noise in individuals with high ASD traits only on coarse but not fine motion direction discrimination tasks. However, we report no significant correlations between autism traits and additive noise, induced noise, or motion pooling in either task. We conclude that, under some conditions, the internal noise may be higher in individuals with pronounced ASD traits and that the assessment of induced internal noise is a useful way of exploring decision-related limits on motion perception, irrespective of ASD traits.
Figures
Similar articles
-
How the External Visual Noise Affects Motion Direction Discrimination in Autism Spectrum Disorder.Behav Sci (Basel). 2022 Apr 18;12(4):113. doi: 10.3390/bs12040113. Behav Sci (Basel). 2022. PMID: 35447685 Free PMC article.
-
Self-motion perception in autism is compromised by visual noise but integrated optimally across multiple senses.Proc Natl Acad Sci U S A. 2015 May 19;112(20):6461-6. doi: 10.1073/pnas.1506582112. Epub 2015 May 4. Proc Natl Acad Sci U S A. 2015. PMID: 25941373 Free PMC article.
-
Enhanced integration of motion information in children with autism.J Neurosci. 2015 May 6;35(18):6979-86. doi: 10.1523/JNEUROSCI.4645-14.2015. J Neurosci. 2015. PMID: 25948250 Free PMC article. Clinical Trial.
-
The effects of high-frequency transcranial random noise stimulation (hf-tRNS) on global motion processing: An equivalent noise approach.Brain Stimul. 2018 Nov-Dec;11(6):1263-1275. doi: 10.1016/j.brs.2018.07.048. Epub 2018 Jul 25. Brain Stimul. 2018. PMID: 30078542
-
Vagaries of visual perception in autism.Neuron. 2005 Nov 3;48(3):497-507. doi: 10.1016/j.neuron.2005.10.018. Neuron. 2005. PMID: 16269366 Review.
Cited by
-
Does stochastic resonance improve performance for individuals with higher autism-spectrum quotient?Front Neurosci. 2023 Apr 14;17:1110714. doi: 10.3389/fnins.2023.1110714. eCollection 2023. Front Neurosci. 2023. PMID: 37123379 Free PMC article.
-
How do humans give confidence? A comprehensive comparison of process models of perceptual metacognition.J Exp Psychol Gen. 2024 Mar;153(3):656-688. doi: 10.1037/xge0001524. Epub 2023 Dec 14. J Exp Psychol Gen. 2024. PMID: 38095983 Free PMC article.
-
High neural noise in autism: A hypothesis currently at the nexus of explanatory power.Heliyon. 2024 Nov 29;10(23):e40842. doi: 10.1016/j.heliyon.2024.e40842. eCollection 2024 Dec 15. Heliyon. 2024. PMID: 39687175 Free PMC article. Review.
-
No gender difference in confidence or metacognitive ability in perceptual decision-making.iScience. 2024 Nov 12;27(12):111375. doi: 10.1016/j.isci.2024.111375. eCollection 2024 Dec 20. iScience. 2024. PMID: 39660052 Free PMC article.
-
Visual processing and decision-making in autism and dyslexia: Insights from cross-syndrome approaches.Q J Exp Psychol (Hove). 2024 Oct;77(10):1937-1948. doi: 10.1177/17470218241264627. Epub 2024 Jul 27. Q J Exp Psychol (Hove). 2024. PMID: 38876999 Free PMC article. Review.
References
-
- Asperger, H. (1944). Die “Autistischen Psychopathen” im Kindesalter. Archiv für Psychiatrie und Nervenkrankheiten , 117(1), 76–136.
-
- Baron-Cohen, S., Wheelwright, S., Skinner, R., Martin, J., & Clubley, E. (2001). The autism-spectrum quotient (AQ): Evidence from Asperger syndrome/high-functioning autism, males and females, scientists and mathematicians. Journal of Autism and Developmental Disorders , 31(1), 5–17. - PubMed
-
- Bertone, A., Mottron, L., Jelenic, P., & Faubert, J. (2005). Enhanced and diminished visuo-spatial information processing in autism depends on stimulus complexity. Brain , 128(10), 2430–2441. - PubMed
