. 2022 Sep;12(9):e1045.
doi: 10.1002/ctm2.1045.

NAT10: An RNA cytidine transferase regulates fatty acid metabolism in cancer cells

Affiliations

NAT10: An RNA cytidine transferase regulates fatty acid metabolism in cancer cells

Mahmood Hassan Dalhat et al. Clin Transl Med. 2022 Sep.

Abstract

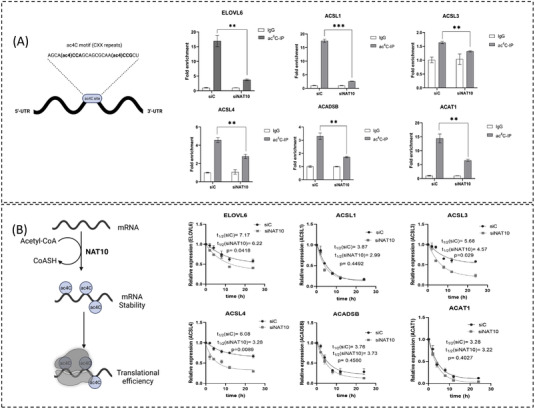
Background: N-4 cytidine acetylation (ac4C) is an epitranscriptomics modification catalyzed by N-acetyltransferase 10 (NAT10); important for cellular mRNA stability, rRNA biogenesis, cell proliferation and epithelial to mesenchymal transition (EMT). However, whether other crucial pathways are regulated by NAT10-dependent ac4C modification in cancer cells remains unclear. Therefore, in this study, we explored the impact of NAT10 depletion in cancer cells using unbiased RNA-seq.

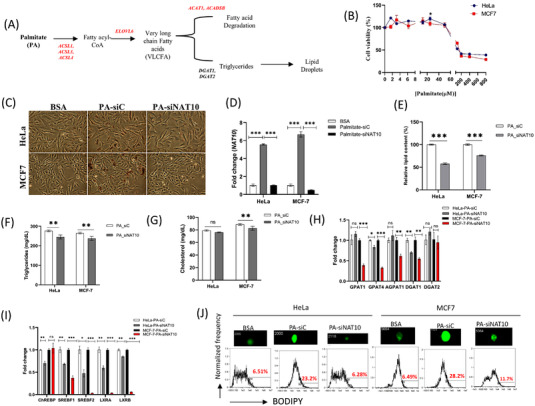
Methods: High-throughput sequencing of knockdown NAT10 in cancer cells was conducted to identify enriched pathways. Acetylated RNA immunoprecipitation-seq (acRIP-seq) and RIP-PCR were used to map and determine ac4C levels of RNA. Exogenous palmitate uptake assay was conducted to assess NAT10 knockdown cancer cells using Oil Red O staining and lipid content analysis. Gas-chromatography-tandem mass spectroscopy (GC/MS) was used to perform untargeted lipidomics.

Results: High-throughput sequencing of NAT10 knockdown in cancer cells revealed fatty acid (FA) metabolism as the top enriched pathway through the Kyoto Encyclopedia of Genes and Genomes (KEGG) pathway analysis in differentially downregulated genes. FA metabolic genes such as ELOLV6, ACSL1, ACSL3, ACSL4, ACADSB and ACAT1 were shown to be stabilised via NAT10-dependent ac4C RNA acetylation. Additionally, NAT10 depletion was shown to significantly reduce the levels of overall lipid content, triglycerides and total cholesterol. Further, NAT10 depletion in palmitate-loaded cancer cells showed decrease in ac4C levels across the RNA transcripts of FA metabolic genes. In untargeted lipidomics, 496 out of 2 279 lipids were statistically significant in NAT10 depleted cancer cells, of which pathways associated with FA metabolism are the most enriched.

Conclusions: Conclusively, our results provide novel insights into the impact of NAT10-mediated ac4C modification as a crucial regulatory factor during FA metabolism and showed the benefit of targeting NAT10 for cancer treatment.

Keywords: NAT10; ac4C; cancer; fatty acid metabolism.


Conflict of interest statement

The authors declare that there is no conflict of interest that could be perceived as prejudicing the impartiality of the research reported.

Figures

FIGURE 1
FIGURE 1
Impact of NAT10 expression in cancer survival. (A) NAT10 expression across different cancer types in TCGA datasets. Bars in blue represent normal tissues and red bars represent tumor tissues. (B) NAT10 RNA expression in HeLa and MCF7 from the human protein atlas. (C) Morphology of HeLa and MCF7 after 24 h transfection with NAT10 siRNA using Nikon microscope at X10 magnification. (D) NAT10 expression levels expression in HeLa and MCF7 after 24 h transfection with NAT10 siRNA. (E) Representation anti‐ac4C dot blot performed on total RNA with methylene as loading control. (F) Cell viability of HeLa and MCF7. Each bar represents cell viability levels after 24 h transfection with NAT10 siRNA. (G) Cell survival genes expression post NAT10 knockdown. All data are represented as mean ± SEM (n = 3). **p < .01; ***p < .001; and ns > .05.
FIGURE 2
FIGURE 2
Transcriptome‐wide studies of NAT10 Knockdown MCF7 cells. (A) Heatmap showing expression pattern of genes in MCF7 post transfected with NAT10 siRNA. (B) Scattered plot of deferentially genes of siNAT10 vs. siC in RNA‐seq. (C) Volcano plot showing positions of differentially upregulated and downregulated genes in MCF7 post transfected with NAT10 siRNA. (D) Bubble plot demonstrating the KEGG pathway analysis of MCF7 post transfected with NAT10 siRNA. (E) Network analysis of fatty acid metabolic genes. (F) Validation of the expression levels of fatty acid metabolic genes with RT‐PCR. Bars are represented as mean ± SEM (n = 3). *p < .05; **p < .01; ***p < .001; and ns > .05.
FIGURE 3
FIGURE 3
NAT10 regulates stability of fatty acid metabolic genes in ac4C dependent manner. (A) ac4C levels of RNA transcripts in MCF7 24 h after NAT10 knockdown. Error bars are represented as mean ± SEM (n = 3). **p < .01; and ***p < .001. (B) Stability assay of MCF7 24 h after NAT10 knockdown followed by treatment with actinomycin D. Analyses were performed using one‐phase decay in Graphpad prism version 8.0.1. p‐Value of ≤.05 are considered statistically significant.
FIGURE 4
FIGURE 4
NAT10 regulates palmitate driven lipid accumulation. (A) Schematics of palmitate‐driven lipid accumulation. (B) Cell viability of cells loaded with palmitate after 24 h mean ± SEM (n = 3). (C) Oil red O staining of cells after 24 h loading with 25 μM of palmitate followed by NAT10 knockdown at 24 h, image magnification X40. (D) NAT10 expression levels after 24 h loading with 25 μM of palmitate followed transfection for another 24 h. (E–G) Lipid profile of cells loaded with 25 μM of palmitate followed by NAT10 knockdown at 24 h. (H,I) Gene expression for lipogenic related genes in palmitate loaded cells after knockdown using NAT10 siRNA. (J) Flow cytometery analysis of lipid droplets of cells loaded with palmitate followed by knockdown with NAT10 siRNA. All data are represented as mean ± SEM (n = 3). **p < .01; ***p < .001; and ns > .05.
FIGURE 5
FIGURE 5
Transcriptome‐wide mapping of ac4C in NAT10‐depleted palmitate‐loaded cells. (A) Schematics of acRIP‐seq. (B) Percentages of summits based on location within coding sequence (CDS) or UTRs in acetylated transcripts of palmitate‐loaded control (PA‐siC‐RIP) vs. palmitate loaded with NAT10 knockdown (PA‐siNAT10‐RIP). (C) Enriched motif of ac4C peak from PA‐siNAT10. (D) Pathways identified from differential peaks in PA‐siC vs. PA‐siNAT10. (E) Network analysis showing the protein–protein interaction (PPI) fatty acid metabolic genes related with PA‐siNAT10. (F) Browser view of ac4C peaks in fatty acid metabolic genes; ELOVL6, ACSL1, ACSL3, ACSL4, ACADSB and ACAT1 mapped to the human reference genome.
FIGURE 6
FIGURE 6
NAT10‐dependent ac4C validation acRIP‐seq in NAT10‐depleted palmitate loaded cells. (A) ac4C levels of RNA transcripts in NAT10‐depleted palmitate‐loaded cells. Error bars are represented as mean ± SEM (n = 3). **p < .01; and ***p < .001. (B) Stability assay of MCF7 24 h after NAT10 knockdown followed by treatment with actinomycin D. Analyses were performed using one‐phase decay in Graphpad prism version 8.0.1. p‐Value of ≤.05 are considered statistically significant.
FIGURE 7
FIGURE 7
Impact of NAT10 on lipid metabolism in cancer cells. (A) Cloud plot of lipid features identified in NAT10 knockdown HeLa and MCF7. (B) Principal correlation analysis (PCA) analysis of HeLa and MCF7 transfected with NAT10 siRNA (siNAT10) vs. control (siC). (C) Correlation analysis of lipid species of siNAT10 vs. siC in HeLa and MCF7. (D) Enrichment analysis from lipidomes in NAT10 knockdown HeLa and MCF7. (E) Pathway analysis generated from lipidomes in NAT10 knockdown HeLa and MCF7.
FIGURE 8
FIGURE 8
NAT10 knockdown reduces fatty acid metabolism in cancer cells. The metabolic intermediates showed significant decrease in peak intensities post transfected with NAT10 siRNA. Graph of metabolic intermediates are represented as mean ± SEM (n = 3). **p < .01; ***p < .001; and ns > .05.
FIGURE 9
FIGURE 9
(A) Correlation analysis of fatty acid metabolic genes against NAT10 in breast cancer retrieved from cBioportal webserver. (B) Proposed mechanism of NAT10 as a regulator of fatty acid metabolism through mitochondrial lipid metabolism and lipid droplets formation.

References

    1. Arango D, Sturgill D, Alhusaini N, et al. Acetylation of cytidine in mRNA promotes translation efficiency. Cell. 2018;175:1872‐1886.e24. - PMC - PubMed
    1. Sinclair WR, Arango D, Shrimp JH, et al. Profiling cytidine acetylation with specific affinity and reactivity. ACS Chem Biol. 2017;12:2922‐2926. - PMC - PubMed
    1. Thomas JM, Briney CA, Nance KD, et al. A chemical signature for cytidine acetylation in RNA. J Am Chem Soc. 2018;140:12667‐12670. - PMC - PubMed
    1. Ito S, Akamatsu Yu, Noma A, et al. A single acetylation of 18 S rRNA is essential for biogenesis of the small ribosomal subunit in Saccharomyces cerevisiae . J Biol Chem. 2014;289:26201‐26212. - PMC - PubMed
    1. Ito S, Horikawa S, Suzuki T, et al. Human NAT10 is an ATP‐dependent RNA acetyltransferase responsible for N4‐acetylcytidine formation in 18 S ribosomal RNA (rRNA). J Biol Chem. 2014;289:35724‐35730. - PMC - PubMed

Publication types