. 2022 Sep 23;17(9):e0261800.
doi: 10.1371/journal.pone.0261800. eCollection 2022.

Pose-gait analysis for cetacean biologging tag data

Affiliations

Pose-gait analysis for cetacean biologging tag data

Ding Zhang et al. PLoS One. .

Abstract

Biologging tags are a key enabling tool for investigating cetacean behavior and locomotion in their natural habitat. Identifying and then parameterizing gait from movement sensor data is critical for these investigations, but how best to characterize gait from tag data remains an open question. Further, the location and orientation of a tag on an animal in the field are variable and can change multiple times during a deployment. As a result, the relative orientation of the tag with respect to (wrt) the animal must be determined for analysis. Currently, custom scripts that involve species-specific heuristics tend to be used in the literature. These methods require a level of knowledge and experience that can affect the reliability and repeatability of the analysis. Swimming gait is composed of a sequence of body poses that have a specific spatial pattern, and tag-based measurements of this pattern can be utilized to determine the relative orientation of the tag. This work presents an automated data processing pipeline (and software) that takes advantage of these patterns to 1) Identify relative motion between the tag and animal; 2) Estimate the relative orientation of the tag wrt the animal using a data-driven approach; and 3) Calculate gait parameters that are stable and invariant to animal pose. Validation results from bottlenose dolphin tag data show that the average relative orientation error (tag wrt the body) after processing was within 11 degrees in roll, pitch, and yaw directions. The average precision and recall for detecting instances of relative motion in the dolphin data were 0.87 and 0.89, respectively. Tag data from humpback and beluga whales were then used to demonstrate how the gait analysis can be used to enhance tag-based investigations of movement and behavior. The MATLAB source code and data presented in the paper are publicly available (https://github.com/ding-z/cetacean-pose-gait-analysis.git), along with suggested best practices.


Conflict of interest statement

The authors have declared that no competing interests exist.

Figures

Fig 1
Fig 1
Biologging tags attached to a bottlenose dolphin (MTag, left) and a humpback whale (DTAG, right) along with the associated coordinate systems. Tag and body fixed coordinate systems may not be aligned when initially placed on an animal in the field (right). Further, tag orientation may shift during a deployment. Animal pose estimation requires knowledge about the relative orientation between the tag and animal. Note that a positive pitching angle corresponds to a negative rotation around the body fixed y-axis.
Fig 2
Fig 2. An orientation sphere for a bottlenose dolphin with a biologging tag aligned with the animal’s body.
Each data point represents an acceleration measurement at one time instance during swimming (i.e., one tag data sample) and is clustered into groups labeled ‘flat,’ ‘ascend,’ or ‘descend’ based on measured vertical speed from pressure data. As the animal changes pose, the location of the gravitational acceleration on the sphere also changes. The swimming motion of an animal is composed of a sequence of poses that correspond to areas on the orientation sphere. The top 3 poses illustrate a shallow diving cycle with a neutral roll.
Fig 3
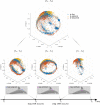
Fig 3. Orientation spheres for a bottlenose dolphin during three sections of a deployment.
In this example, the tag shifted twice, Tb and Tc, respectively. The proposed approach will 1) detect shift instances Tb and Tc, and 2) generate the orientation transformation for each segment to align the tag and body reference frames (i.e., [Ta-Tb], [Tb-Tc], and [Tc-Td]).
Fig 4
Fig 4. Conceptual illustration of determining tag shift time t2 in data segment S2 using data segment S1 as a template.
Segment duration time is Ds = 10 minutes. Data points in S2 are checked against the template distribution (S1) to decide whether they are an inlier (1) or an outlier (0) of the template. Inlier percentage (InPct) is then calculated over time, and the tag shift time is determined by finding when InPct drops below an empirically defined threshold. If t2 does not exist or it is too close to the boundary between S1 and S2, this process is repeated to determine if there is a shift in S1.
Fig 5
Fig 5. Tag shift detection algorithm.
Each branch is marked by a circled number (1 to 12) to aid discussion in the text.
Fig 6
Fig 6
Orientation spheres for a data segment of a bottlenose dolphin (left column) and a humpback whale (right column). The plots provide a visualization of the orientation correction method applied to an uncorrected data segment to find the dominant directions in the tag’s coordinates (bottom row). The prevailing directions can then be mapped to their assumed directions in the body coordinate frame (top row).
Fig 7
Fig 7. Average precision and recall of tag shift detection (left) and the average absolute error of the calculated animal pose after tag orientation correction (right) over simulated tag shifts with random direction and fixed degrees (x-axis).
SD denotes the average of the standard deviation values for roll, pitch, and yaw at each offset increment.
Fig 8
Fig 8. Average precision (left) and recall (right) of tag shift detection performance during simulation plotted against a varying number of injected shifts (or equivalently, the average shift interval).
Shift detection performance at specific segment durations (Ds) is demonstrated by the individual curves in the plot.
Fig 9
Fig 9
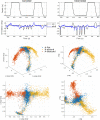
Representative data from a humpback whale, with the tag’s orientation corrected (left column) and uncorrected (right column). The first row shows the depth measurement from the pressure sensor; the second row presents the roll and pitch estimation made by the corrected (left) and uncorrected (right) tag data; the third and fourth rows illustrate the associated orientation spheres in a 3D view (third row) and a top-down view (fourth row).
Fig 10
Fig 10
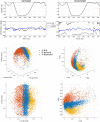
Representative data from a beluga whale, with the tag’s orientation corrected (left column) and uncorrected (right column). The first row shows the depth measurement from the pressure sensor; the second row presents the roll and pitch estimation made by the corrected (left) and uncorrected (right) tag data; the third and fourth rows illustrate the associated orientation spheres in a 3D view (third row) and a top-down view (fourth row).
Fig 11
Fig 11
Orientation spheres for a bottlenose dolphin (left column), a humpback whale (center column), and a beluga whale (right column). The plot of accelerometer data clustered by depth speed is referred to as an orientation sphere. After detecting tag shifts and correcting tag orientation misalignment, the top row of subplots presents the orientation spheres in the animal’s body coordinates. The bottom row shows the data in the tag coordinates before any correction. The dolphin dataset (left column) contains four simulated tag shifts. The humpback whale dataset (center column) has five detected tag shifts. The beluga dataset (right column) is not aligned with the animal but contains no detected tag shifts (i.e., no relative motion between tag and animal was detected).
Fig 12
Fig 12
Example sections of data from a bottlenose dolphin (left) and a beluga whale (right) with the animal’s gait parameterized via dynamic pitch (pitchdp). When the animal has a big roll angle (e.g., during the time around 240 seconds in the bottlenose dolphin dataset), the fluking ‘signature’ (i.e., the sinusoidal fluctuations in each signal channel) transfers from pitch to yaw in the pose estimations. Pitchdp is used to have a pose invariant descriptor of the gait of the animal, that is, with respect to the animal rather than the environment. Inactive swimming periods (e.g., gliding) are automatically identified in pitchdp while fluking frequency and amplitude are calculated from pitchdp, which can be used for further gait analysis.

References

    1. Johnson MP, Tyack PL. A digital acoustic recording tag for measuring the response of wild marine mammals to sound. IEEE Journal of Oceanic Engineering. 2003;28:3–12. doi: 10.1109/JOE.2002.808212 - DOI
    1. Madsen PT, Johnson M, de Soto NA, Zimmer WMX, Tyack P. Biosonar performance of foraging beaked whales (Mesoplodon densirostris). Journal of Experimental Biology. 2005;208:181–194. doi: 10.1242/jeb.01327 - DOI - PubMed
    1. Miller PJO, Johnson MP, Tyack PL. Sperm whale behaviour indicates the use of echolocation click buzzes’creaks’ in prey capture. Proceedings of the Royal Society B: Biological Sciences. 2004;271:2239–2247. doi: 10.1098/rspb.2004.2863 - DOI - PMC - PubMed
    1. Shamir L, Yerby C, Simpson R, von Benda-Beckmann AM, Tyack P, Samarra F, et al.. Classification of large acoustic datasets using machine learning and crowdsourcing: Application to whale calls. The Journal of the Acoustical Society of America. 2014;135:953–962. doi: 10.1121/1.4861348 - DOI - PubMed
    1. Miller PJO, Johnson MP, Tyack PL, Terray EA. Swimming gaits, passive drag and buoyancy of diving sperm whales Physeter macrocephalus. Journal of Experimental Biology. 2004;207:1953–1967. doi: 10.1242/jeb.00993 - DOI - PubMed

Publication types