. 2022 Dec 1:217:114663.
doi: 10.1016/j.bios.2022.114663. Epub 2022 Aug 30.

Molecular detection of SARS-COV-2 in exhaled breath at the point-of-need

Affiliations

Molecular detection of SARS-COV-2 in exhaled breath at the point-of-need

Tim Stakenborg et al. Biosens Bioelectron. .

Abstract

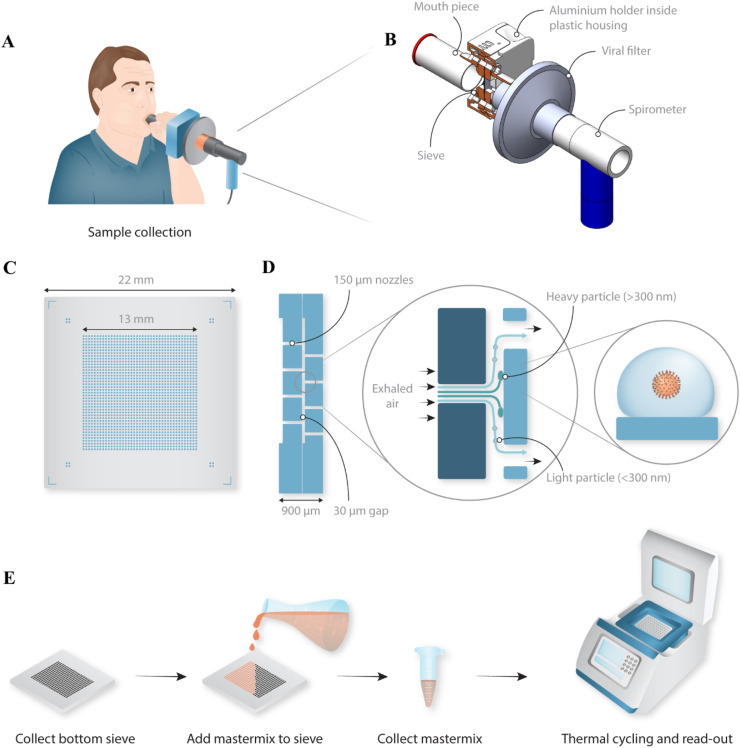
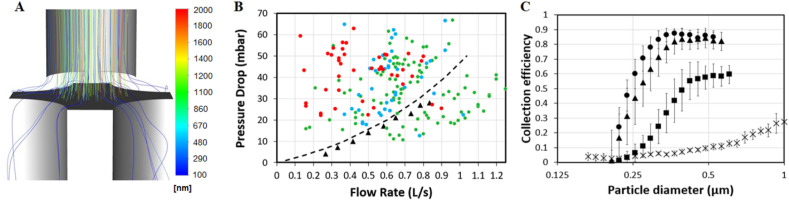
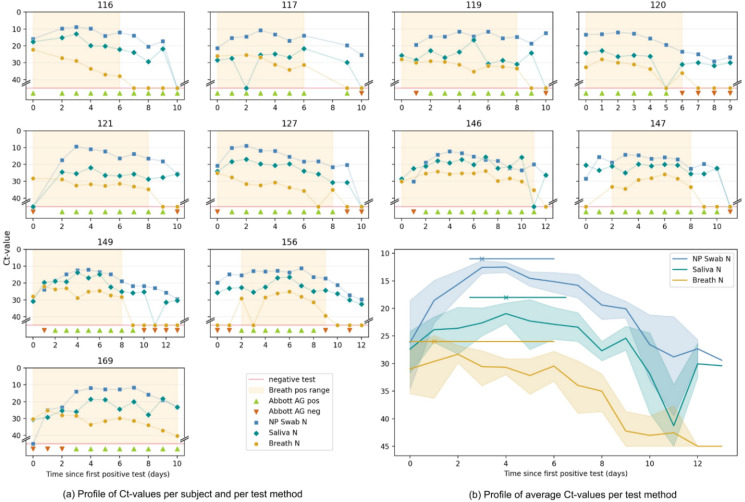
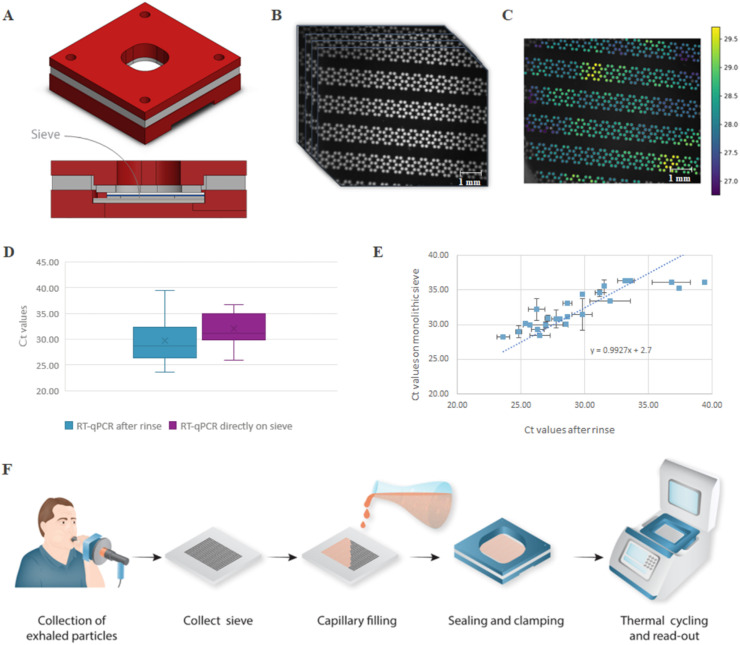
The SARS-CoV-2 pandemic has highlighted the need for improved technologies to help control the spread of contagious pathogens. While rapid point-of-need testing plays a key role in strategies to rapidly identify and isolate infectious patients, current test approaches have significant shortcomings related to assay limitations and sample type. Direct quantification of viral shedding in exhaled particles may offer a better rapid testing approach, since SARS-CoV-2 is believed to spread mainly by aerosols. It assesses contagiousness directly, the sample is easy and comfortable to obtain, sampling can be standardized, and the limited sample volume lends itself to a fast and sensitive analysis. In view of these benefits, we developed and tested an approach where exhaled particles are efficiently sampled using inertial impaction in a micromachined silicon chip, followed by an RT-qPCR molecular assay to detect SARS-CoV-2 shedding. Our portable, silicon impactor allowed for the efficient capture (>85%) of respiratory particles down to 300 nm without the need for additional equipment. We demonstrate using both conventional off-chip and in-situ PCR directly on the silicon chip that sampling subjects' breath in less than a minute yields sufficient viral RNA to detect infections as early as standard sampling methods. A longitudinal study revealed clear differences in the temporal dynamics of viral load for nasopharyngeal swab, saliva, breath, and antigen tests. Overall, after an infection, the breath-based test remains positive during the first week but is the first to consistently report a negative result, putatively signalling the end of contagiousness and further emphasizing the potential of this tool to help manage the spread of airborne respiratory infections.

Keywords: Aerosols; Breath; Diagnostics; Impactor; Lab-on-a-chip; SARS-CoV-2.


Conflict of interest statement

Declaration of competing interest The authors declare that they have no competing financial interests or personal relationships that could have appeared to influence the work reported in this paper.

Figures

Fig. 1
Fig. 1
Schematic overview of the portable device to sample exhaled particles. (A) Schematic representation of a person breathing into the sampling device. (B) Design of the disposable sampling device with the position of the silicon sieve indicated and kept in place by a holder consisting of an aluminium pre-heated block with O-rings for sealing. A mouthpiece is used in front, and a viral filter in between the silicon impactor and a spirometer (indicated in blue) for measuring flow rate during sampling. (C) Schematic top-view of the final sieve, 22 × 22 mm2 in size, consisting of an array of 1600 nozzles with a diameter of 150 μm. (D) The non-integrated, non-monolithic impactor consists of two sieves stacked on top of each other, creating a gap of 30 μm between the two arrays of holes (the single piece, monolithic impactor is described in Fig. 4). Exhaled particles, some containing virus, are collected on the bottom sieve by inertial impaction, while air and very small particles (<300 nm) are directed to the outlet nozzles and exit without impacting. (E) Schematic overview of the used protocol for this non-monolithic version of the impactor. The bottom sieve is removed from the sample device and master mix is pipetted on top followed by a brief spin to collect the sample. The sample is transferred to a 96-well plate and an RT-qPCR is conducted using a commercial thermal cycler.
Fig. 2
Fig. 2
Non-monolithic silicon impactor characteristics. (A) Fluidic simulation for the designed sieve visualizing particle trajectories of different sizes, coloured by particle diameter, generated using Ansys Fluent software for a nozzle with a diameter of 150 μm at a flow rate of 0.6 L/s. (B) Experimentally (triangles) measured and simulated (dotted line) pressure drop of the sieve versus flow rate. The rated comfort levels of a test panel for different flow rates and pressure drops are indicated as well with green dots being perceived as a comfortable, blue as a neutral and red as an uncomfortable user experience. (C) Normalized capture efficiency of the impactor as a function of particle diameter for different flow rates (crosses: 0.08 L/s, rectangles: 0.25 L/s, triangles: 0.42 L/s, and circles: 0.6 L/s). The error bars correspond to the standard deviation over 4 different impactor chips.
Fig. 3
Fig. 3
Longitudinal study. The findings of the longitudinal study are summarized comparing Ct values of the N gene in breath (breath test N), nasopharyngeal swab (NP Swab N) and saliva (saliva N) to a rapid antigen test on nasopharyngeal swab (Abbott AG). (A) Individual graphs of the 11 participants followed up over the course of their infection, day 0 being the first day any diagnostic test turned positive. The period in which the breath test is positive is shaded. As shown, 3/11 participants were positive on all tests concurrently, while 8/11 had discrepant results on the first day of testing positive. In the latter cases, the breath test turned positive before NP swab on two occasions (subject 121 and 169) and after in two others (subject 147 and 156). The Abbott AG test turned positive 0–3 days after a PCR test (mean 1.4 days). (B) A summed graph in which the Ct values of all tests performed in the 11 participants on a particular day are averaged for one particular sample type. A trend towards an earlier peak in the breath test N in comparison to NP Swab N and saliva N is shown on top. Median and 95%CI were calculated using the bootstrap method. Lastly, as shown and more clearly visible in Fig. S7, the breath test turns negative before RT-qPCR on other respiratory samples.
Fig. 4
Fig. 4
In-situ RT-qPCR using an integrated, monolithic silicon chip. (A) A 3D CAD image and cross-section of the clamped sieve. The poly-methyl-methacrylate (PMMA) housing has an opening on top for optical access and at the bottom for thermal access. The monolithic sieve itself is clamped in between a top glass substrate with a clear silicone sheet and a bottom silicon substrate with a Li2000 thermal tape for good thermal contact. More details of the housing and clamp are shown in Fig. S5 (B). The optical signal of the sieve is captured for each cycle during thermal cycling using an in-house developed RT-qPCR set-up resulting in a series of images. (C) Resulting heat-map of the fluorescent signals. An R-script is used to generate a Ct value for every nozzle/well. In the example shown, the median Ct value is 28.2 and the mean Ct value is 29.3, calculated over a total of 701 nozzles. (D) Ct values obtained from the positive clinical samples comparing the rinsing method (mean 28.6) with the in-situ RT-qPCR method (mean 31.1). Note that the shift in Ct value was also apparent in the reference curves (see Fig. S4B). (E) Scatterplot of the individual clinical samples that were positive for both RT-qPCR performed on the non-monolithic sieve with rinsing (x-axis) and monolithic sieve (y-axis) showing a linear relationship. The error bars represent the standard deviation from 2 samples gathered from the same subject at the same time point. (F) Schematic overview of the used protocol for the monolithic version of the impactor. The monolithic sieve is removed from the sample device, followed by adding the master mix. The impactor fills by capillary fluidic movement after which both sides of the sieve are sealed using a PMMA clamp. The sieve with clamp is positioned in the custom thermal cycler for direct, in-situ RT-qPCR. More details of the set-up are shown in Fig. S6.

References

    1. Asadi S., Wexler A.S., Cappa C.D., Barreda S., Bouvier N.M., Ristenpart W.D. Aerosol emission and superemission during human speech increase with voice loudness. Sci. Rep. 2019;9:1–10. doi: 10.1038/s41598-019-38808-z. - DOI - PMC - PubMed
    1. Bullard J., Dust K., Funk D., Strong J.E., Alexander D., Garnett L., Boodman C., Bello A., Hedley A., Schiffman Z., Doan K., Bastien N., Li Y., van Caeseele P.G., Poliquin G. Predicting infectious severe acute respiratory syndrome coronavirus 2 from diagnostic samples. Clin. Infect. Dis. 2020;71:2663–2666. doi: 10.1093/cid/ciaa638. - DOI - PMC - PubMed
    1. Cai Q., Fauvart M., Wiederkehr R.S., Jones B., Cools P., Goos P., Vaneechoutte M., Stakenborg T. Ultra-fast, sensitive and quantitative on-chip detection of group B streptococci in clinical samples. Talanta. 2019:192. doi: 10.1016/j.talanta.2018.09.041. - DOI - PubMed
    1. Chen P.Z., Bobrovitz N., Premji Z., Koopmans M., Fisman D.N., Gu F.X. Heterogeneity in transmissibility and shedding SARS-CoV-2 via droplets and aerosols. eLife. 2021;10:1–32. doi: 10.7554/ELIFE.65774. - DOI - PMC - PubMed
    1. Chen P.Z., Bobrovitz N., Premji Z.A., Koopmans M., Fisman D.N., Gu F.X. SARS-CoV-2 shedding dynamics across the respiratory tract, sex, and disease severity for adult and pediatric COVID-19. eLife. 2021;10 doi: 10.7554/eLife.70458. - DOI - PMC - PubMed