. 2022 Oct 10;40(10):1128-1144.e8.
doi: 10.1016/j.ccell.2022.08.015. Epub 2022 Sep 22.

MPS1 inhibition primes immunogenicity of KRAS-LKB1 mutant lung cancer

Affiliations

MPS1 inhibition primes immunogenicity of KRAS-LKB1 mutant lung cancer

Shunsuke Kitajima et al. Cancer Cell. .

Abstract

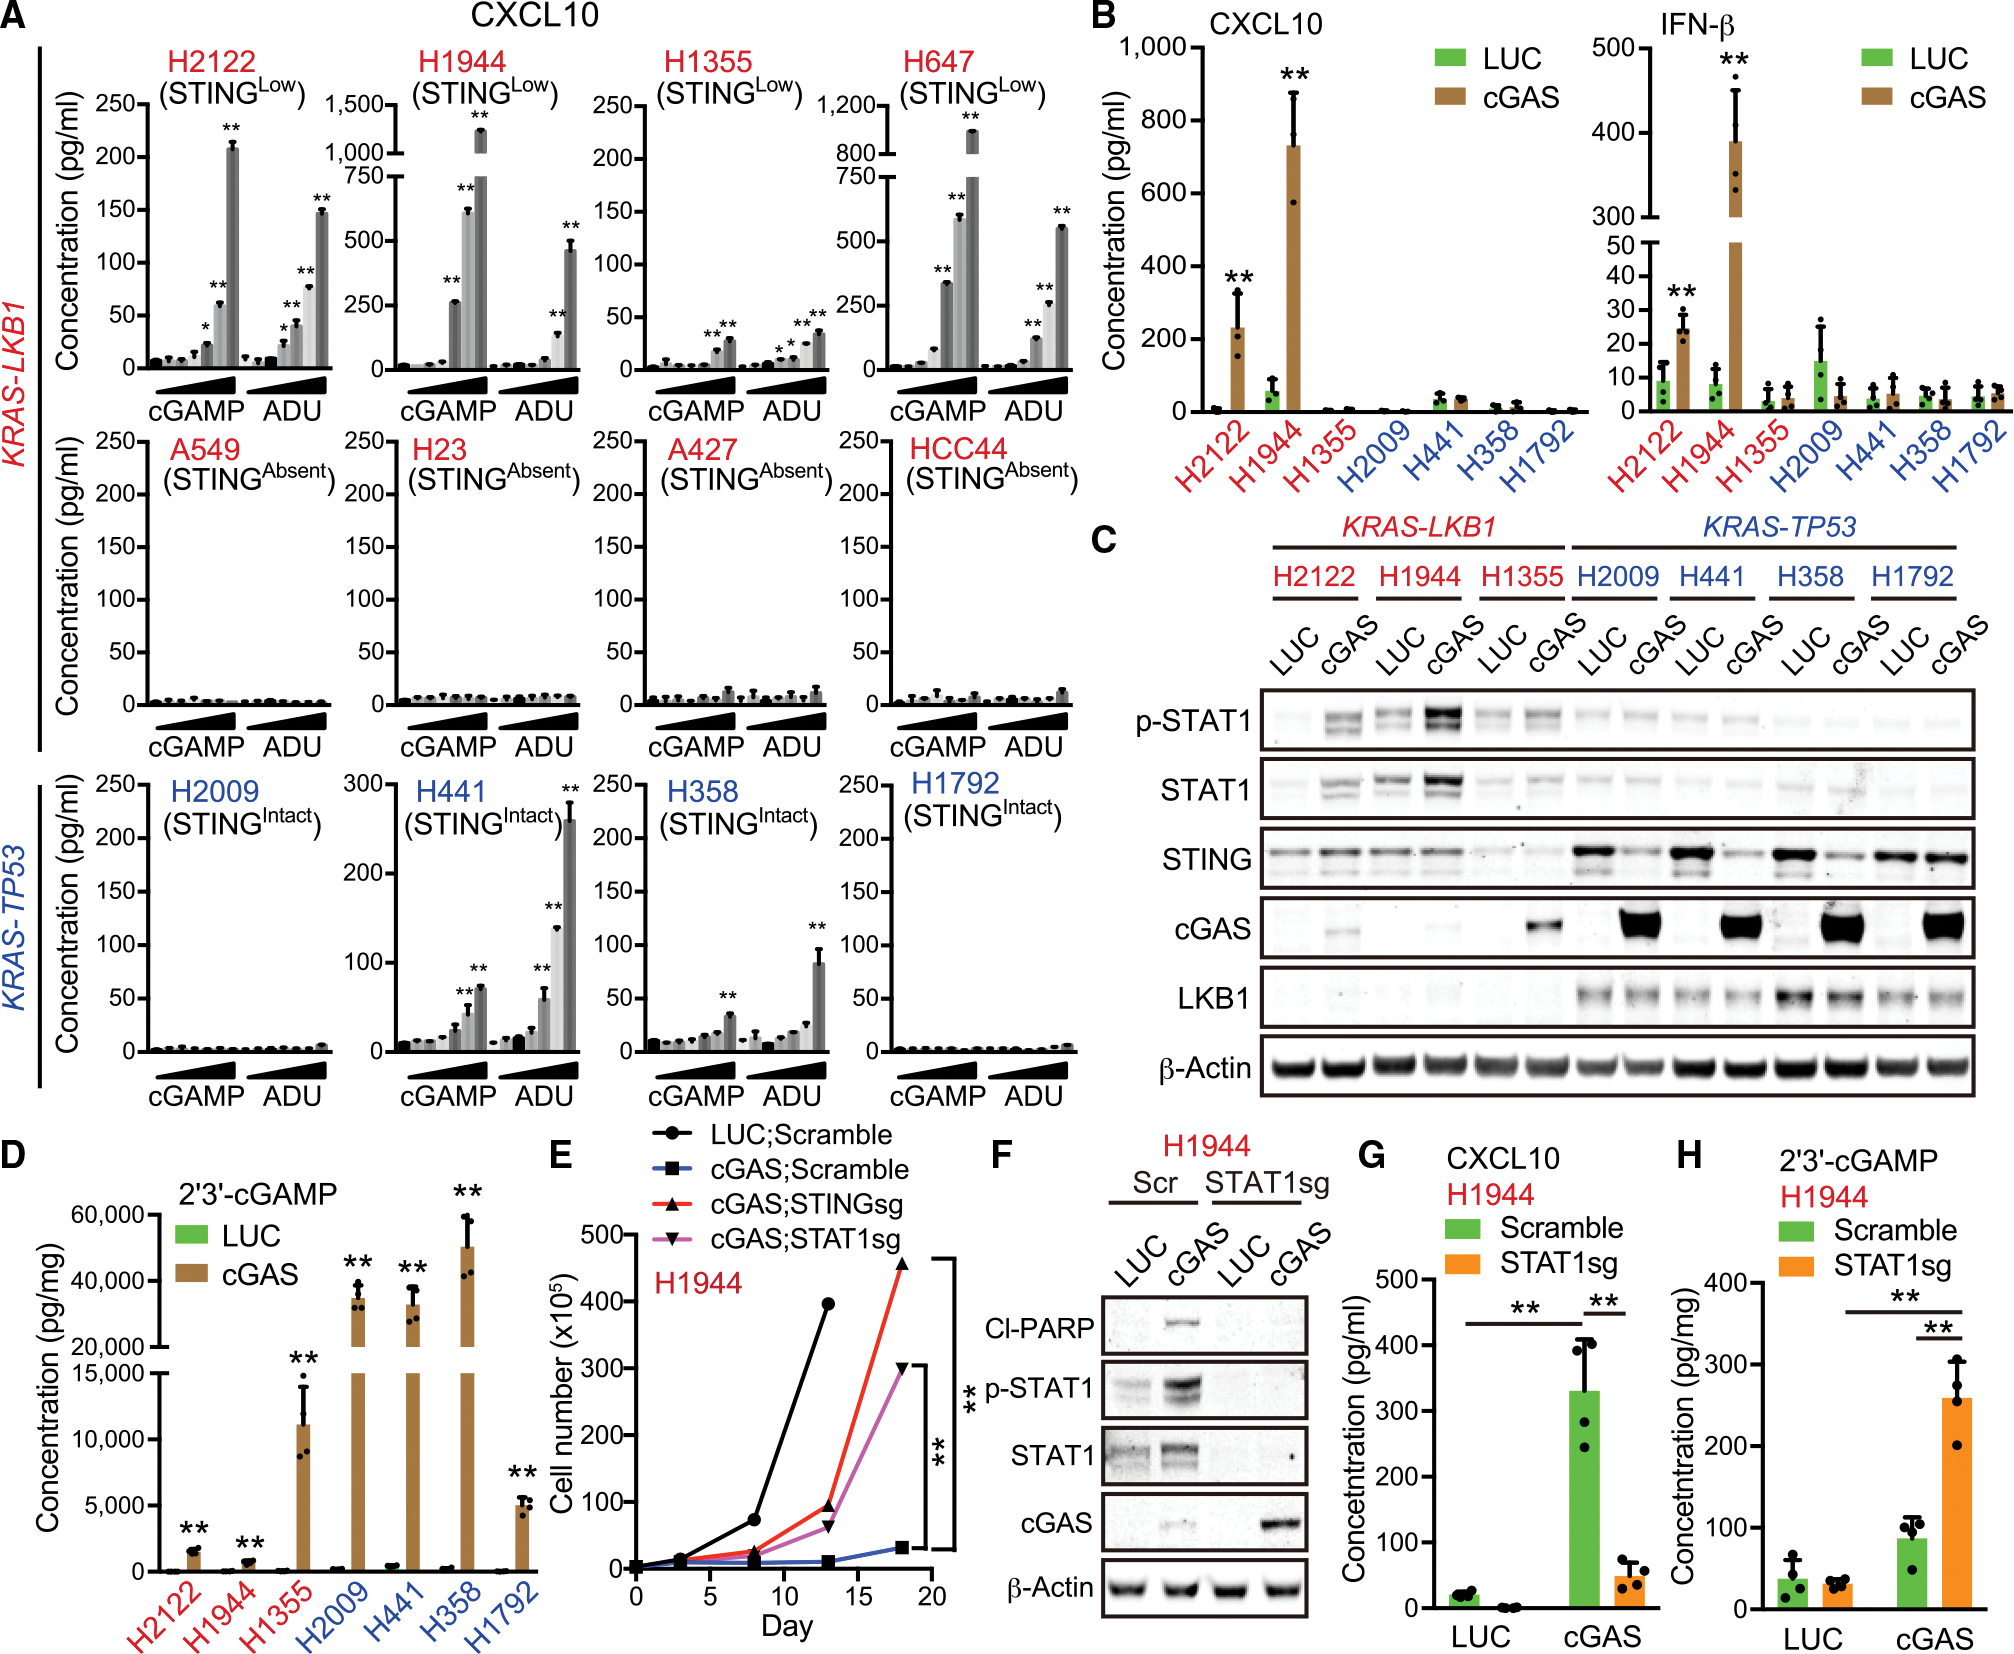
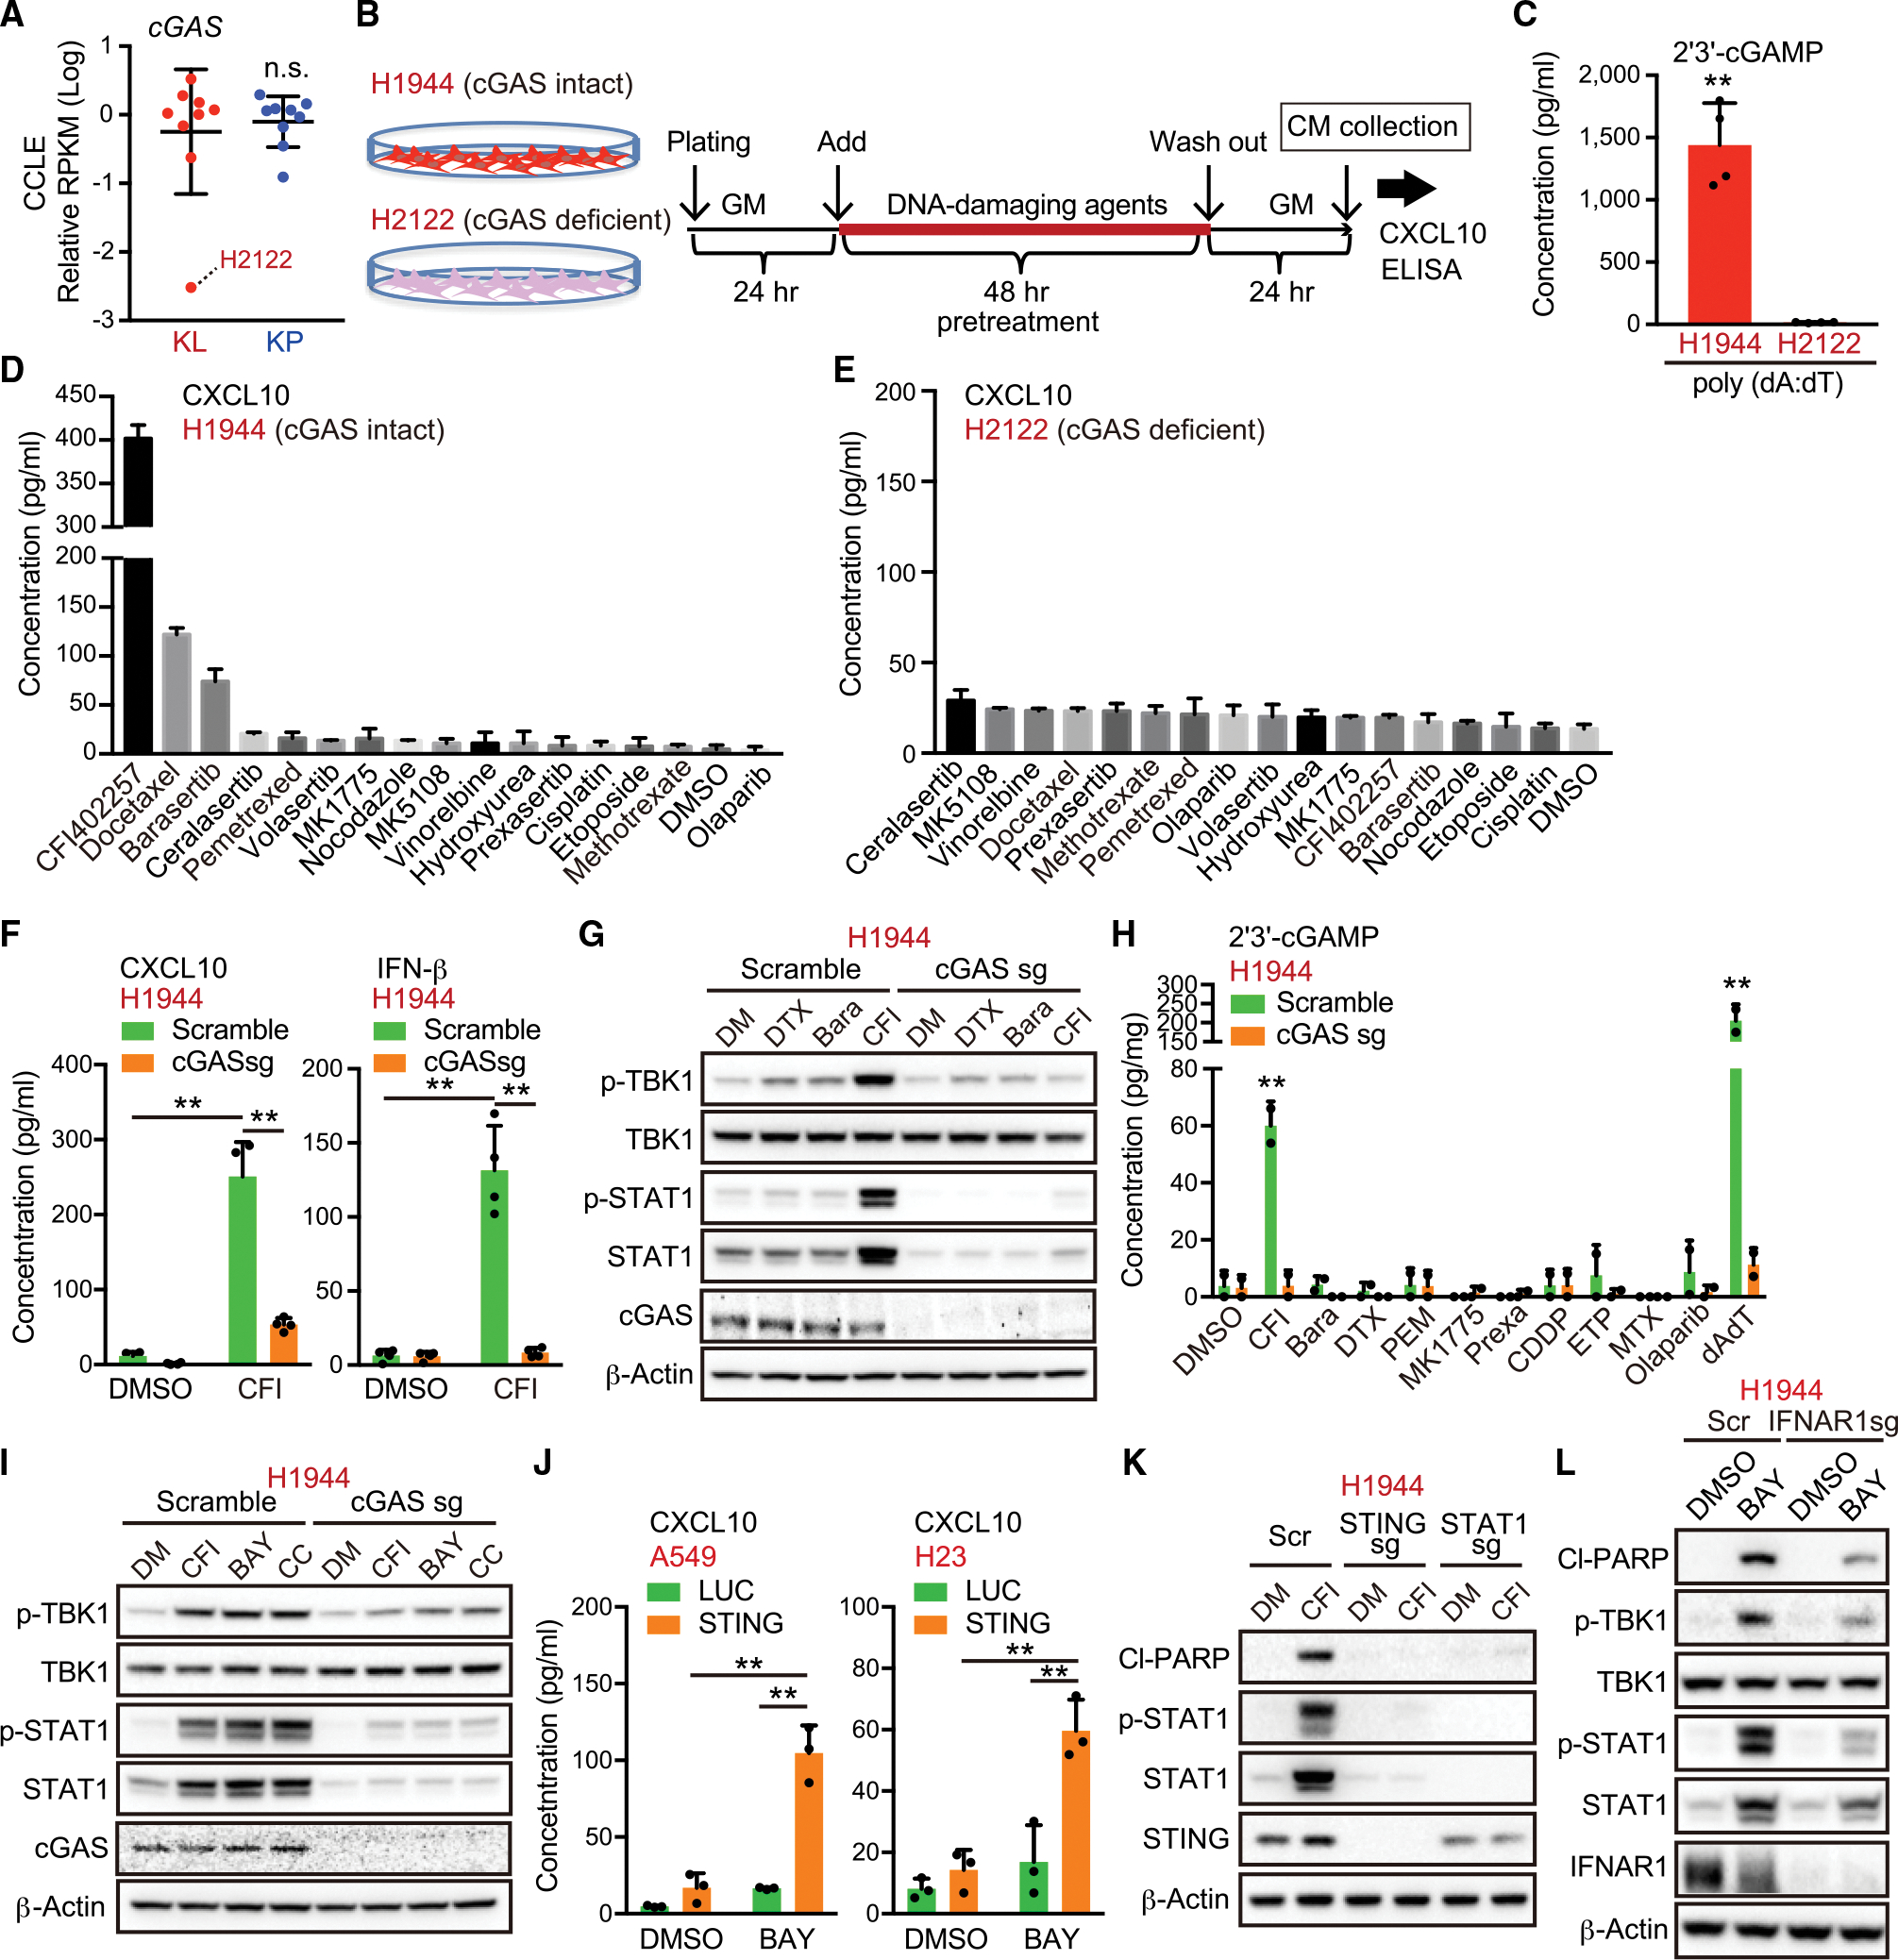
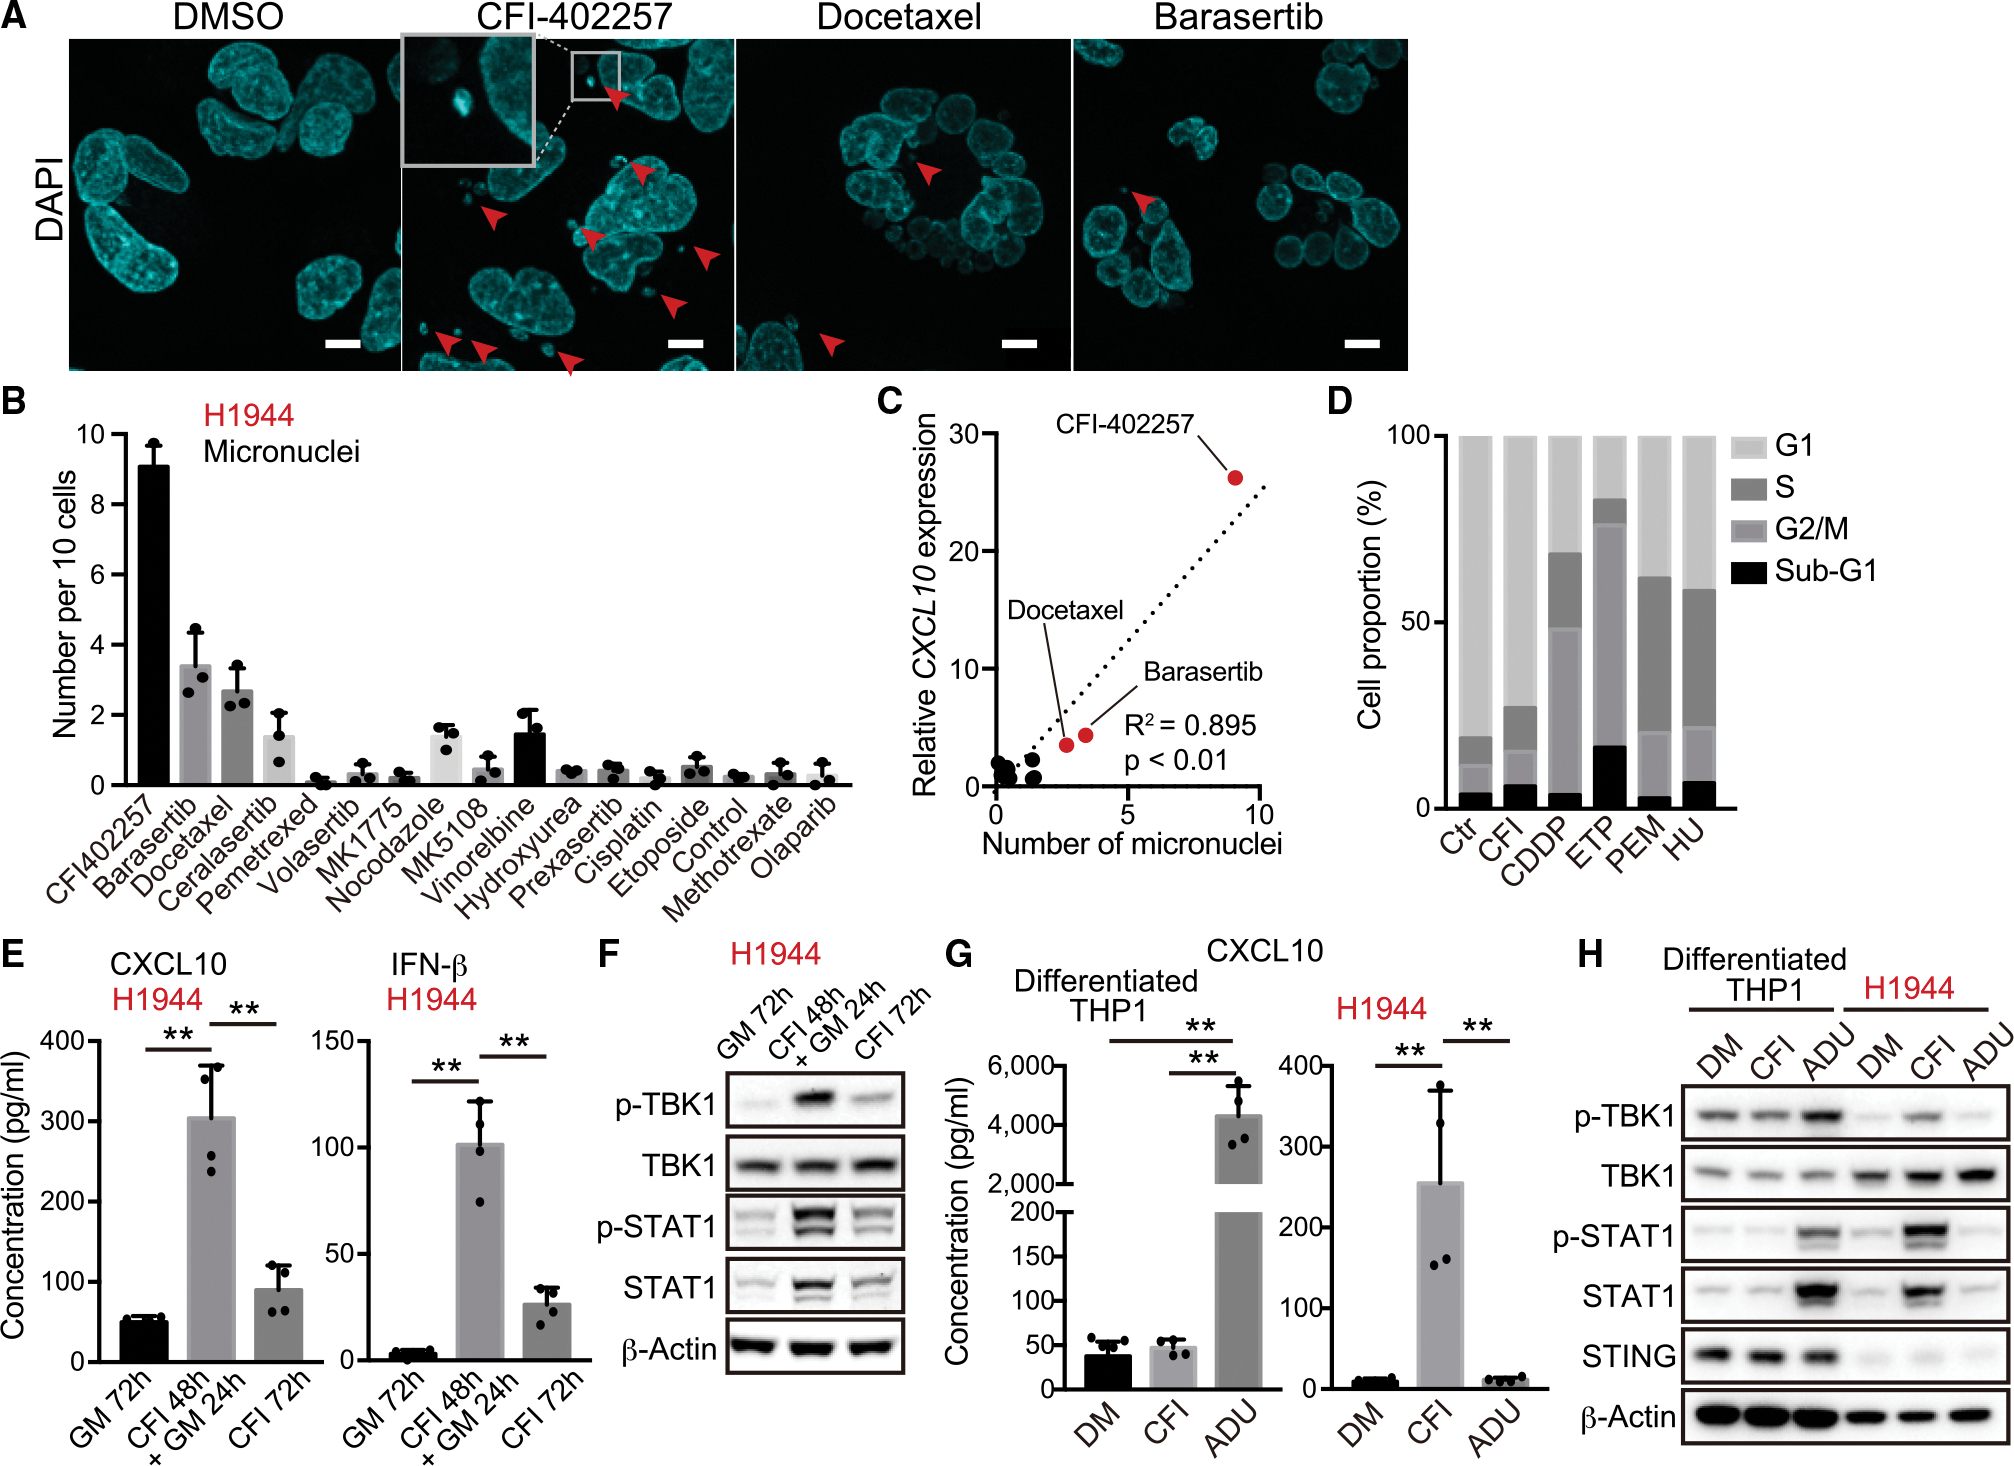
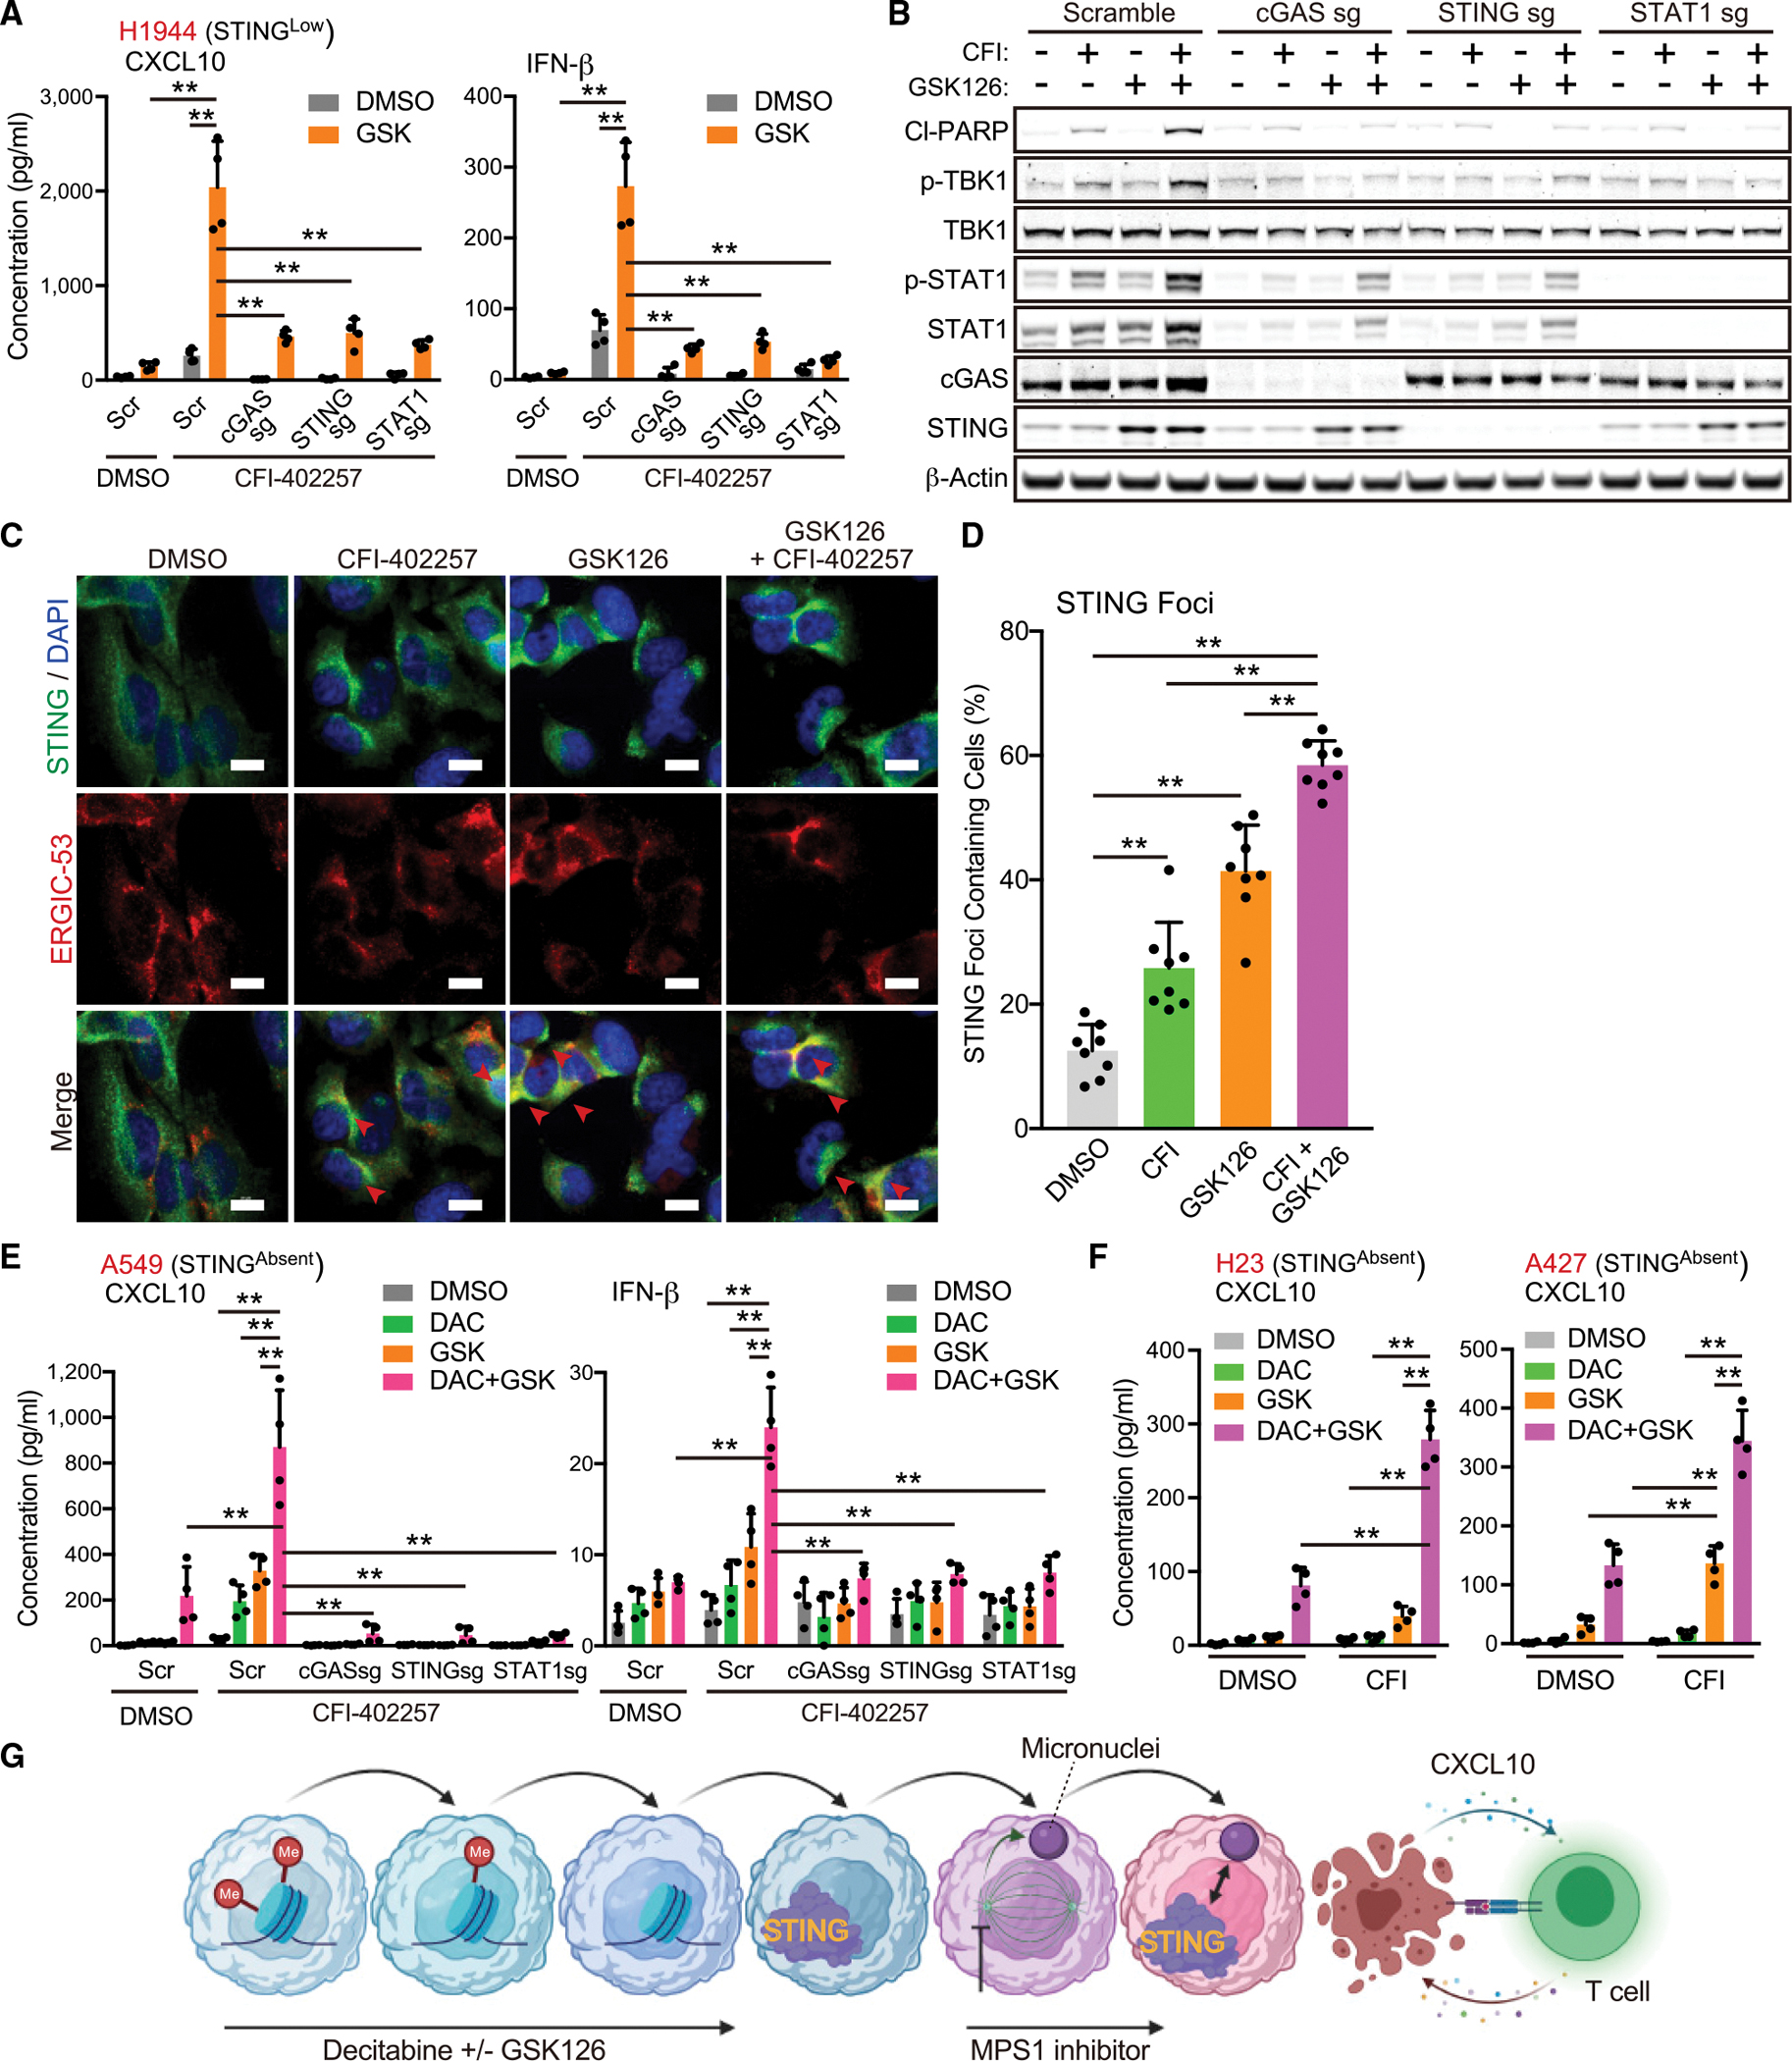
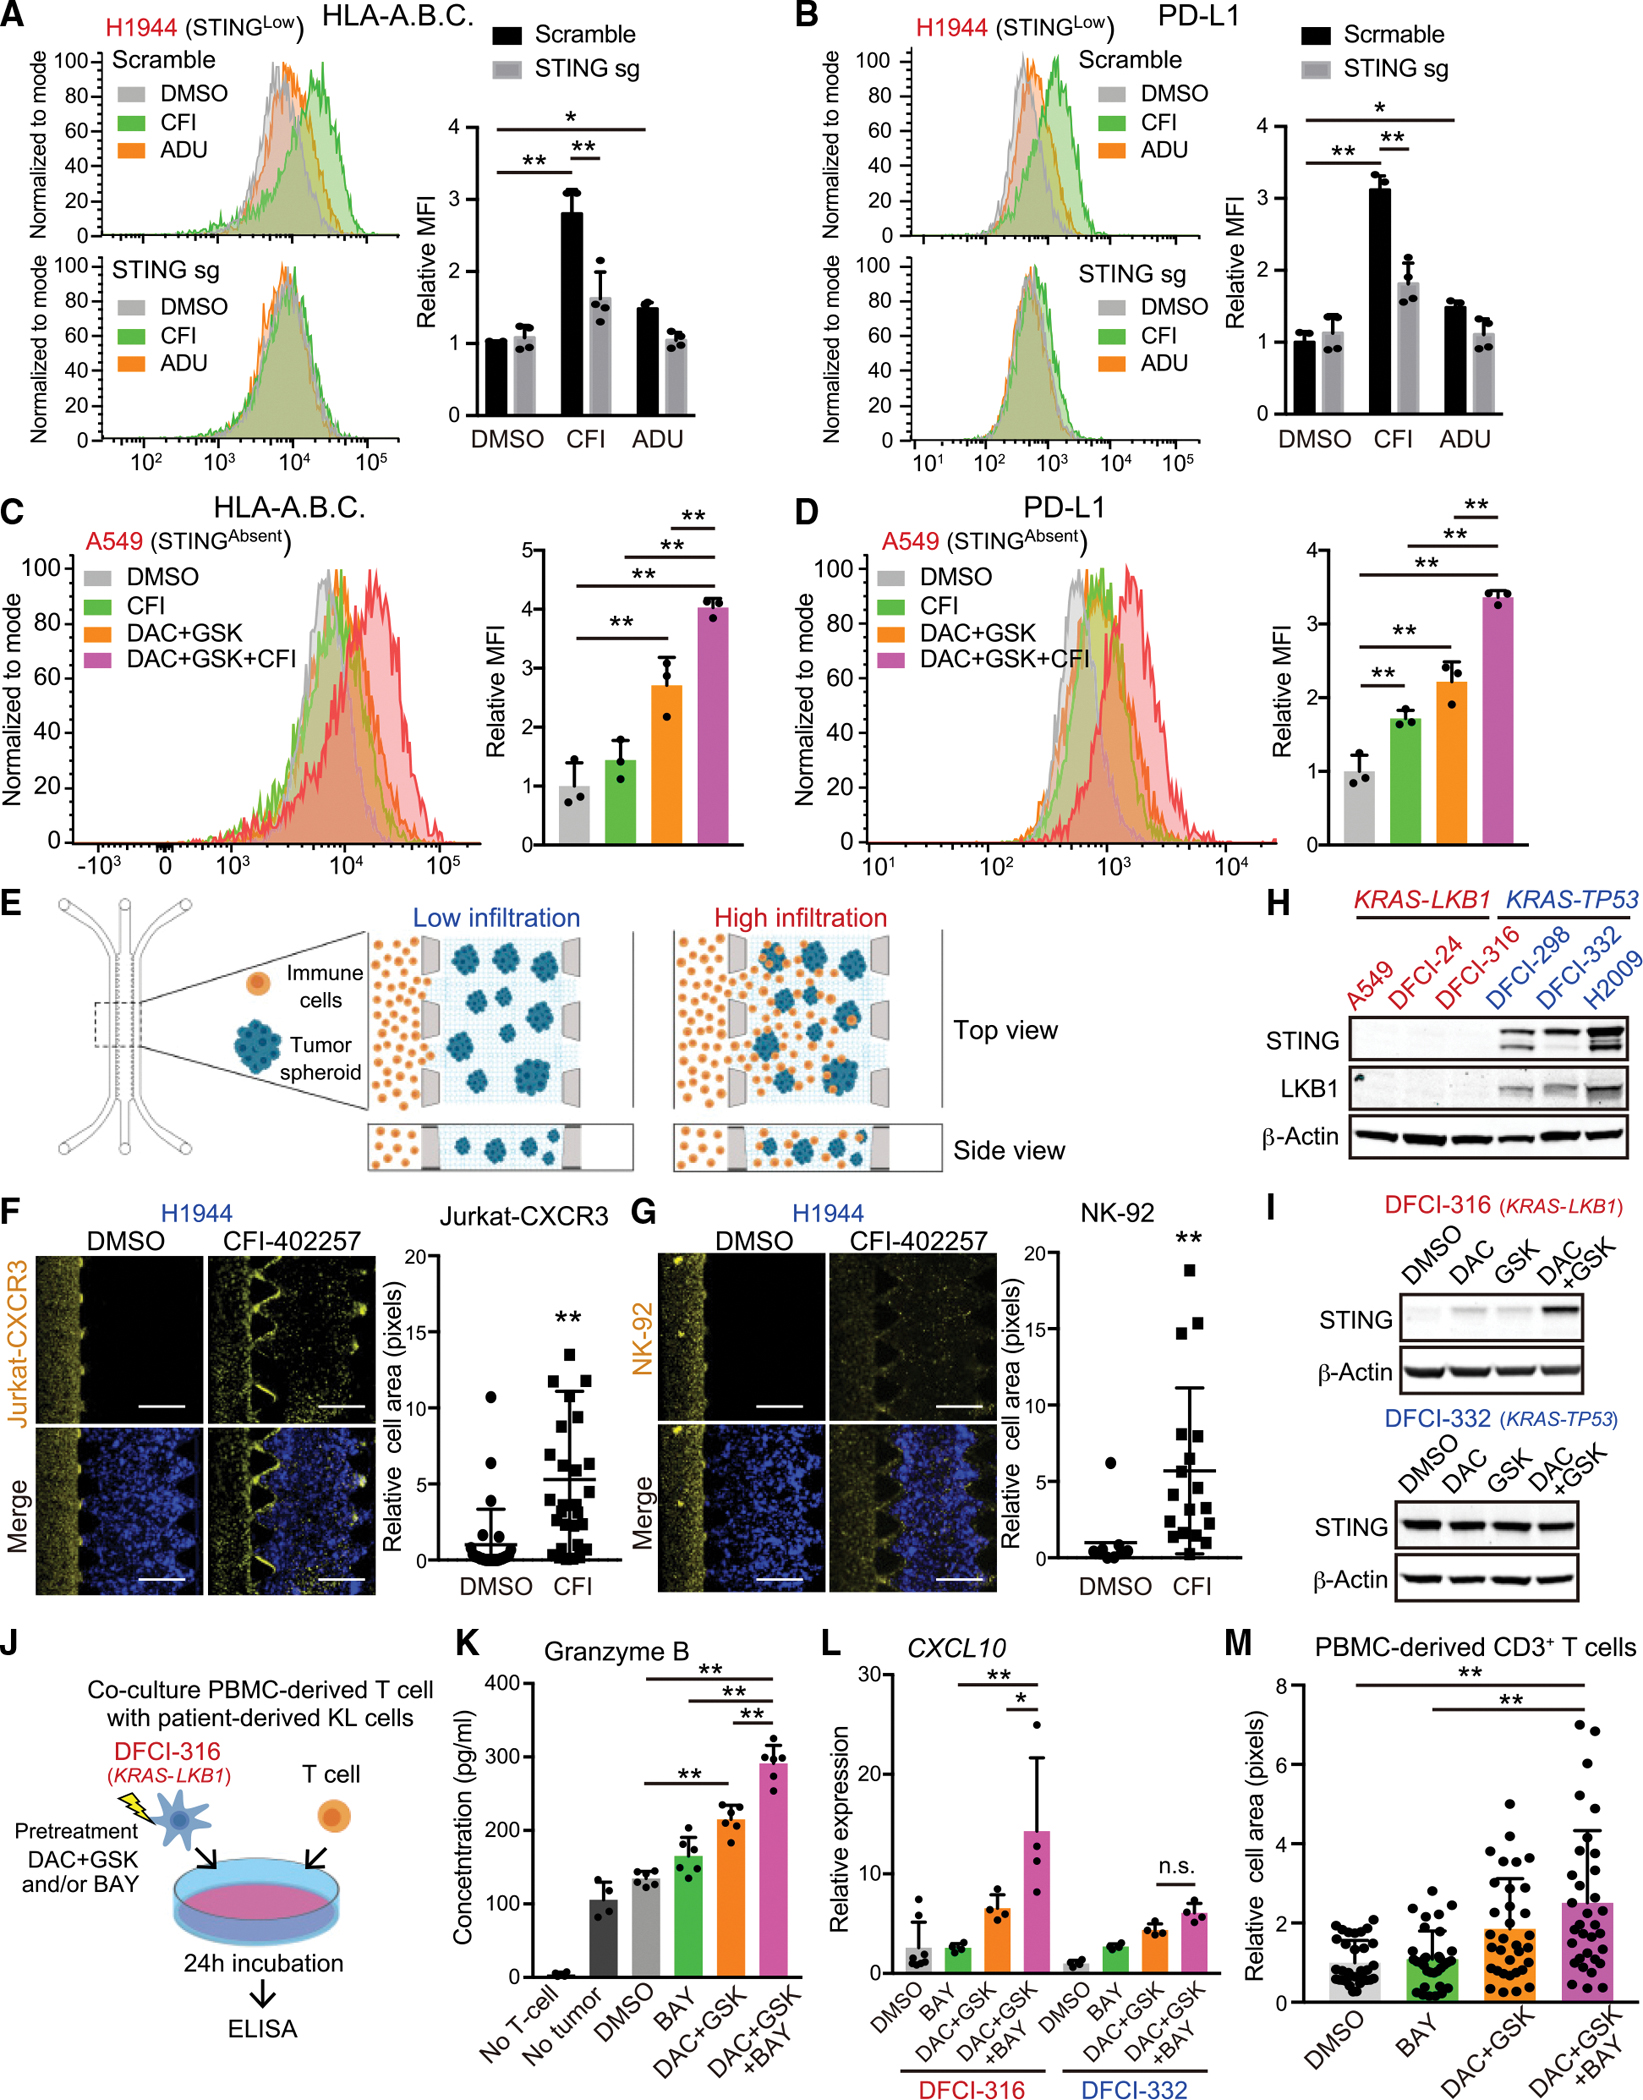
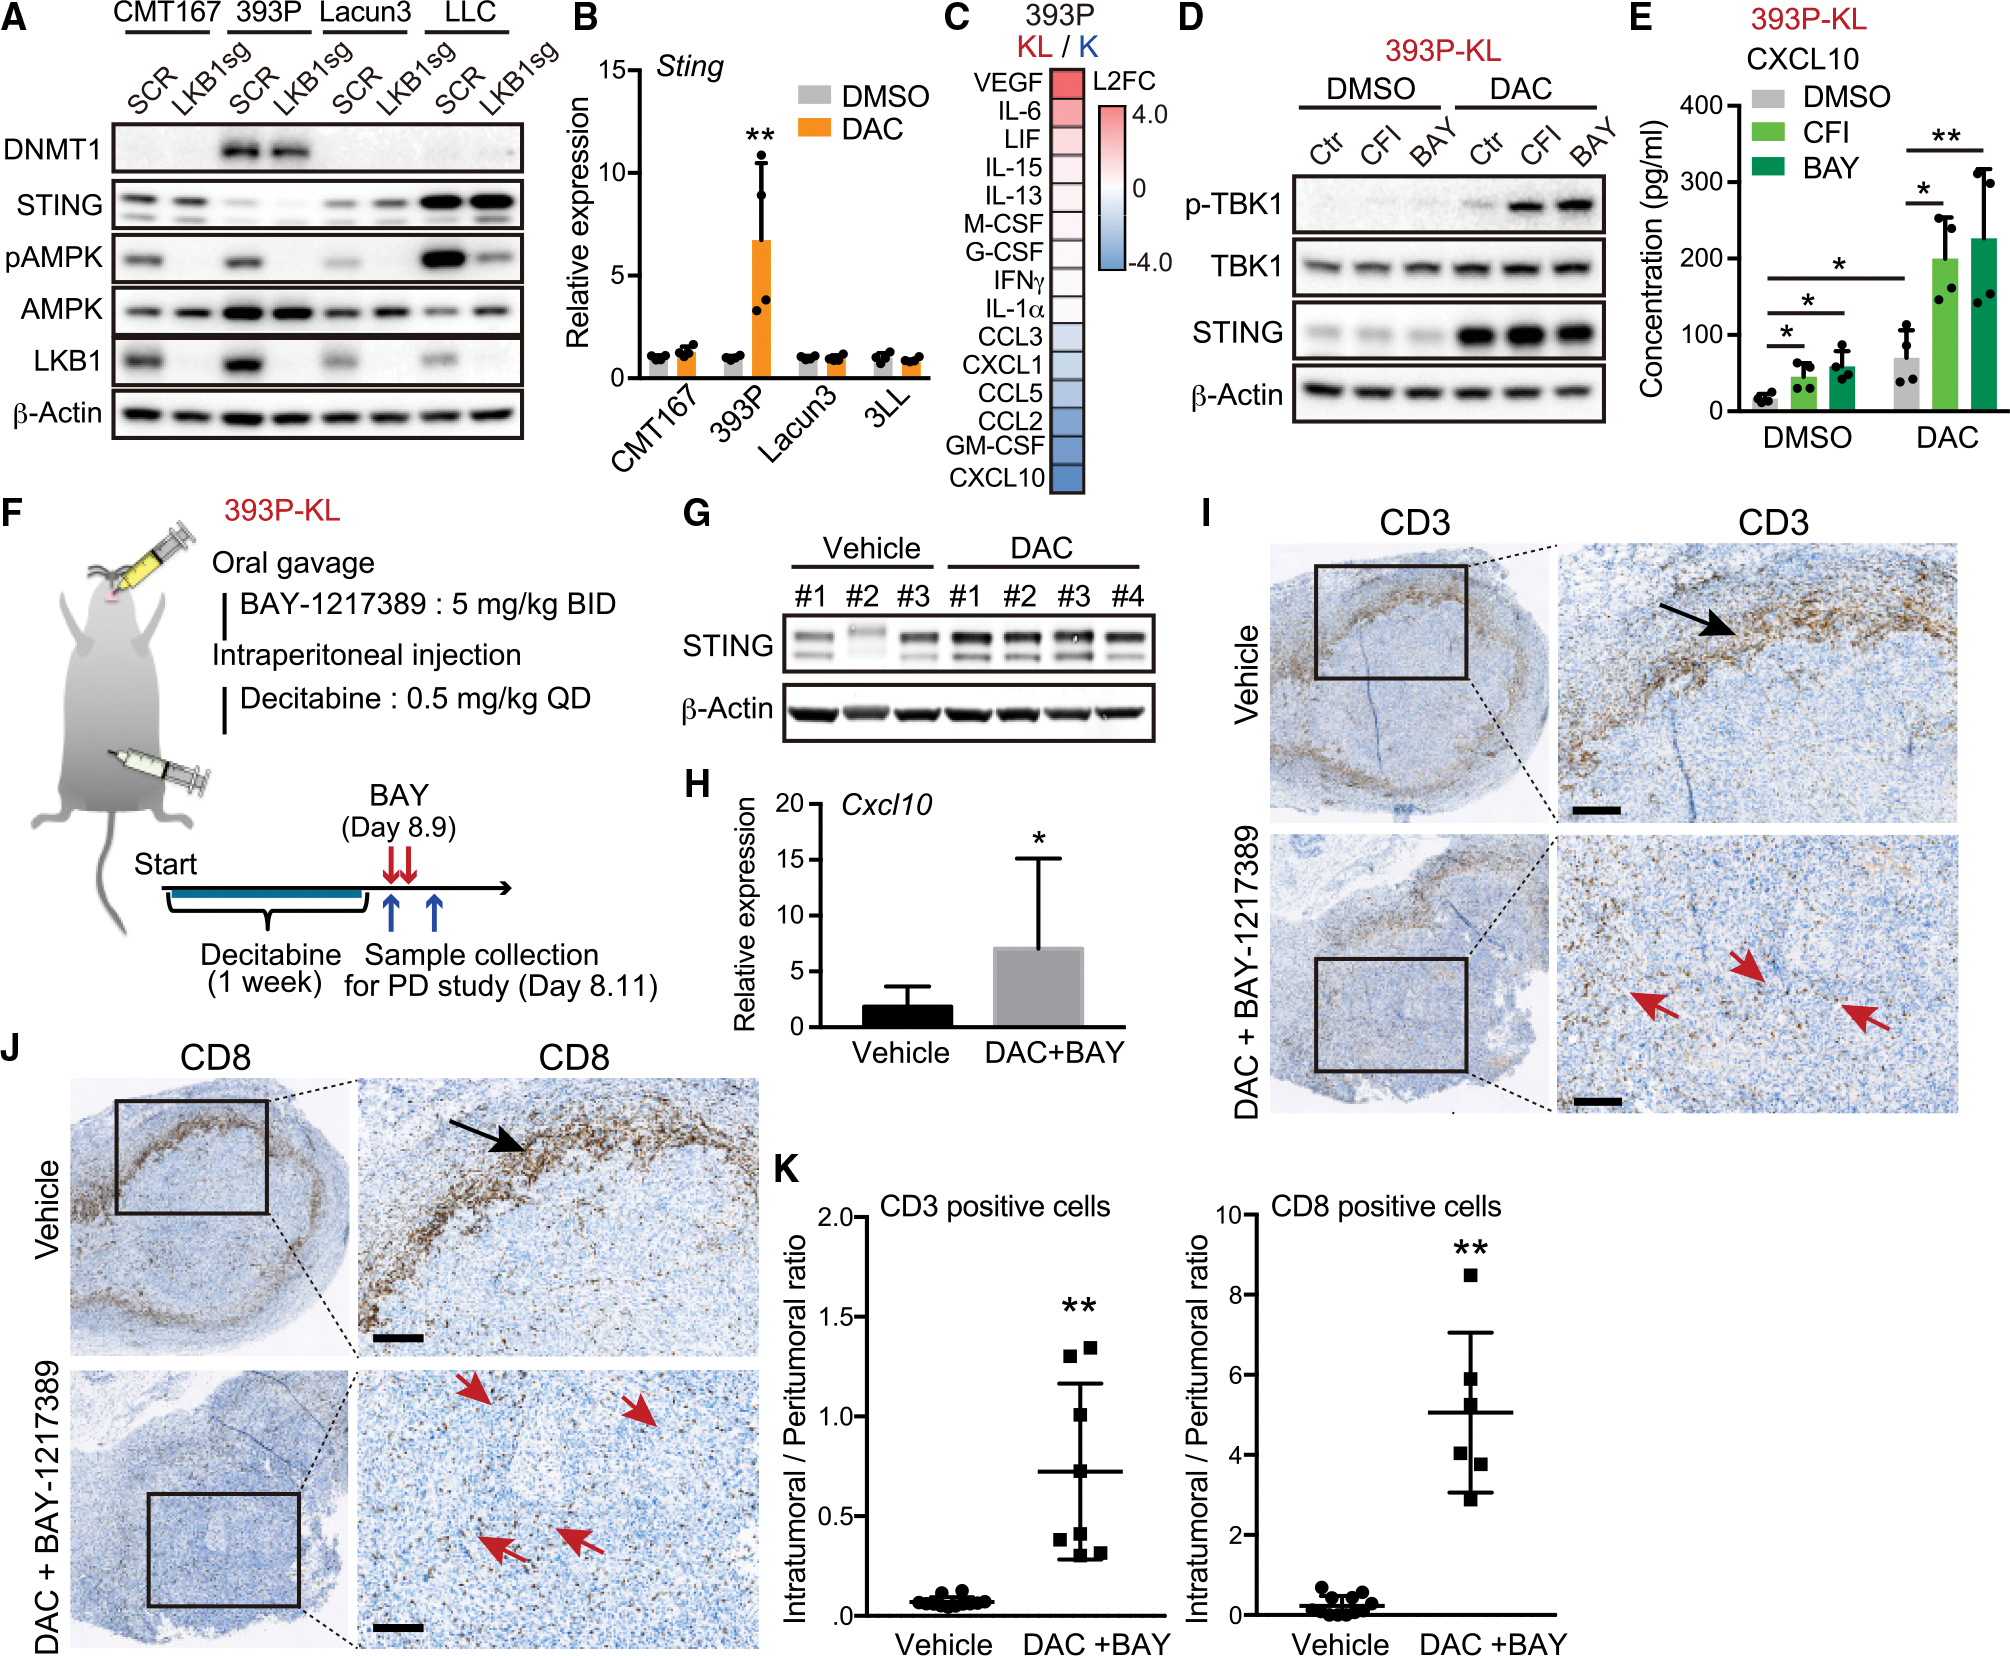
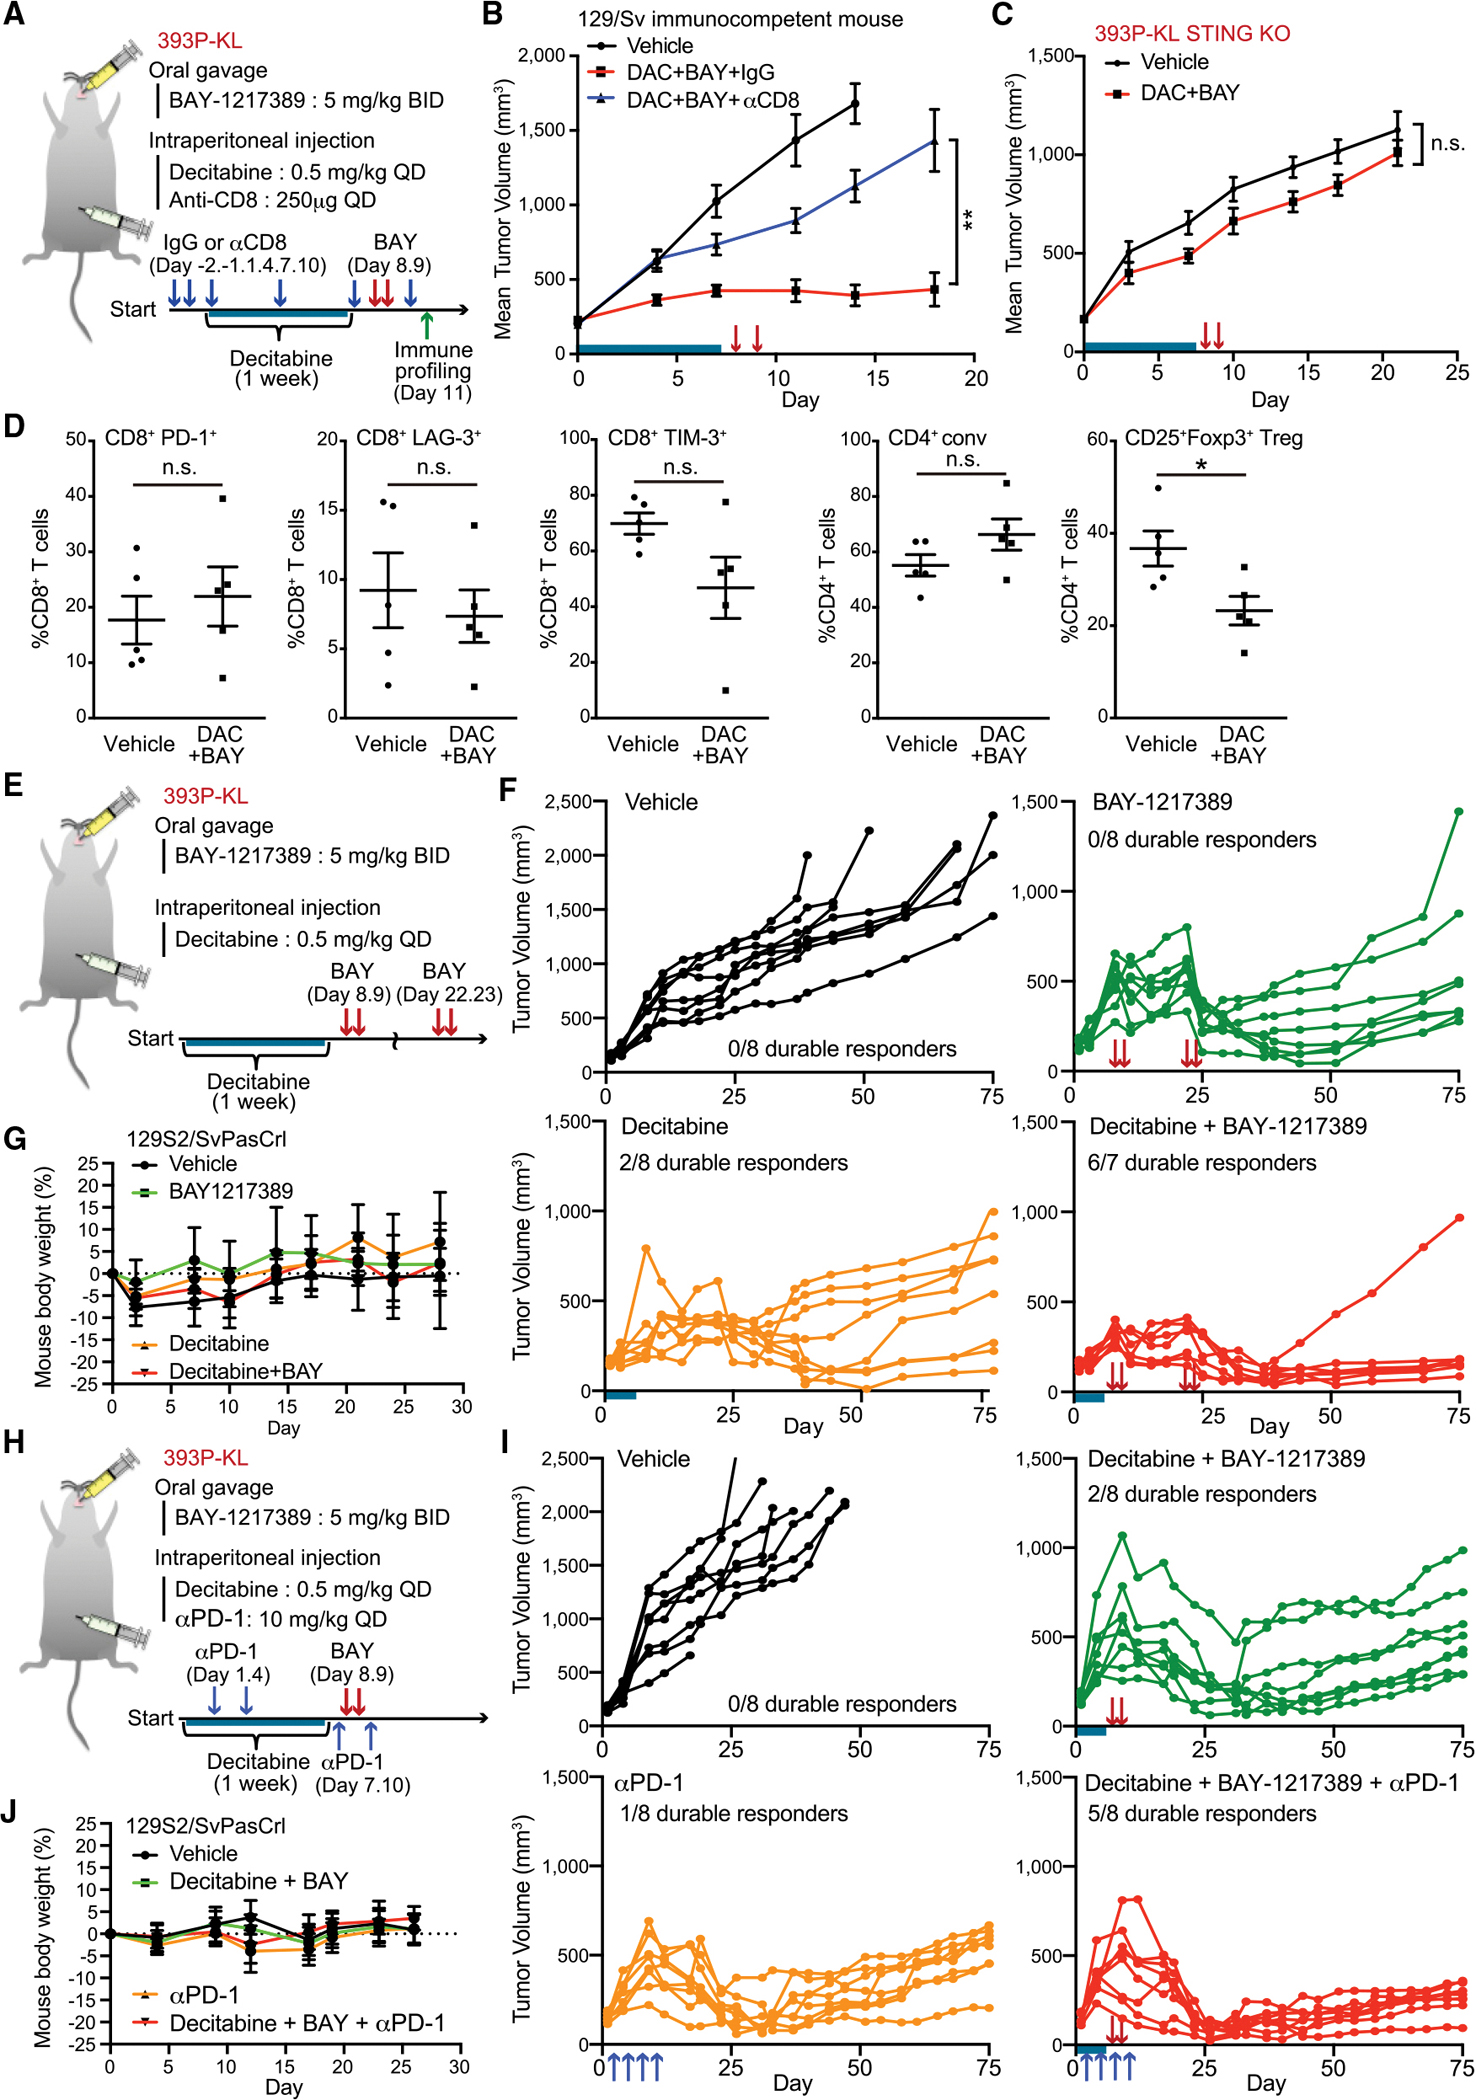
KRAS-LKB1 (KL) mutant lung cancers silence STING owing to intrinsic mitochondrial dysfunction, resulting in T cell exclusion and resistance to programmed cell death (ligand) 1 (PD-[L]1) blockade. Here we discover that KL cells also minimize intracellular accumulation of 2'3'-cyclic GMP-AMP (2'3'-cGAMP) to further avoid downstream STING and STAT1 activation. An unbiased screen to co-opt this vulnerability reveals that transient MPS1 inhibition (MPS1i) potently re-engages this pathway in KL cells via micronuclei generation. This effect is markedly amplified by epigenetic de-repression of STING and only requires pulse MPS1i treatment, creating a therapeutic window compared with non-dividing cells. A single course of decitabine treatment followed by pulse MPS1i therapy restores T cell infiltration in vivo, enhances anti-PD-1 efficacy, and results in a durable response without evidence of significant toxicity.

Keywords: 2’3’-cGAMP; DNMT1; EZH2; KRAS-LKB1 mutant lung adenocarcinoma; STING; cGAS; monopolar spindle kinase 1.


Conflict of interest statement

Declaration of interests S.K., T.T., D.A.B., C.P.P, and P.G. are inventors on a pending patent for combination DAC and MPS1 inhibitor therapy to prime cancer immunogenicity. D.A.B. is a consultant for N of One/Qiagen and Tango Therapeutics; is a founder and shareholder in Xsphera Biosciences; has received honoraria from Merck, H3 Biomedicine/Esai, EMD Serono, Gilead Sciences, Abbvie, and Madalon Consulting; and has received research grants from BMS, Takeda, Novartis, Gilead, and Lilly. T.U.B is a consultant for N of One/Qiagen. P.C.G. has sponsored research agreements with Marengo Therapeutics, Epizyme, Daiichi Sankyo, and Foghorn Therapeutics. C.P.P is a consultant for DropWorks and Xsphera Biosciences; has stock and other ownership interests in Xsphera Biosciences; received honoraria from Bio-Rad; and has sponsored research agreements with Daiichi Sankyo, Bicycle Therapeutics, Transcenta, Bicara Therapeutics, AstraZeneca, Intellia Therapeutics, Janssen Pharmaceuticals, and Array Biopharma. S.K. has a sponsored research agreement with Boehringer-Ingelheim. E.H.K. is an employee and stockholder of Merck & Co. and previously had a Sponsored Research Agreement with Takeda Pharmaceuticals. H.K. has a Sponsored Research Agreement with Takeda Pharmaceuticals. P.A.J. has received consulting fees from AstraZeneca, Boehringer-Ingelheim, Pfizer, Roche/Genentech, Takeda Oncology, ACEA Biosciences, Eli Lilly and Company, Araxes Pharma, Ignyta, Mirati Therapeutics, Novartis, LOXO Oncology, Daiichi Sankyo, Sanofi Oncology, Voronoi, SFJ Pharmaceuticals, Takeda Oncology, Transcenta, Silicon Therapeutics, Syndax, Nuvalent, Bayer, Esai, Biocartis, Allorion Therapeutics, Accutar Biotech, and Abbvie; receives post-marketing royalties from DFCI; owned intellectual property on EGFR mutations licensed to Lab Corp; has sponsored research agreements with AstraZeneca, Daichi-Sankyo, PUMA, Boehringer Ingelheim, Eli Lilly and Company, Revolution Medicines; and Astellas Pharmaceuticals; and has stock ownership in LOXO Oncology and Gatekeeper Pharmaceuticals.

Figures

Figure 1.
Figure 1.. KL cells exhibit low tolerability to accumulation of intracellular 2′3′-cGAMP
(A) Enzyme-linked immunosorbent assay (ELISA) of human CXCL10 levels in conditioned medium (CM) derived from KL (red) or KP (blue) NSCLC cells treated with or without 3.125, 6.25, 12.5, 25, 50, or 100 μM 2′3′-cGAMP or ADU-S100 for 24 h (n = 3). H2122, H1355, H23, and HCC44 KL cell lines have a p53 mutation. (B) ELISA of human CXCL10 or IFN-β levels in CM derived from KL or KP cells transduced with the indicated vectors (n = 3). (C) Immunoblot (IB) of the indicated proteins in KL or KP cells transduced with the indicated vectors. (D) ELISA of intracellular 2′3′-cGAMP levels in KL (red) or KP (blue) cells transduced with the indicated vectors (n = 4). © Total cell number of H1944 cells transduced with the indicated vectors at each measuring point (day 0, day 3, day 8, day 13, or day 18). (F–H) IB of the indicated proteins (F), or ELISA of human CXCL10 in CM (G) or intracellular 2′3′-cGAMP levels (H) in H1944 cells transduced with the indicated vectors (n = 4). All quantitative data are represented as mean ± SD p values were calculated by unpaired two-tailed Student’s t test (B, D, and E), or one-way analysis of variance followed by Dunnet’s post hoc test (A), or two-way ANOVA(G and H) followed by Sidak’s post hoc test (G and H), *p < 0.05, **p < 0.01. See also Figure S1.
Figure 2.
Figure 2.. Screening of DNA-damaging agents to extract the drugs activating the STING pathway in KL cells
(A) Relative RPKM values of cGAS in KL and KP cells from CCLE. (B) Schedule of drug treatment for the screening. GM, growth medium; CM, conditioned medium. (C) Intracellular 2′3′-cGAMP levels in H2122 or H1944 cells treated with 0.5 μg/mL poly (dA:dT) (n = 4). (D and E) Enzyme-linked immunosorbent assay (ELISA) of human CXCL10 in CM derived from H1944 (D) or H2122 (E) cells treated with the indicated DNA-damaging agents in accordance with the schedule for the screening (n = 2). (F) ELISA of human CXCL10 or IFN-β levels in CM derived from H1944 cells transduced with the indicated vectors, treated with 200 nM CFI-402257 (n = 4). (G and H) Immunoblot (IB) of the indicated proteins (G), or intracellular 2′3′-cGAMP levels (H), in H1944 cells transduced with the indicated vectors, and treated with the indicated DNA-damaging agents (n = 2). Bara, barasertib; CDDP, cisplatin; CFI, CFI-402257; DTX, docetaxel; ETP, etoposide Pr exa, prexasertib; MTX, methotrexate; PEM, pemetrexed. (I, K, and L) IB of the indicated proteins in H1944 cells transduced with the indicated vectors, and treated with 200 nM CFI-402257, 100 nM BAY-1217389, or 250 nM CC-671. (J) ELISA of human CXCL10 levels in CM derived from H1944 cells transduced with the indicated vectors, and treated with 100 nM BAY-1217389 (n = 3). All quantitative data are represented as mean ± standard deviation; p values were calculated by unpaired two-tailed Student t test (A, C, and H), or two-way analysis of variance followed by Sidak’s post hoc test (F, J), **p < 0.01. See also Figure S2 and Table S1.
Figure 3.
Figure 3.. MPS1 inhibition induces micronuclei formation and subsequent STING activation in KL cells
(A) Representative confocal microscope images of DAPI staining in H1944 cells treated with 200 nM CFI-402257, 5 nM docetaxel, or 200 nM barasertib. Arrows indicate micronuclei. Inset highlights micronucleus. Scale bars, 10 μm. (B) Number of micronuclei in H1944 cells treated with the indicated DNA-damaging agents (n = 3). (C) Relative messenger RNA (mRNA) expression of CXCL10 (y axis) versus number of micronucleus (x axis) in H1944 cells treated with the indicated DNA-damaging agents. R2 values and p values for the correlation (Pearson’s r correlation) are shown. (D) Quantification of cell cycle analysis through propidium iodide staining for the cells after treatment with 200 nM CFI-402257 (CFI), 2.5 μM cisplatin (CDDP), 5 μM etoposide (ETP), 500 nM pemetrexed (PEM), or 50 μM hydroxyurea (HU) for 48 h. (E and F) Enzyme-linked immunosorbent assay (ELISA) of human CXCL10 or IFN-β levels in CM (E), or immunoblot (IB) of the indicated proteins (F) in H1944 cells treated with 200 nM CFI-402257 (n = 4). GM, growth medium. (G and H) ELISA of human CXCL10 in CM (G), or IB of the indicated proteins (H) in H1944 or THP1 cells treated with 200 nM CFI-402257, or 10 μM ADU-S100 for 24 h (n = 4). THP1 cells were differentiated to macrophages in the presence of 25 nM phorbol 12-myristate13-acetate (PMA) for 48 h. All quantitative data are represented as mean ± standard deviation; p values were calculated by one-way analysis of variance followed by Tukey’s post hoc test (E and G), **p < 0.01. See also Figure S3.
Figure 4.
Figure 4.. Combination treatment with MPS1 and epigenetic inhibitors cooperatively activate the STING pathway
(A and B) Enzyme-linked immunosorbent assay (ELISA) of human CXCL10 or IFN-β levels in CM (A), or immunoblot (IB) of the indicated proteins (B) in H1944 transduced with the indicated vectors, and treated with the indicated drugs (5 μM GSK, and/or 200 nM CFI) in accordance with pretreatment schedule (Figure S4A) (n = 4). (C and D) Fluorescent images (C) and quantification of STING foci containing cells (arrows) (D) in H1944 cells treated with the indicated drugs (5 μM GSK and/or 200 nM CFI) (n = 8). Scale bars, 10 μm. (E and F) ELISA of human CXCL10 or IFN-β levels in CM derived from A549, H23, or A427 transduced with the indicated vectors, and treated with the indicated drugs (100 nM DAC, 5 μM GSK, and/or 200 nM CFI) (n = 4). (G) Schematic of the concept of sequential combination therapy with epigenetic inhibitors and MPS1 inhibitor. Schematic is created with BioRender.com. All quantitative data are represented as mean ± standard deviation; p values were calculated by one-way (D) followed by Tukey’s post hoc test, or two-way (A, E, and F) analysis of variance followed by Sidak’s post hoc test, **p < 0.01. See also Figure S4.
Figure 5.
Figure 5.. MPS1 inhibition upregulates HLAs expression and immune infiltration into peri-tumor region
(A and B) HLA-A.B.C (A) or PD-L1 (B) expression on the cell surface in H1944 cells transduced with the indicated vectors, and treated with the indicated drugs (200 nM CFI, or 25 μM ADU) Data are representative of four independent experiments. Mean fluorescence intensity (MFI) was quantified by FlowJo (right) (n = 4). (C and D) HLA-A.B.C (C) or PD-L1 (D) expression on the cell surface in A549 cells treated with the indicated drugs (100 nM DAC, 5 μM GSK, and/or 200 nM CFI). Data are representative of three independent experiments. Mean fluorescence intensity (MFI) was quantified by FlowJo (right) (n = 3). (E) Schematic of immune cell migration assay using a 3D microfiuidic device with tumor spheroids embedded in a central collagen-filled channel and with immune cells co-cultured in a side channel. (F and G) Representative images of Jurkat-CXCR3 (F) or NK-92 (G) cells migration. Immune cells infiltration into peri-tumor region is quantified by ImageJ (n = 18). Values were normalized to DMSO control. Scale bars, 500 μm. (H and I) IB of the indicated proteins in patient-derived KL or KP cells (H), and DFCI-316 or DFCI-332 cells treated with 100nM DAC, 5 μM GSK126, and/or 100nM BAY-1217389 in accordance with pretreatment schedule as shown in Figure S4A (I). (J) Schematic of co-culture PBMC-derived T-cells with patient-derived KL cells pretreated with 100 nM DAC, 5 μM GSK126, and/or 100 nM BAY-1217389. (K) Enzyme-linked immunosorbent assay (ELISA) of human granzyme B in CM derived from DFCI-316 cells co-cultured with PBMC-derived T-cells (n = 6). (L and M) ELISA of human CXCL10 in CM derived from DFCI-316 or DFCI-332 cells treated with 100 nM DAC, 5 μM GSK126, and/or 100 nM BAY-1217389 (L) (n = 4), and the ratio of infiltration of PBMC-derived T-cells into peri-tumor region using immune cell migration assay (see STAR Methods) (M) (n = 33). All quantitative data are represented as mean ± standard deviation; p values were calculated by the unpaired two-tailed Student t test (F and G), or one-way analysis of variance (ANOVA) followed by Tukey’s post hoc test (C, D, K, and M) or two-way ANOVA followed by Sidak’s post hoc test (A, B, and L), *p < 0.05, **p < 0.01. See also Figure S5.
Figure 6.
Figure 6.. Sequential combination therapy with MPS1 and DNMT inhibitor enhances intra-tumoral T cell infiltration in syngeneic murine KL model
(A) Immunoblot (IB) of the indicated proteins in murine lung cancer cells transduced with the indicated vectors. (B) Quantitative RT-PCR of Sting in murine lung cancer cells treated with 100 nM DAC for 5 days (n = 4). (C) Heatmap of cytokine profiles in CM derived from 393P-K or 393P-KL cells. Scores = log2 fold change (393P-KL/393P-K). Cytokines indicating log2 fold change (L2FC) > 0.2 or L2FC < −0.2 are shown in the heatmap. (D and E) IB of the indicated proteins (D), or Enzyme-linked immunosorbent assay (ELISA) of mouse CXCL10 levels in CM derived from 393P-KL cells (E) treated with the indicated drugs (100 nM DAC, and/or 200 nM CFI or 100 nM BAY) in accordance with pretreatment schedule (n = 4). (F) Schematic of pharmacodynamics study with MPS1 and DNMT inhibitor in syngeneic murine KL model. (G and H) IB of the indicated proteins (G), or quantitative RT-PCR of Cxcl10 (H) in tumor tissues derived from mice treated with the indicated drugs (each group, n = 4). (I–K) Representative CD3 (I) or CD8 (J) IHC images and quantitative analysis (K) from 393P-KL tumors treated with vehicle or combination of DAC and BAY-1217389. Arrows highlight peri-tumoral localization (black) and intra-tumoral localization (red) of CD3+ or CD8+ T cells. QuPath (see STAR Methods) was used to quantify CD3+ or CD8+ T cell infiltration (n = 6). Scale bar, 200 μM. All quantitative data are represented as mean ± standard deviation; p values were calculated by an unpaired two-tailed Student t test (B, H, and K), or two-way analysis of variance followed by Sidak’s post hoc test (E). *p < 0.05, **p < 0.01. See also Figure S6.
Figure 7.
Figure 7.. Sequential combination therapy shows durable therapeutic effect in syngeneic murine KL model
(A) Schematic of short-term efficacy study, CD8+ T cell depletion study, and immune profiling with MPS1 and DNMT inhibitor in syngeneic murine KL model. (B) Mean tumor volume of 393P-KL cells after subcutaneous inoculation into syngeneic 129S2/SvPasCrl mice treated with anti-CD8 neutralization antibody. Mice were treated with anti-CD8 antibody, and/or DAC and BAY-1217389 in accordance with the schedule shown in Figure 7A (n = 8). Blue bar, DAC treatment; red arrows, BAY-1217389 treatment. (C) Mean tumor volume of STING KO 393P-KL cells after subcutaneous inoculation into syngeneic 129S2/SvPasCrl mice. Mice were treated with DAC from day 1 to day 7 and BAY-1217389 on day 8, 9 (n = 8). Blue bar; DAC treatment. Red arrows, BAY-1217389 treatment. (D) Flow cytometric analysis of immune cell populations in tumor tissue treated with or without DAC and BAY-1217389 (n = 5). Tumor tissue were collected and analyzed after 48 h from second BAY-1217389 treatment. n.s., not significant. (E and H) Schematic of long-term efficacy study with MPS1 inhibitor, DNMT inhibitor and/or anti-PD1 antibody in syngeneic murine KL model. (F and G) Tumor volume of 393P-KL cells (F) and mouse body weight (G) after subcutaneous inoculation into syngeneic 129S2/SvPasCrl mice followed by BAY-1217389 on day 8, 9, 21, and 22 (as shown in red arrows) and/or DAC from day1 to day7 (as shown in blue bar) (n = 8). (I and J) Tumor volume of 393P-KL cells (I) and mouse body weight (J) after subcutaneous inoculation into syngeneic 129S2/SvPasCrl mice followed by BAY-1217389 on days 8 and 9 (as shown in red arrows) DAC from day 1 to day 7 (as shown in blue bar), and/or anti-PD1 antibody on day 1, 4, 7, and 10 (as shown in blue arrows) (n = 8). Quantitative data are represented as mean ± SD (D, G, and J) or ±SEM (B and C). p values were calculated by two-way analysis of variance followed by Sidak’s post hoc test (B and C), an unpaired two-tailed Student’s t test (D), or the χ2 test (F and I). *p < 0.05, **p < 0.01. See also Figure S7.

Comment in

References

    1. Amouzegar A, Chelvanambi M, Filderman JN, Storkus WJ, and Luke JJ (2021). STING agonists as cancer therapeutics. Cancers (Basel) 13, 2695. - PMC - PubMed
    1. Aref AR, Campisi M, Ivanova E, Portell A, Larios D, Piel BP, Mathur N, Zhou C, Coakley RV, Bartels A, et al. (2018). 3D microfluidic ex vivo culture of organotypic tumor spheroids to model immune checkpoint blockade. Lab Chip 18, 3129–3143. - PMC - PubMed
    1. Bankhead P, Loughrey MB, Fernandez JA, Dombrowski Y, McArt DG, Dunne PD, McQuaid S, Gray RT, Murray LJ, Coleman HG, et al. (2017). QuPath: open source software for digital pathology image analysis. Sci. Rep. 7, 16878. - PMC - PubMed
    1. Campisi M, Sundararaman SK, Shelton SE, Knelson EH, Mahadevan NR, Yoshida R, Tani T, Ivanova E, Canadas I, Osaki T, et al. (2020). Tumor-derived cGAMP regulates activation of the vasculature. Front. Immunol. 11, 2090. - PMC - PubMed
    1. Canadas I, Thummalapalli R, Kim JW, Kitajima S, Jenkins RW, Christensen CL, Campisi M, Kuang Y, Zhang Y, Gjini E, et al. (2018). Tumor innate immunity primed by specific interferon-stimulated endogenous retroviruses. Nat. Med. 24, 1143–1150. - PMC - PubMed

Publication types