Observational Study
. 2023 Jan;136(1):63-71.e1.
doi: 10.1016/j.amjmed.2022.08.035. Epub 2022 Sep 21.

Evolution of Care and Outcomes Across Surges in Hospitalized Patients with Coronavirus Disease 2019

Affiliations
Observational Study

Evolution of Care and Outcomes Across Surges in Hospitalized Patients with Coronavirus Disease 2019

Patrick J O'Hayer et al. Am J Med. 2023 Jan.

Abstract

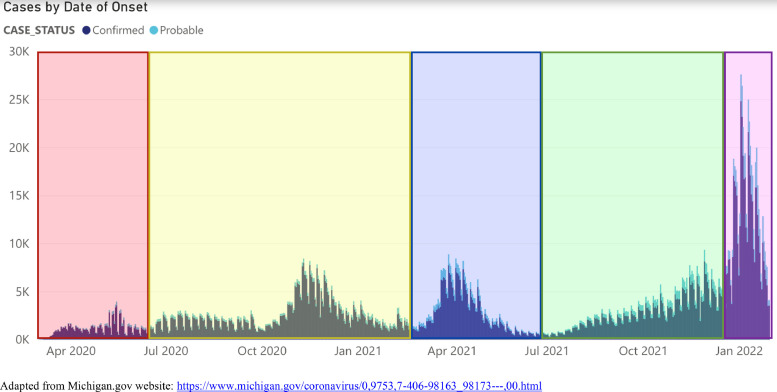
Background: The coronavirus disease 2019 (COVID-19) pandemic has unfolded in distinct surges. Understanding how surges differ may reveal important insights into the evolution of the pandemic and improve patient care.

Methods: We leveraged the Michigan Medicine COVID-19 Cohort, a prospective observational study at an academic tertiary medical center that systematically enrolled 2309 consecutive patients hospitalized for COVID-19, comprising 5 distinct surges.

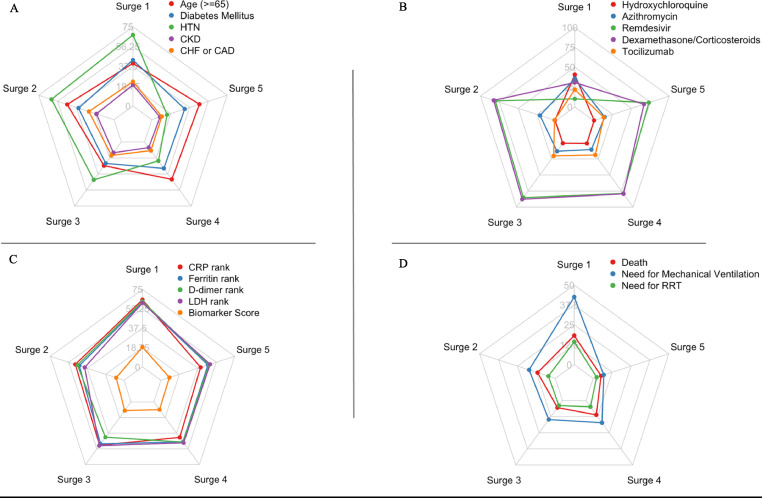
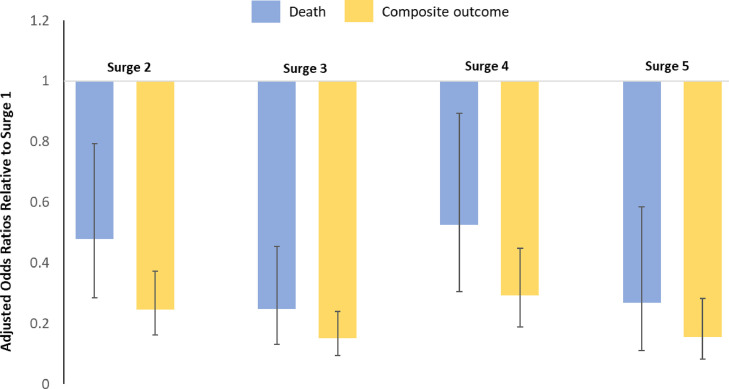
Results: As the pandemic evolved, patients hospitalized for COVID-19 tended to have a lower burden of comorbidities and a lower inflammatory burden as measured by admission levels of C-reactive protein, ferritin, lactate dehydrogenase, and D-dimer. Use of hydroxychloroquine and azithromycin decreased substantially after Surge 1, while use of corticosteroids and remdesivir markedly increased (P < .001 for all). In-hospital mortality significantly decreased from 18.3% in Surge 1 to 5.3% in Surge 5 (P < .001). The need for mechanical ventilation significantly decreased from 42.5% in Surge 1 to 7.0% in Surge 5 (P < .001), while the need for renal replacement therapy decreased from 14.4% in Surge 1 to 2.3% in Surge 5 (P < .001). Differences in patient characteristics, treatments, and inflammatory markers accounted only partially for the differences in outcomes between surges.

Conclusions: The COVID-19 pandemic has evolved significantly with respect to hospitalized patient populations and therapeutic approaches, and clinical outcomes have substantially improved. Hospitalization after the first surge was independently associated with improved outcomes, even after controlling for relevant clinical covariates.

Keywords: Azithromycin; COVID-19; Corticosteroids; Dexamethasone; Hydroxychloroquine; Outcomes; Remdesivir; Surge; Tocilizumab.


Figures

Figure 1
Figure 1
Defining the surges: Covid-19 cases in the State of Michigan. Adapted from Michigan.gov website: https://www.michigan.gov/coronavirus/0,9753,7-406-98163_98173—,00.html, The Covid-19 pandemic has unfolded in distinct surges. The figure represents new cases of Covid-19 over time according to Michigan governmental data. Surge 1 is highlighted in red, Surge 2 in yellow, Surge 3 in blue, Surge 4 in Green, and Surge 5 in Purple.
Figure 2
Figure 2
Radar plots of clinical characteristics, treatments, outcomes and inflammatory markers across 5 surges. In (C), biomarker score refers to the composite biomarker score calculated by the summation of the leave-one-out products of the ranks of biomarkers.
Figure 3
Figure 3
Binary logistic regression modeling: evaluating surges as independent predictors of outcomes, binary logistic regression modeling with in-hospital death and the compositive outcome of death, need for mechanical ventilation, or need for renal replacement therapy as the dependent variable. Results from Model 3 are shown in the Figure, and included the following independent variables: surge (subsequent surges individually relative to surge 1), patient factors (age, sex, race [White vs non-White], body mass index, hypertension, diabetes mellitus, coronary artery disease, heart failure, estimated glomerular filtration rate on admission), treatment variables (remdesivir and corticosteroids), and the composite score of biomarkers of inflammation. Graphs depict the odds ratio (OR) and 95% confidence interval for the given outcome according to each surge comparison, controlling for the aforementioned covariates. CAD = coronary artery disease; CHF = congestive heart failure; CKD = chronic kidney disease; CRP = C-reactive protein; HTN = hypertension; LDH = lactate dehydrogenase; RRT = renal replacement therapy.

Similar articles

Cited by

References

    1. Horby P, Lim WS, et al. RECOVERY Collaborative Group Dexamethasone in hospitalized patients with Covid-19. N Engl J Med. 2021;384(8):693–704. - PMC - PubMed
    1. Sterne JAC, Murthy S, et al. WHO Rapid Evidence Appraisal for COVID-19 Therapies (REACT) Working Group Association between administration of systemic corticosteroids and mortality among critically ill patients with COVID-19: a meta-analysis. JAMA. 2020;324(13):1330–1341. - PMC - PubMed
    1. Matthay MA, Thompson BT. Dexamethasone in hospitalised patients with COVID-19: addressing uncertainties. Lancet Respir Med. 2020;8(12):1170–1172. doi: 10.1016/S2213-2600(20)30503-8. - DOI - PMC - PubMed
    1. Grein J, Ohmagari N, Shin D, et al. Compassionate use of remdesivir for patients with severe Covid-19. N Engl J Med. 2020;382(24):2327–2336. doi: 10.1056/NEJMoa2007016. - DOI - PMC - PubMed
    1. Beigel JH, Tomashek KM, Dodd LE, et al. Remdesivir for the treatment of Covid-19 – final report. N Engl J Med. 2020;383(19):1813–1826. doi: 10.1056/NEJMoa2007764. - DOI - PMC - PubMed

Publication types