

Spatiotemporal pattern recognition and dynamical analysis of COVID-19 in Shanghai, China
- PMID: 36150538
- PMCID: PMC9487177
- DOI: 10.1016/j.jtbi.2022.111279
Spatiotemporal pattern recognition and dynamical analysis of COVID-19 in Shanghai, China
Abstract
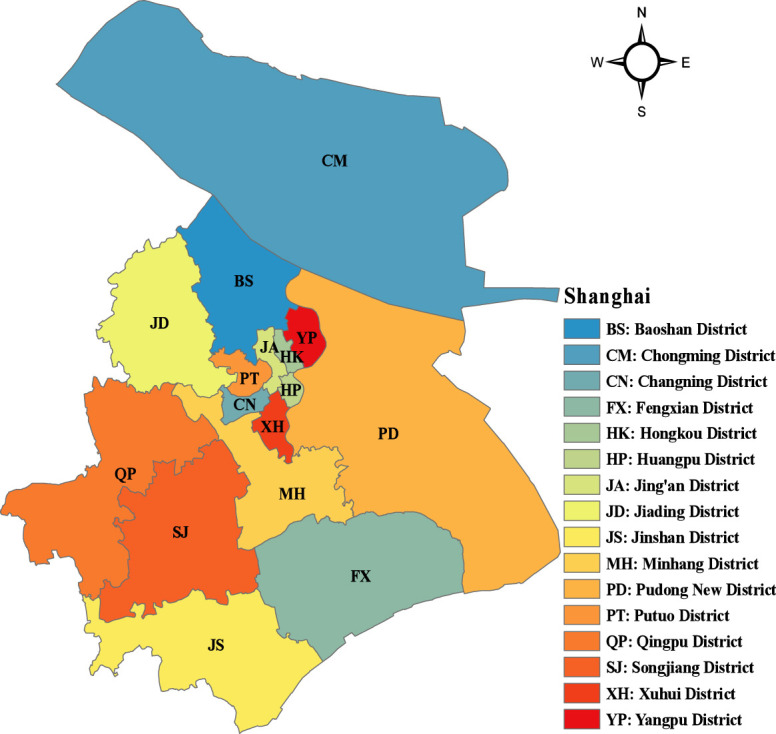
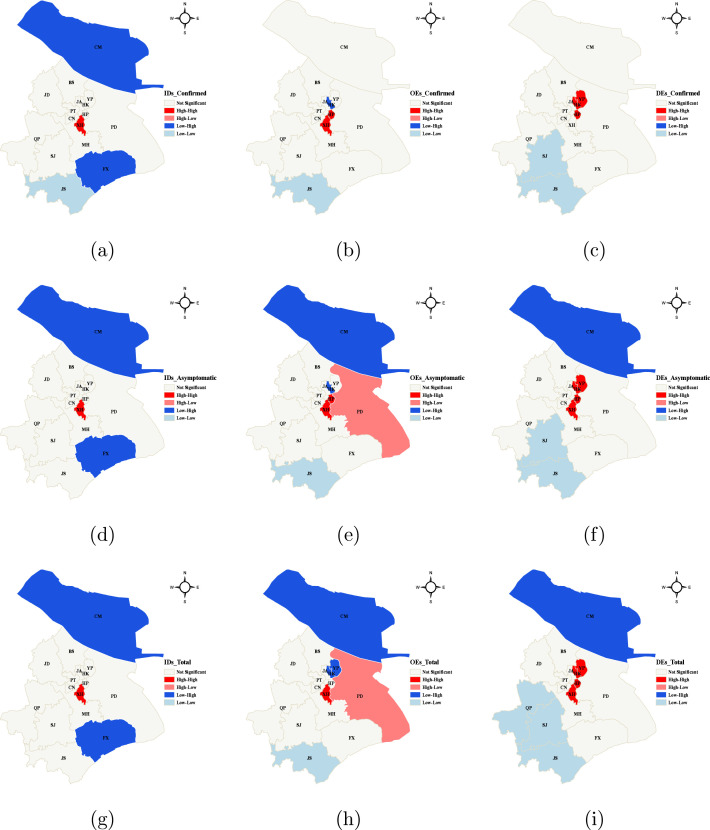
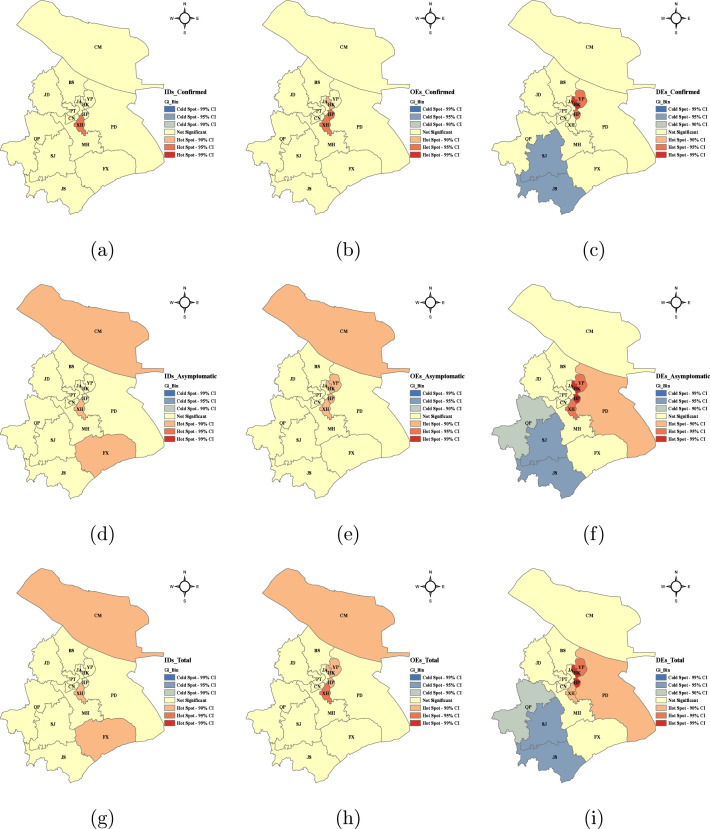
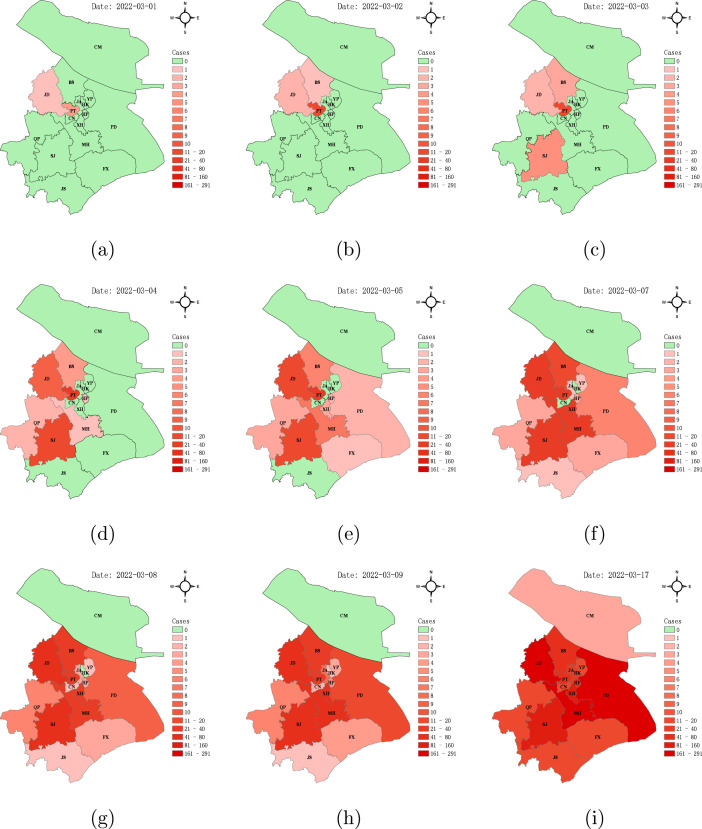
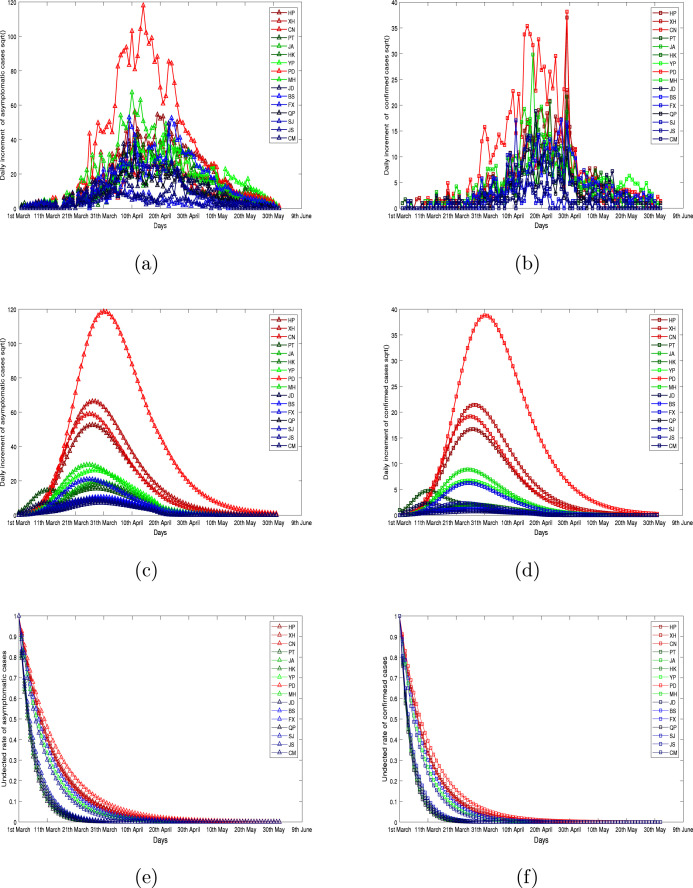
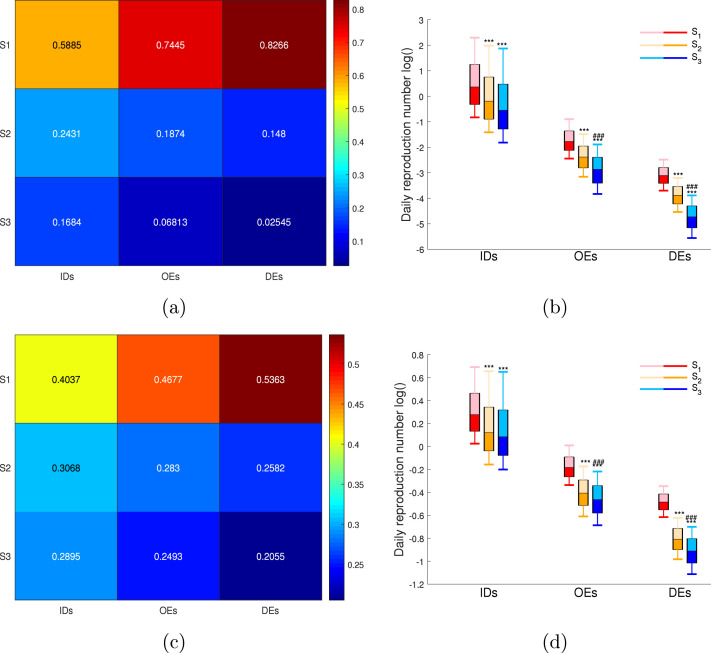
Shanghai suffered a large outbreak of Omicron mutant of COVID-19 at the beginning of March 2022. To figure out the spatiotemporal patterns of the epidemic, a retrospective statistical investigation, coupled with a dynamic model, is implemented in this study. The hotspots of SARS-CoV-2 transmissions are identified, and strong aggregative effects in the decay stage are found. Besides, the visualization of disease diffusion is provided to show how COVID-19 disease invades all districts of Shanghai in the early stage. Furthermore, the calculations from the dynamic model manifest the effect of detections to suppress the epidemic dissemination. These results reveal the strategies to improve the spatial control of disease.
Keywords: Autocorrelation analysis; Daily reproduction number; Dynamic model; Spatial statistics.
Copyright © 2022 Elsevier Ltd. All rights reserved.
Conflict of interest statement
Declaration of Competing Interest The authors declare that they have no known competing financial interests or personal relationships that could have appeared to influence the work reported in this paper.
Figures
Similar articles
-
Spatio-temporal distribution characteristics of COVID-19 in China: a city-level modeling study.BMC Infect Dis. 2021 Aug 14;21(1):816. doi: 10.1186/s12879-021-06515-8. BMC Infect Dis. 2021. PMID: 34391402 Free PMC article.
-
Epidemiological characteristics and dynamic transmissions of COVID-19 pandemics in Chinese mainland: A trajectory clustering perspective analysis.Epidemics. 2023 Dec;45:100719. doi: 10.1016/j.epidem.2023.100719. Epub 2023 Sep 26. Epidemics. 2023. PMID: 37783112
-
[Spatiotemporal changes of COVID-19 outbreak in Shanghai].Zhonghua Liu Xing Bing Xue Za Zhi. 2022 Nov 10;43(11):1699-1704. doi: 10.3760/cma.j.cn112338-20220608-00511. Zhonghua Liu Xing Bing Xue Za Zhi. 2022. PMID: 36444450 Chinese.
-
Optimal control strategies of SARS-CoV-2 Omicron supported by invasive and dynamic models.Infect Dis Poverty. 2022 Nov 26;11(1):115. doi: 10.1186/s40249-022-01039-y. Infect Dis Poverty. 2022. PMID: 36435792 Free PMC article.
-
Spatiotemporal analysis of COVID-19 outbreaks in Wuhan, China.Sci Rep. 2021 Jul 1;11(1):13648. doi: 10.1038/s41598-021-93020-2. Sci Rep. 2021. PMID: 34211038 Free PMC article.
Cited by
-
Clinical and virological features of asymptomatic and mild symptomatic patients with SARS-CoV-2 Omicron infection at Shanghai Fangcang shelter hospital.Immun Inflamm Dis. 2023 Sep;11(9):e1033. doi: 10.1002/iid3.1033. Immun Inflamm Dis. 2023. PMID: 37773703 Free PMC article.
-
Lessons drawn from Shanghai for controlling highly transmissible SARS-CoV-2 variants: insights from a modelling study.BMC Infect Dis. 2023 May 16;23(1):331. doi: 10.1186/s12879-023-08316-7. BMC Infect Dis. 2023. PMID: 37194011 Free PMC article.
-
The impact of isolation on comorbidity of PTSD symptoms and depression: evidence from PTRP-5-6 in China.BMC Public Health. 2024 Jan 2;24(1):21. doi: 10.1186/s12889-023-17450-5. BMC Public Health. 2024. PMID: 38166952 Free PMC article.
-
An SEIHR model with age group and social contact for analysis of Fuzhou COVID-19 large wave.Infect Dis Model. 2024 Apr 22;9(3):728-743. doi: 10.1016/j.idm.2024.04.003. eCollection 2024 Sep. Infect Dis Model. 2024. PMID: 38689855 Free PMC article.
References
-
- Anon . 2022. Real time big data report of epidemic situation for novel coronavirus pneumonia. https://voice.baidu.com/act/newpneumonia/newpneumonia/?from=osari_aladin.... (Accessed 31 May 2022)
-
- Anselin L. Local indicators of spatial association - LISA. Geogr. Anal. 1995;27(2):93–115. doi: 10.1111/j.1538-4632.1995.tb00338.x. - DOI
Publication types
MeSH terms
LinkOut - more resources
Full Text Sources
Medical
Miscellaneous
