. 2022 Oct 5;9(5):ENEURO.0058-22.2022.
doi: 10.1523/ENEURO.0058-22.2022. Print 2022 Sep-Oct.

Surround Inhibition Mediates Pain Relief by Low Amplitude Spinal Cord Stimulation: Modeling and Measurement

Affiliations

Surround Inhibition Mediates Pain Relief by Low Amplitude Spinal Cord Stimulation: Modeling and Measurement

John E Gilbert et al. eNeuro. .

Abstract

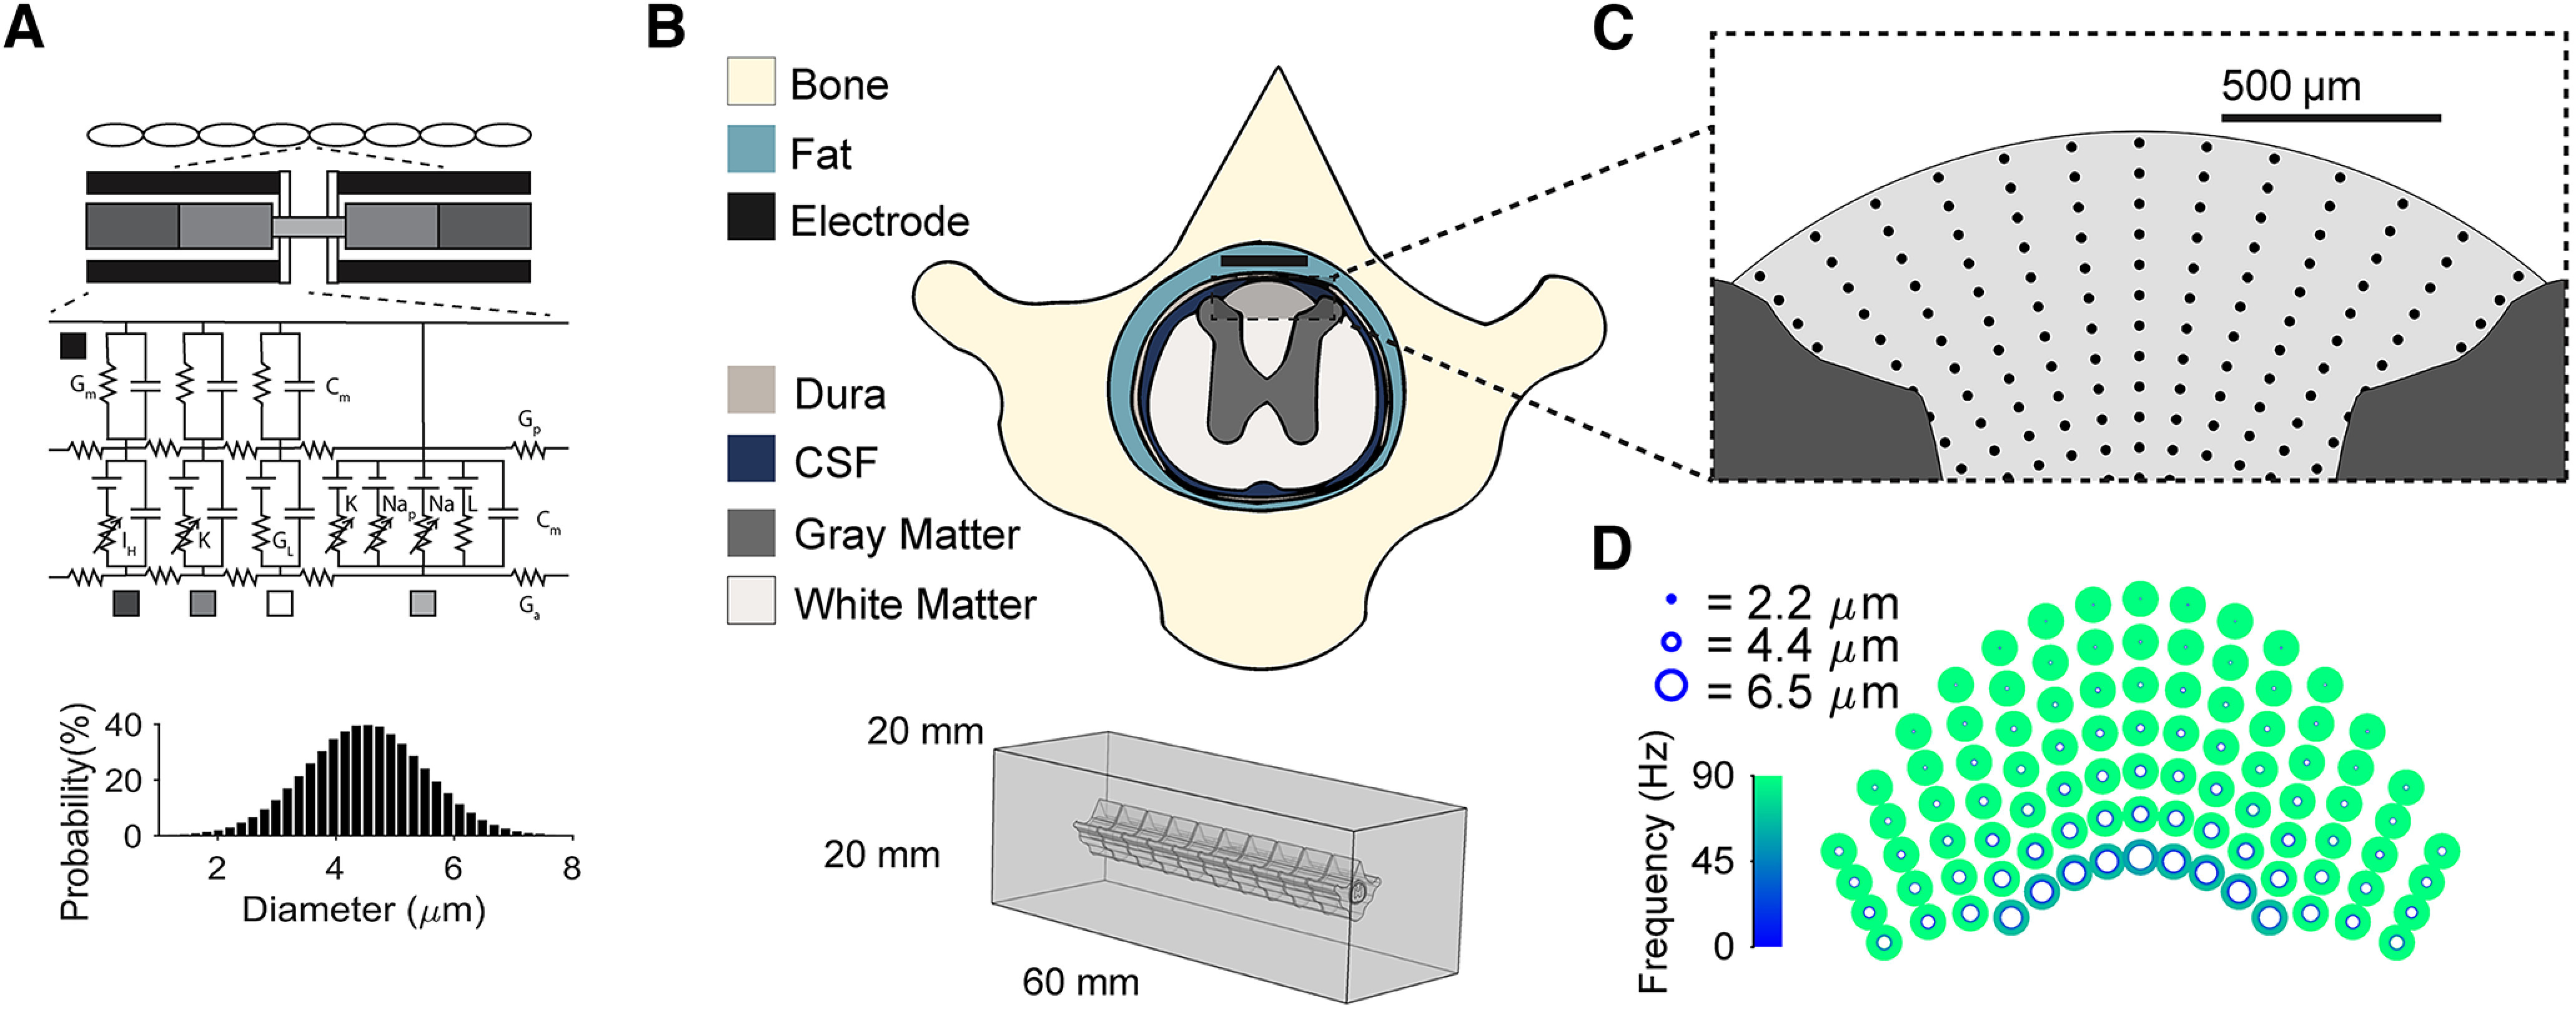
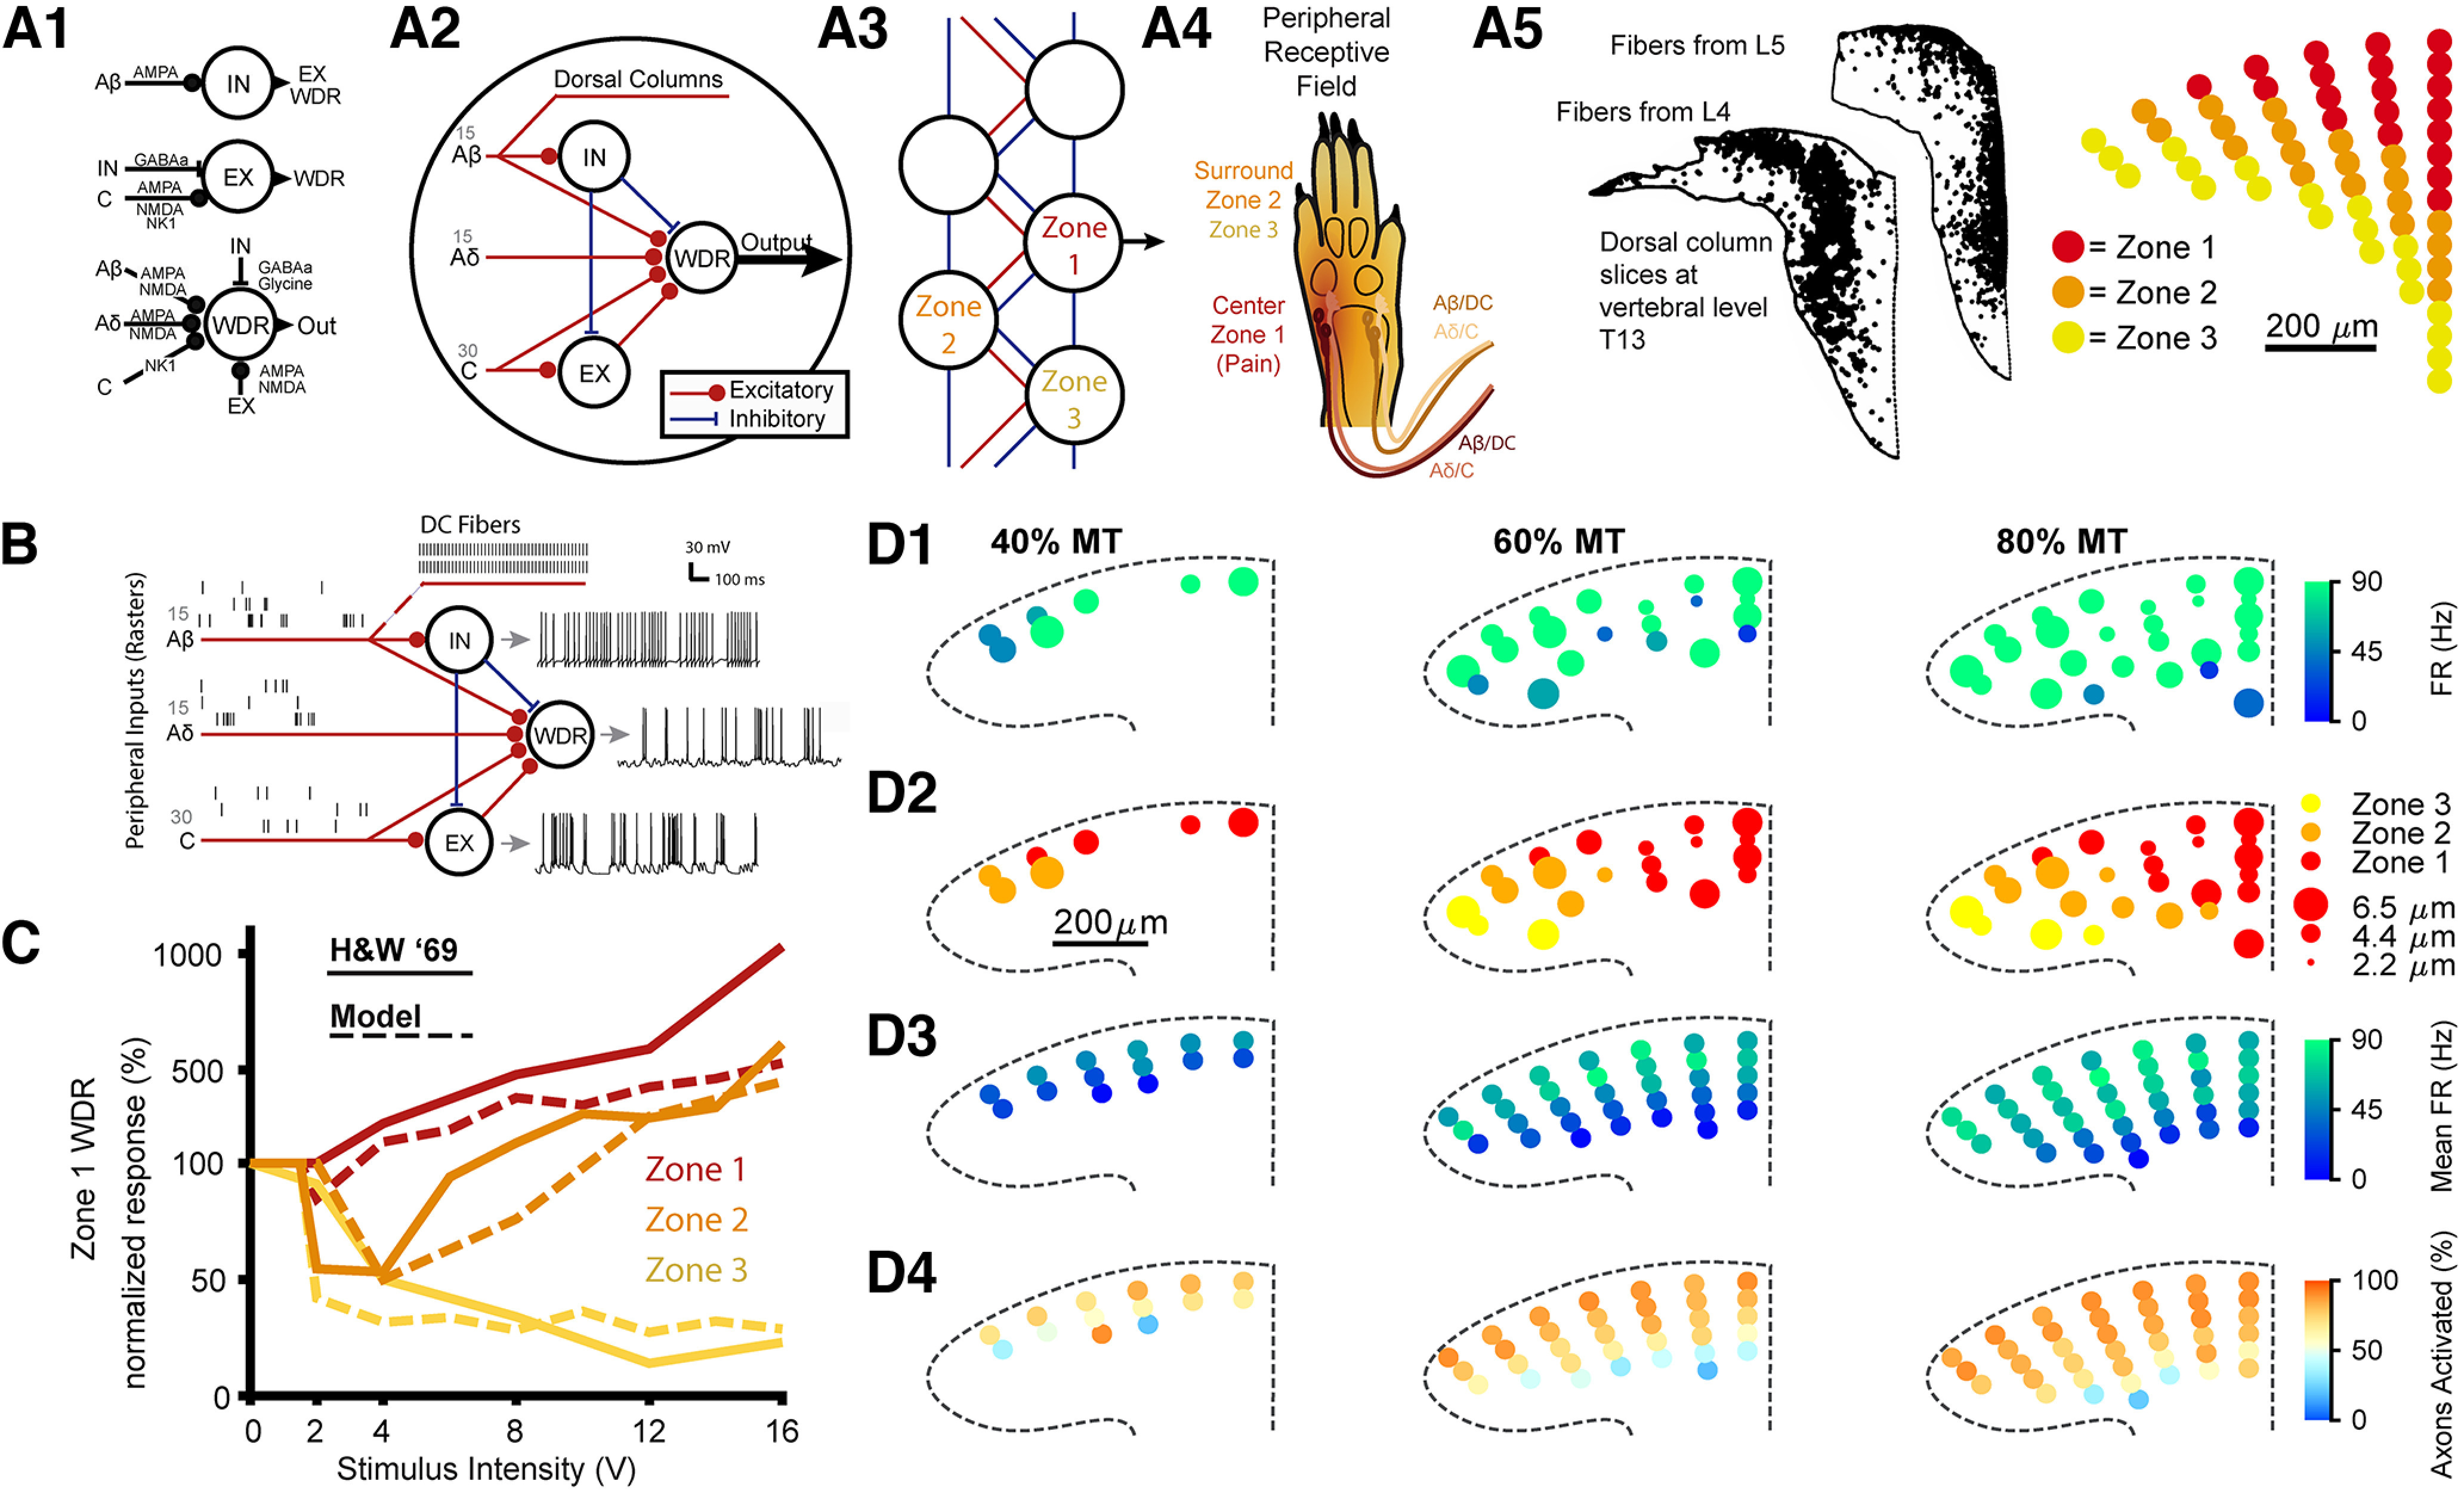
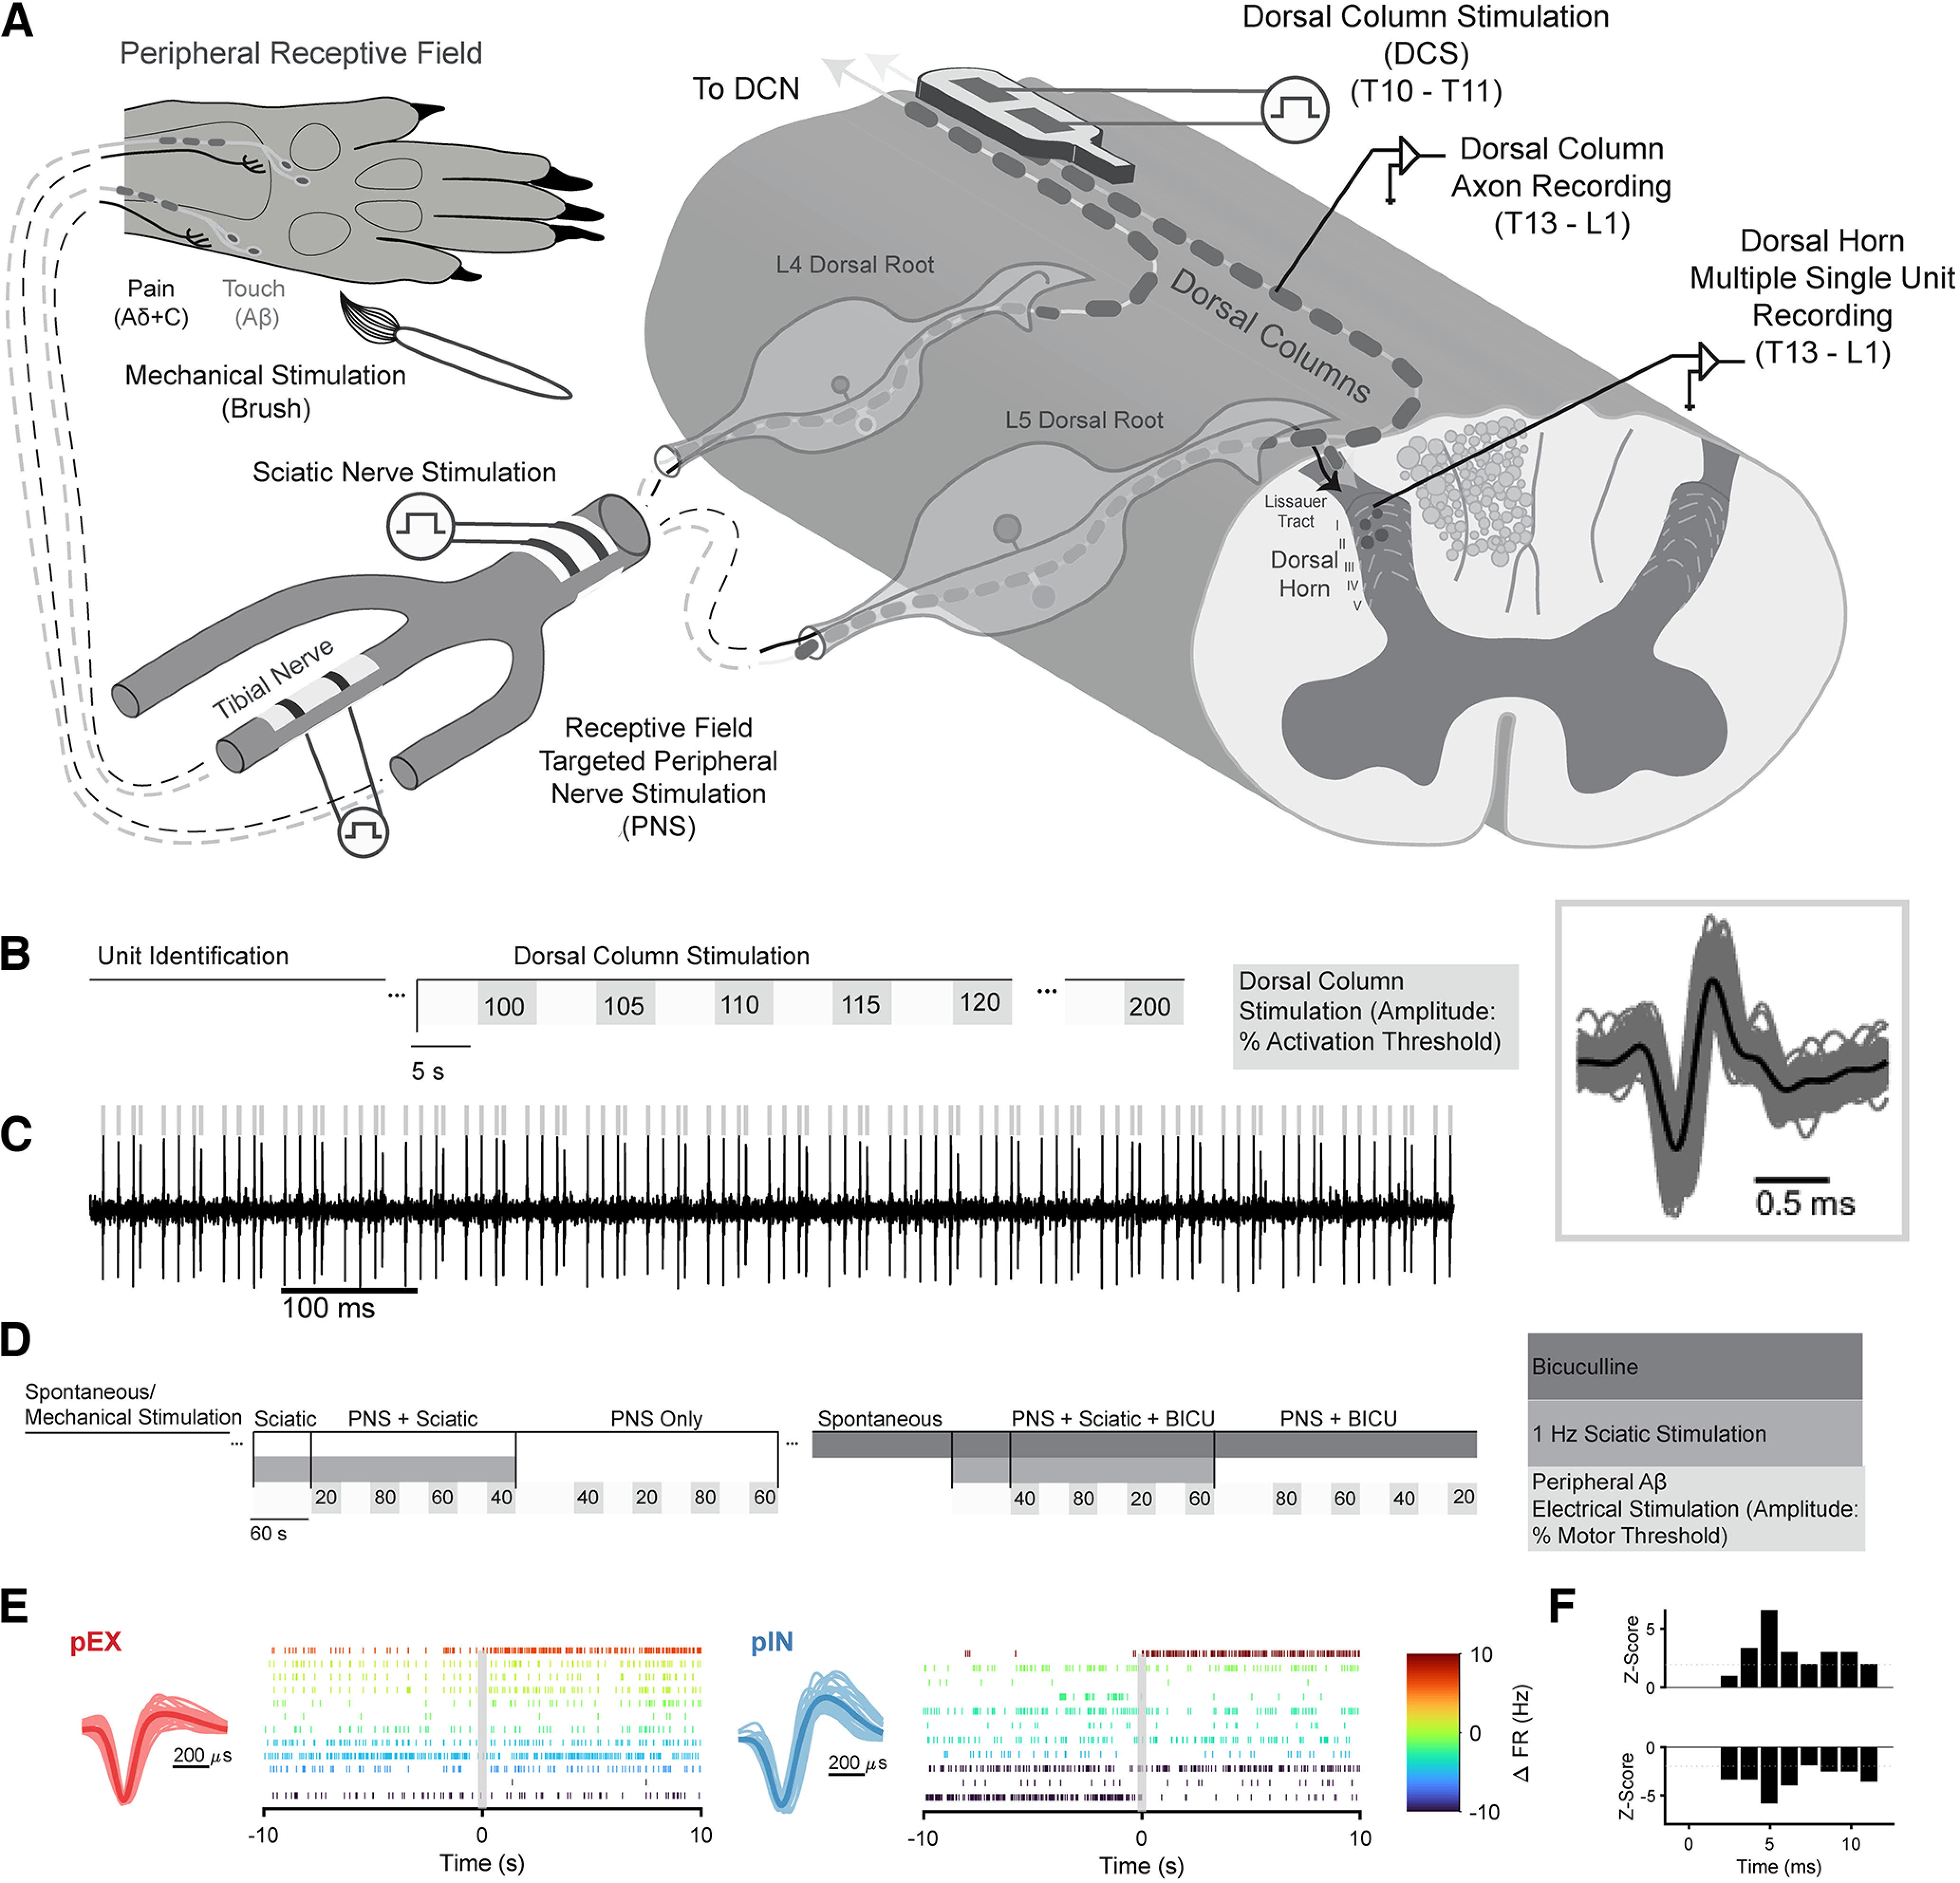
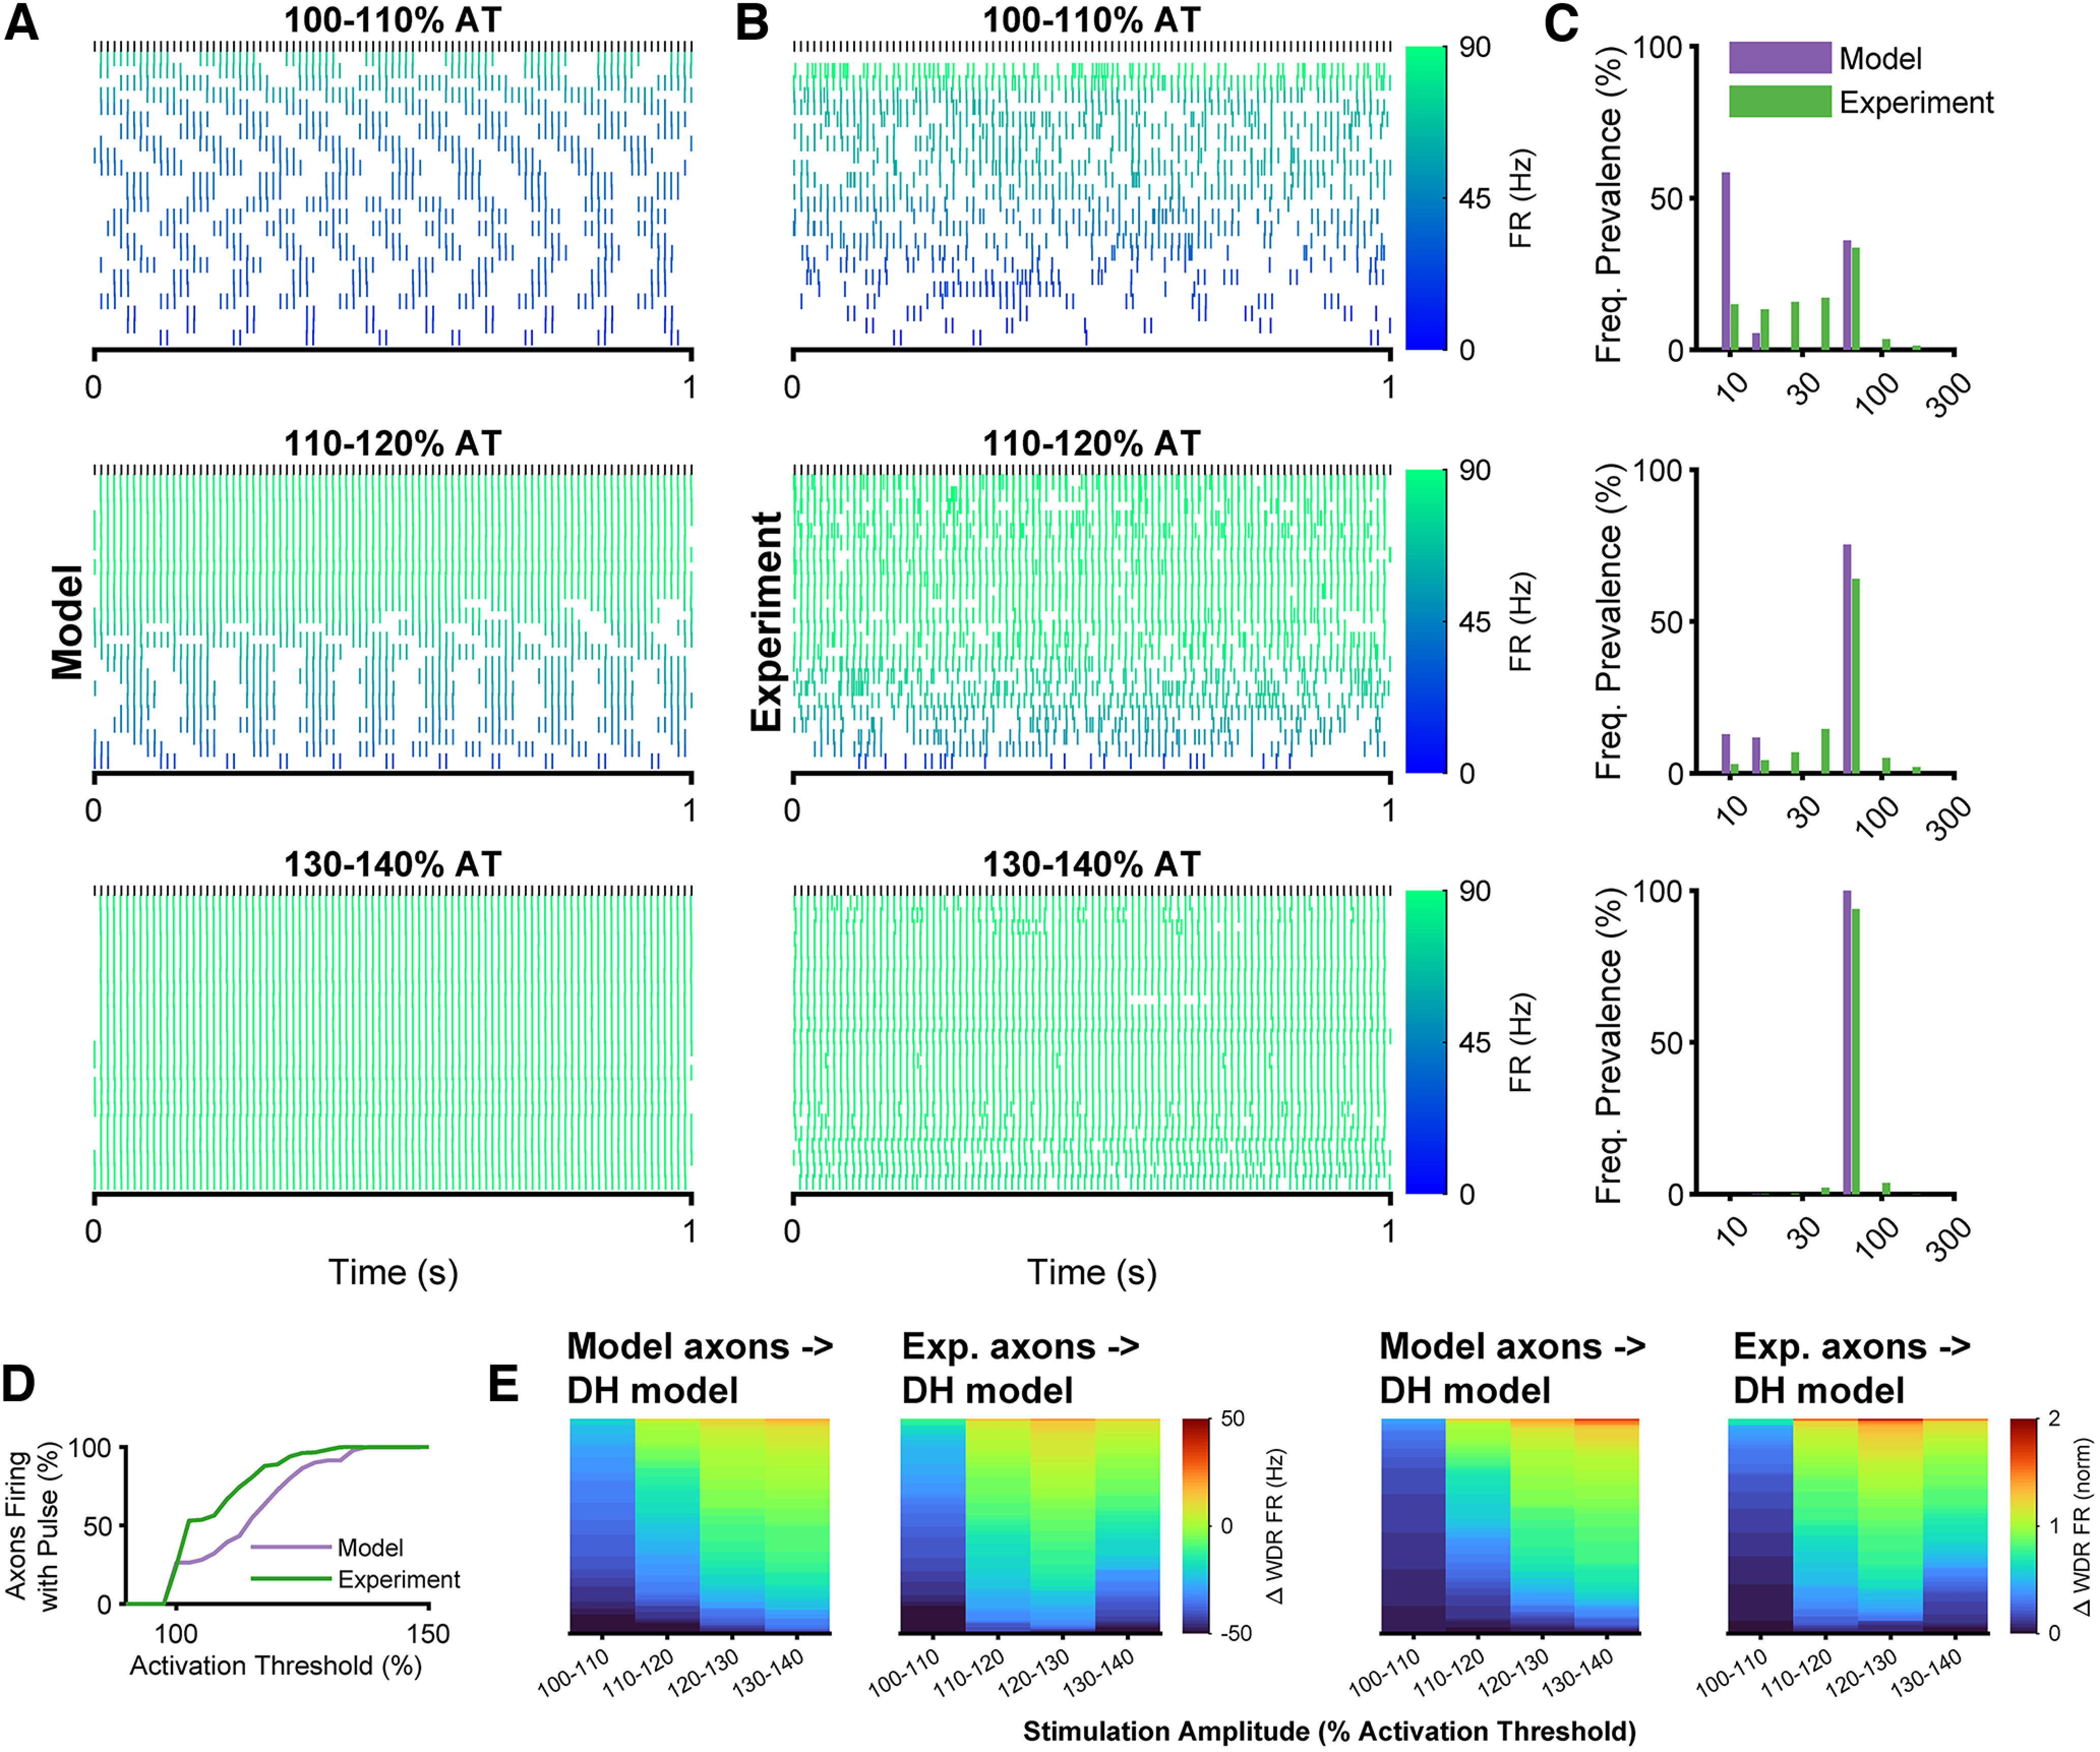
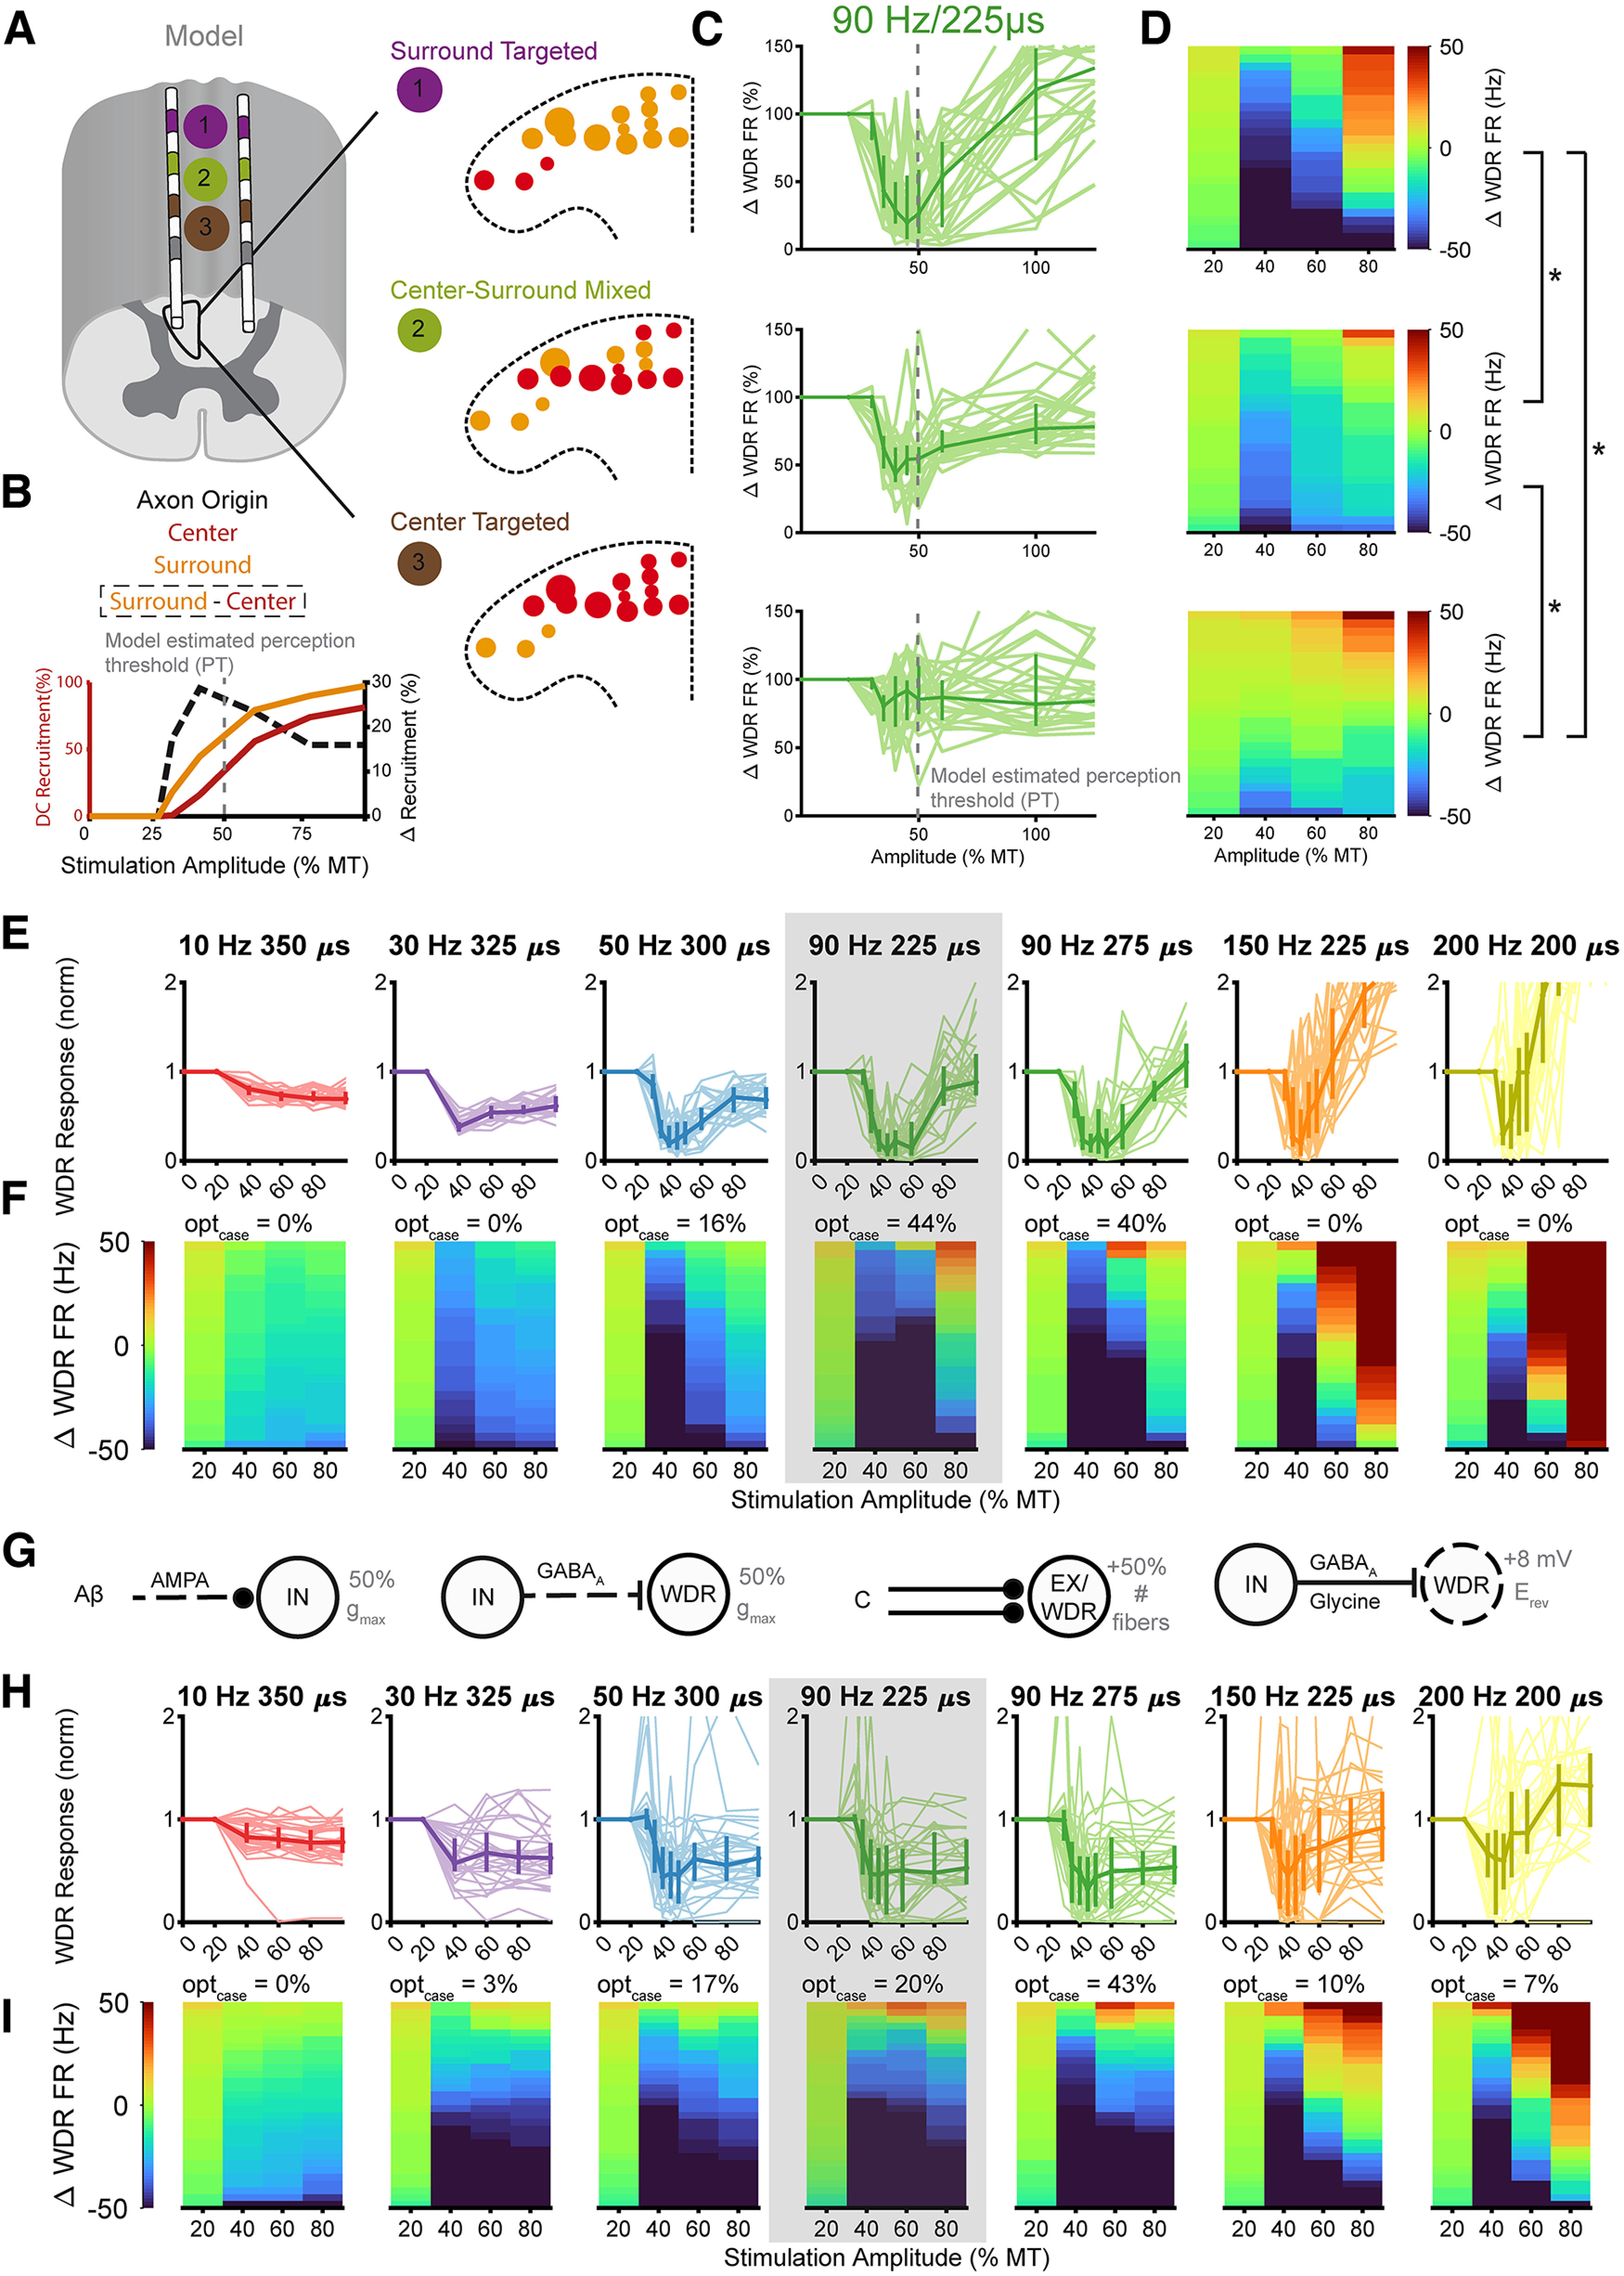
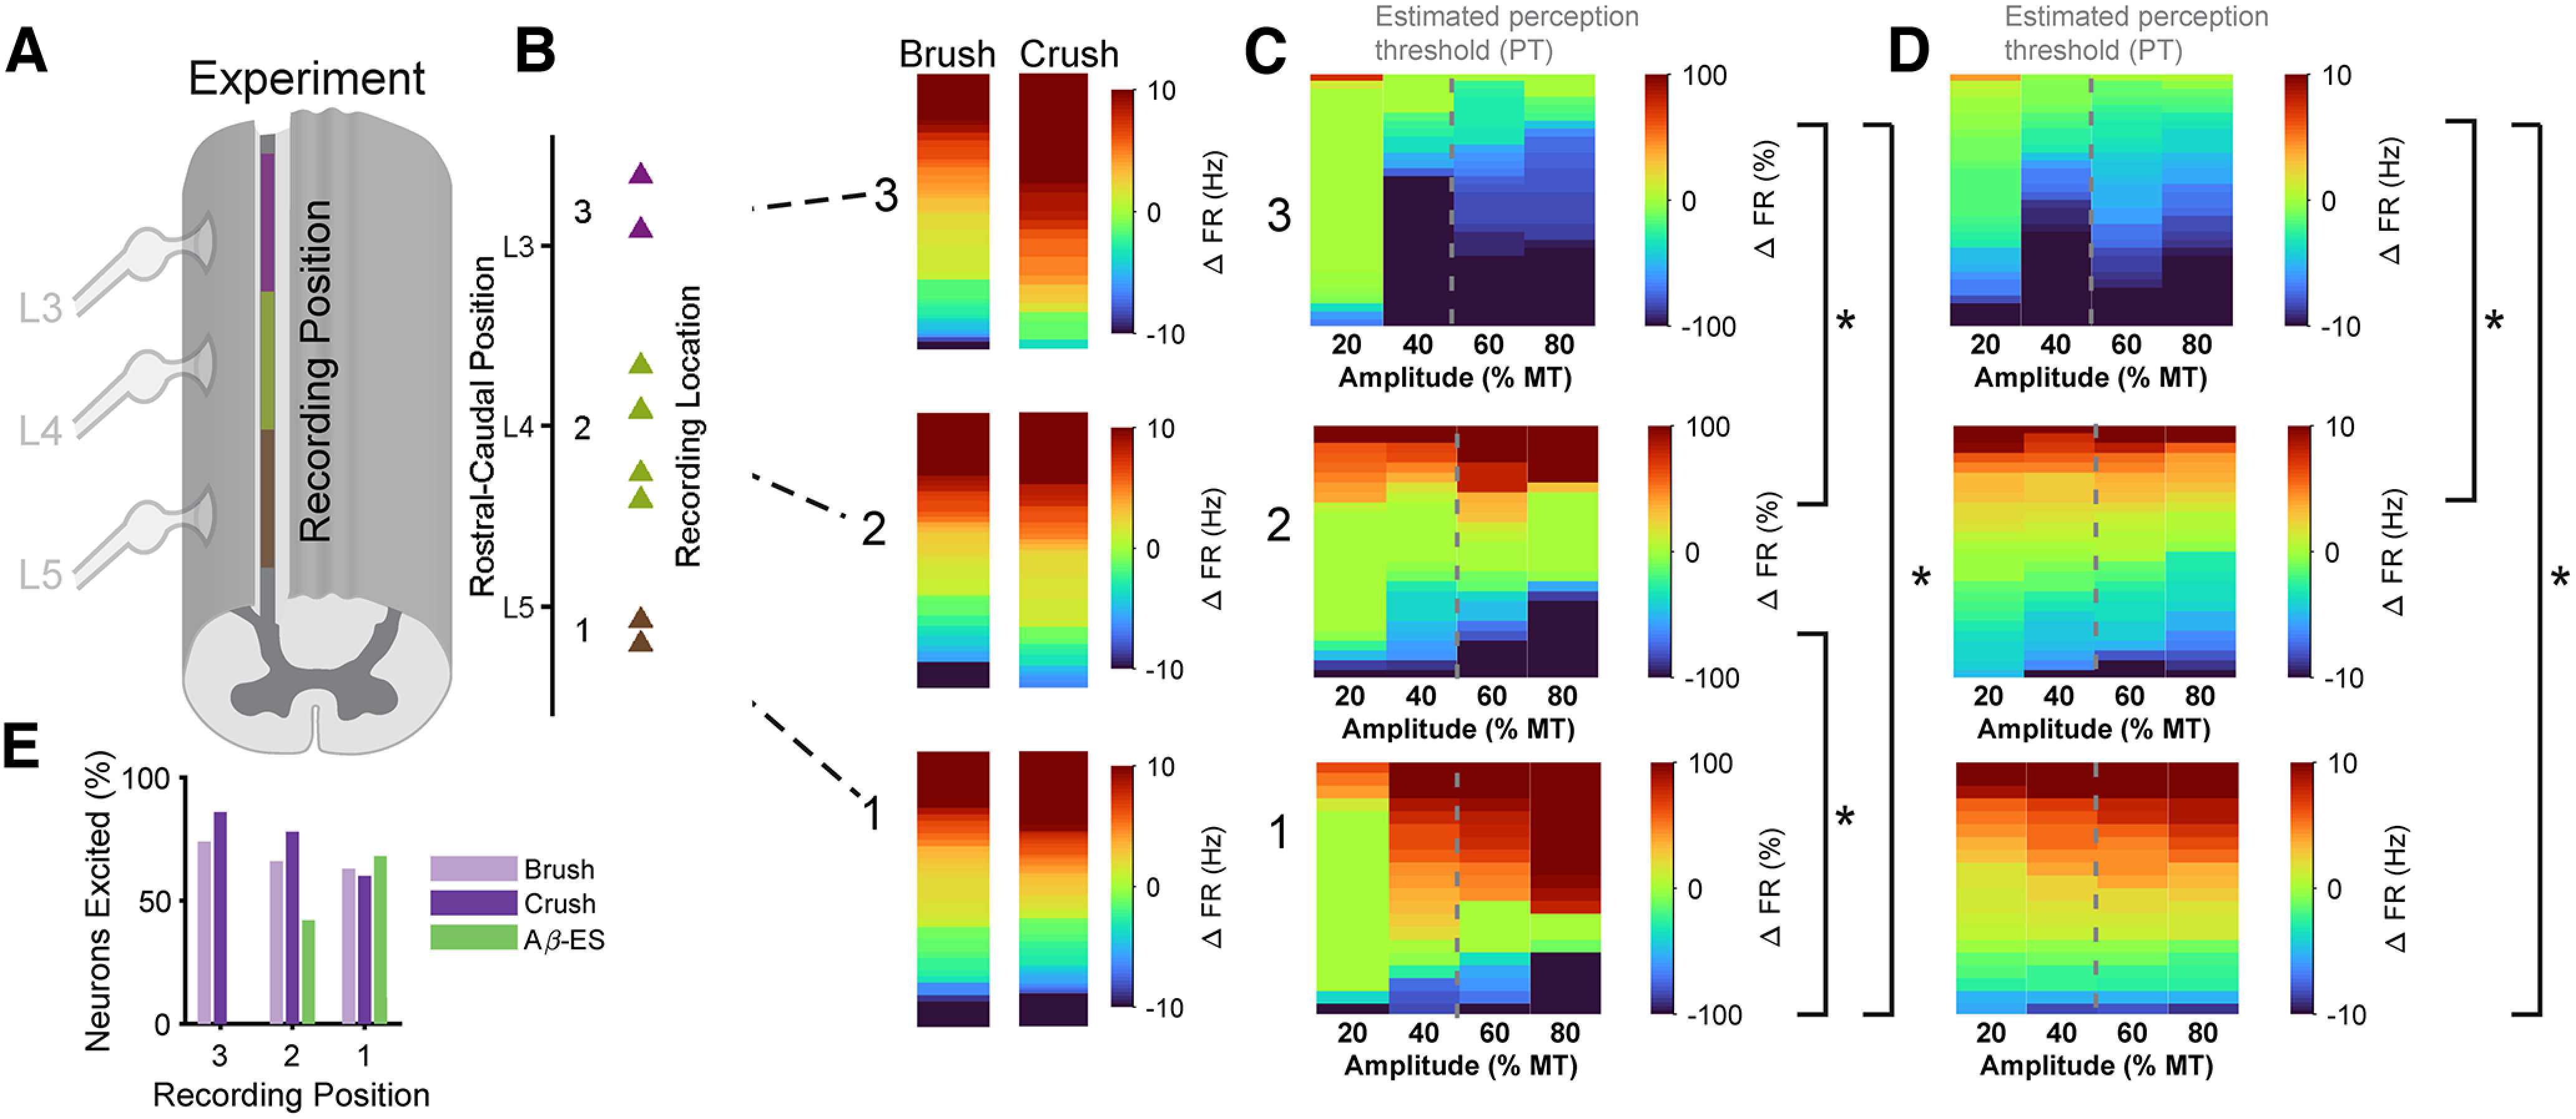
Low-frequency (<200 Hz), subperception spinal cord stimulation (SCS) is a novel modality demonstrating therapeutic efficacy for treating chronic neuropathic pain. When stimulation parameters were carefully titrated, patients experienced rapid onset (seconds-minutes) pain relief without paresthesia, but the mechanisms of action are unknown. Using an integrated computational model and in vivo measurements in urethane-anesthetized rats, we quantified how stimulation parameters (placement, pulse width, frequency, and amplitude) influenced dorsal column (DC) axon activation and neural responses in the dorsal horn (DH). Both modeled and recorded DC axons responded with irregular spiking patterns in response to low-amplitude SCS. Maximum inhibition of DH neurons occurred at ∼80% of the predicted sensory threshold in both modeled and recorded neurons, and responses were strongly dependent on spatially targeting of stimulation, i.e., the complement of DC axons activated, and on stimulation parameters. Intrathecal administration of bicuculline shifted neural responses to low-amplitude stimulation in both the model and experiment, suggesting that analgesia is dependent on segmental GABAergic mechanisms. Our results support the hypothesis that low-frequency subperception SCS generates rapid analgesia by activating a small number of DC axons which inhibit DH neuron activity via surround inhibition.

Keywords: computational modeling; in vivo recording; neuropathic pain; spinal cord stimulation.


Figures

Figure 1.
Figure 1.
Modeling dorsal column (DC) axon responses to spinal cord stimulation. A, Individual DC axons were modeled using a modified MRG model axon (McIntyre et al., 2002). Axon diameters were selected from a normal distribution with mean of 4.4 μm and a SD of 1 μm. B, A previously published finite element method model of the rat spinal cord was used to calculate the electric potentials at the model axon compartments during SCS (Pelot et al., 2018). C, Axons with diameters from 2 to 8 μm were modeled in the DCs at the locations shown with black dots. D, Example responses of DC axons in all positions and all diameters at 60% MT/60 μA. Only activated axons are shown and the color of each axon represents its firing rate in response to symmetric biphasic rectangular 90-Hz, 275-μs stimulation.
Figure 2.
Figure 2.
Modeling DC axon and dorsal horn (DH) network responses. A1, Synaptic connections between neurons for a single node in the model. A2, Neural connections between peripheral afferent fibers, DC axons, inhibitory and excitatory interneurons, and a WDR projection neuron within a single node of the DH model. A3, Connections between nodes in the multinodal circuit model of the DH. Inhibitory and excitatory connections between nodes are from local interneurons to WDR neurons in the other nodes. A4, Representation of center and surround in peripheral receptive field. Center axons represent the pain area (zone 1), while surround is split into near surround (zone 2), and far surround (zone 3). A5, Representation of center and surround in the DCs. Axons from the L5 nerve root are most medial and dorsal at the T13 vertebral segment (Smith and Bennett, 1987) and axons from the surrounding area from the L4 nerve root are positioned ventrally and laterally from the center fibers. Axons in the model were assigned to different zones based on their position within the DCs. B, Example peripheral afferent inputs and neuron responses. Peripheral afferent spike trains representing pain inputs applied to the model through the Aβ inputs are shown on the left. Transmembrane voltage traces for each model neuron are shown on the right. See Extended Data Figure 2-1 for example responses of WDR neurons over time during the simulations. C, Response of center model WDR neuron to stimulation in each receptive field compared with experimental recordings of Lamina V WDR neurons. Increasing amplitude was modeled as increasing afferent axon recruitment in each peripheral zone based on normalized recruitment curves (Sdrulla et al., 2015). Solid lines represent the experimental responses while dashed lines represent model responses. The y-axis is linear below 100% and log above 100%. D1, Individual DC topography showing an example of DC activation, i.e., inputs to the network model at different amplitudes. Circle size represents axon diameter and circle color represents axon firing rate. D2, The position and corresponding zone of each activated axon with parameters from D1. D3, Average firing rate for all positions across 25 randomized samples DC topography. D4, Percent of axons activated in each position across 25 samples of DC topography. See Extended Data Figure 2-1 for DC axon responses to kilohertz frequency stimulation.
Figure 3.
Figure 3.
Experiment recording setup. A, Individual DC axons and multiple DH neurons were recorded in separate animals. DC axons were recorded from the lumbar spinal cord using a bipolar tungsten microelectrode. Multiple single units were recorded from the lumbar dorsal horn using a 16- or 32-contact silicon microelectrode. The sciatic nerve was exposed to stimulate individual branches or the entire sciatic nerve. DH neurons were evaluated for their response to receptive field targeted peripheral nerve stimulation and stimulation of the full sciatic nerve. B, Timeline of evaluation of DC axon responses to bipolar stimulation at T10–T11 at different amplitudes. Amplitudes were randomized across trial blocks. C, Example DC axon recording during dorsal column stimulation (DCS). Black trace is raw recording, gray lines indicate detected spikes. The gray box shows the waveforms of the recorded unit. D, Timeline of DH recordings. After identifying units from the receptive field area using mechanical stimulation of the ipsilateral rat hindpaw, spontaneous activity was recorded for at least 10 min. Next, multiple single units were recorded with different (randomized) amplitudes of tibial nerve stimulation with and without concomitant stimulation of the sciatic nerve at C-fiber amplitude. In some animals, neurons were also recorded after applying bicuculline (BICU) intrathecally at the recording site. See Extended Data Figure 3-1 for responses of DH neurons to mechanical stimulation before and after application of BICU. E, Individual units were classified based on their waveform shape (Snyder et al., 2016; Lee et al., 2019). Plots left of raster show the sorted waveforms of individual units and the mean waveform. Raster plots show 10 s of monophasic putatively excitatory (pEX) and biphasic putatively inhibitory (pIN) unit responses to receptive-field targeted stimulation at 60% MT. Raster color represents the change in firing rate over the full 30-s window of stimulation. F, Example Z-scores calculated for one neuron excited by Aβ-ES and one neuron inhibited by Aβ-ES. Neurons were classified as responders if three or more consecutive bins exhibited |z| ≥ 1.96 (Montgomery, 2006).
Figure 4.
Figure 4.
DC axon responses to dorsal column stimulation. A, Raster plots of individual model axon responses to 90-Hz/225-μs stimulation at different amplitudes, normalized to each axon’s activation threshold (AT) and divided into three amplitude subgroups. The color of the raster indicates the average firing rate of each axon. B, Raster plots of 24 individual DC axon responses recorded in vivo to 90-Hz/225-μs stimulation at amplitudes normalized to the AT of each axon. C, Prevalence of firing frequencies across the population of DC axons for model and experiment. Frequency prevalence was calculated from the interspike interval (ISI) probability normalized to the average stimulation frequency of each bin. D, Percent of axons that responded to an individual stimulation pulse as a function of stimulation amplitude for the model DC axons and experimental recordings. E, Model WDR responses to DC axon inputs across 100 trials at each amplitude. Raw changes in WDR firing rate (left) and change in WDR firing rate normalized to the baseline firing rate (right) for both model and experimental DC spike times.
Figure 5.
Figure 5.
Model responses to low-rate, low-amplitude SCS depend on spatial targeting, stimulation parameters (amplitude, pulse width, rate), and pain state. A, Spatial targeting in the model was simulated by altering the population of DC axons that was activated at each amplitude. We changed the peripheral origin of model DC axons based on the rostral-caudal position of stimulation. For stimulation in the most caudal position (brown), axons from the center of the peripheral receptive field were positioned in the most medial and dorsal positions within the DCs (see Fig. 1; Smith and Bennett, 1987). Conversely, for stimulation in the most rostral position (purple), axons from the surround were in the most medial and dorsal positions. Targeting in between (green) mixed center and surround axons. B, Change in DC axon recruitment across stimulation amplitudes with surround targeting (purple). Surround and center axon recruitment was best differentiated at 40–50% MT, below the estimated PT. C, Responses of model WDR neurons with each stimulation target, i.e., complement of DC axons that were activated. Vertical dashed line indicates model PT estimated as 50% of the MT (Shechter et al., 2013). D, Raw change in WDR firing rate at 20%, 40%, 60%, and 80% of estimated MT. Lines with asterisks (*) represent significant changes in the population response between stimulation positions (ANOVA, post hoc Tukey’s test, p < 0.05). E, Model WDR neuron responses to different amplitudes of SCS at seven different frequency/pulse width combinations. Each line represents one individual distribution of DC axon activation. Bold lines represent median response and error bars represent the 25th and 75th percentiles of the responses. F, Raw changes in firing rate at 20%, 40%, 60%, and 80% of model estimated MT. Estimated model MT was 100 μA, so 20% MT was 20-μA stimulation. Responses are sorted by the change in firing rate at each amplitude. G, Representation of modeled changes in network states representing neuropathic pain: reduction in conductance of Aβ fiber weight to the inhibitory interneuron, reduction in the GABAergic conductance from the inhibitory interneuron to WDR projection neuron, increase in the number of active C/Aδ fibers, and increase in the reversal potential of inhibitory synapses. H, Model WDR neuron responses by stimulation amplitude at seven different combinations of frequency and pulse width. Light lines represent individual responses from 30 different model pain states. Dark lines represent the median response and error bars represent the 25th and 75th percentiles. I, Sorted raw changes in firing rate for all model WDR neurons at each combination of frequency and pulse width.
Figure 6.
Figure 6.
Segmental application of bicuculline disrupted inhibition from Aβ-ES. A, Changes in firing rate compared with spontaneous activity of pEX neurons before application of bicuculline during 90-Hz stimulation at different stimulation amplitudes (percentage of motor threshold). A1, Changes in firing rate normalized to the peak change in firing rate. A2, Raw changes in firing rate. B, Same as A, but for pIN neurons. C, Mean normalized changes in pEX and pIN neuron responses to stimulation at different amplitudes. D, pEX (left) and pIN (right) neurons counted as responders for each stimulation amplitude. Colored boxes indicate neurons that are responders to stimulation and gray boxes indicate nonresponders. See Extended Data Figure 6-1 for responses to low-amplitude Aβ-ES and C-fiber sciatic nerve stimulation. E–H, Same as A–D, but for neurons recorded after application of bicuculline. Error bars represent SE. Asterisks indicate significant difference between stimulation amplitudes (rmANOVA, p < 0.05, post hoc Tukey’s test, *p < 0.05, **p < 0.01, ***p < 0.001). I, Example PSTHs of simultaneously recorded units at each amplitude and for nonbicuculline and bicuculline conditions. Neurons were normalized individually by dividing by their spontaneous firing rate (not across amplitudes as in B, F). Includes both responders and nonresponders, but neurons with large excitatory responses (>200% of spontaneous firing rate) were not included.
Figure 7.
Figure 7.
Responses of DH neurons to Aβ-ES depend on stimulation amplitude and location (receptive field targeting). A, Individual DH neuron responses were sorted into three groups based on the location where they were recorded. B, Normalized changes in pEX neuron activity divided by recording position. pIN neuron activity did not depend on recording position (Extended Data Fig. 7-1). C, False color maps of changes in pEX neuron activity versus baseline activity split by recording position. D, Same as C, but raw firing rate changes versus baseline. Lines with asterisks (*) represent significant changes in the population response between stimulation positions (ANOVA, post hoc Tukey’s test, p,0.05). In C, D, data are from pEX neurons classified as responders by recording location, and the gray dotted lines between 40% an 60% MT represents estimated PT. E, Percent of pEX neurons excited compared with spontaneous activity at each recording position for peripheral mechanical stimuli (brush, crush) and for Aβ-ES.
Figure 8.
Figure 8.
Bicuculline (BICU) affects clustered network responses to stimulation. A, Normalized neuron responses to peripheral Aβ-ES at 50 Hz and 90 Hz were clustered from their first two principal components using fuzzy c-means clustering into two to five clusters. Top plots show responses in component space. Bottom plots show the mean normalized response of each cluster by amplitude. Quantitative analysis identified either two (Davies and Bouldin, 1979) or four (Rousseeuw, 1987) as the optimal number of clusters, and boxes were placed around these plots. B, Percent of neurons in each cluster split up by neuron class (pEX and pIN), pain condition (non-BICU and BICU), and stimulation type (50- and 90-Hz Aβ-ES). Color corresponds to the group with four clusters in A. C, Change in percentage of neurons in each cluster between 90- and 50-Hz Aβ-ES. Responses are grouped by pain condition and color corresponds to the clusters in A with two or four clusters. D, Change in percentage of neurons in each cluster after application of bicuculline. Responses are grouped by stimulation frequency, and colors are the same as C.

Similar articles

Cited by

References

    1. Al-Kaisy A, Van Buyten JP, Smet I, Palmisani S, Pang D, Smith T (2014) Sustained effectiveness of 10 khz high-frequency spinal cord stimulation for patients with chronic, low back pain: 24-month results of a prospective multicenter study. Pain Med 15:347–354. 10.1111/pme.12294 - DOI - PMC - PubMed
    1. Barchini J, Tchachaghian S, Shamaa F, Jabbur SJ, Meyerson BA, Song Z, Linderoth B, Saadé NE (2012) Spinal segmental and supraspinal mechanisms underlying the pain-relieving effects of spinal cord stimulation: an experimental study in a rat model of neuropathy. Neuroscience 215:196–208. 10.1016/j.neuroscience.2012.04.057 - DOI - PubMed
    1. Beck S, Hallett M (2011) Surround inhibition in the motor system. Exp Brain Res 210:165–172. - PMC - PubMed
    1. Blakemore C, Carpenter RHS, Georgeson MA (1970) Lateral inhibition between orientation detectors in the human visual system. Nature 228:37–39. - PubMed
    1. Braz JM, Sharif-Naeini R, Vogt D, Kriegstein A, Alvarez-Buylla A, Rubenstein JL, Basbaum AI (2012) Forebrain GABAergic neuron precursors integrate into adult spinal cord and reduce injury-induced neuropathic pain. Neuron 74:663–675. - PMC - PubMed

Publication types

LinkOut - more resources