. 2022 Sep 23;13(1):5561.
doi: 10.1038/s41467-022-33157-4.

Payload distribution and capacity of mRNA lipid nanoparticles

Affiliations

Payload distribution and capacity of mRNA lipid nanoparticles

Sixuan Li et al. Nat Commun. .

Abstract

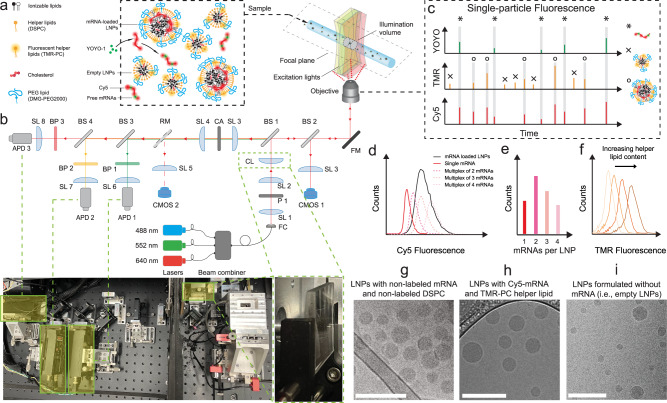
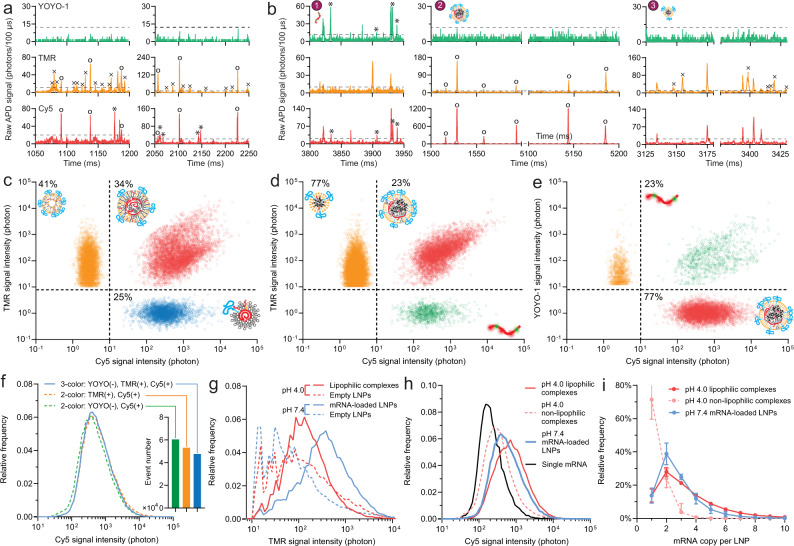
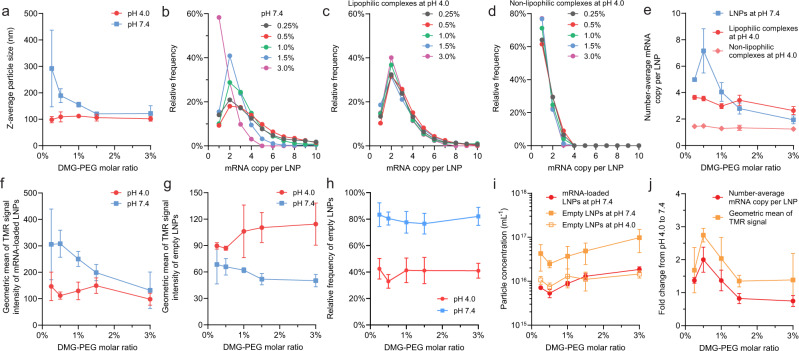
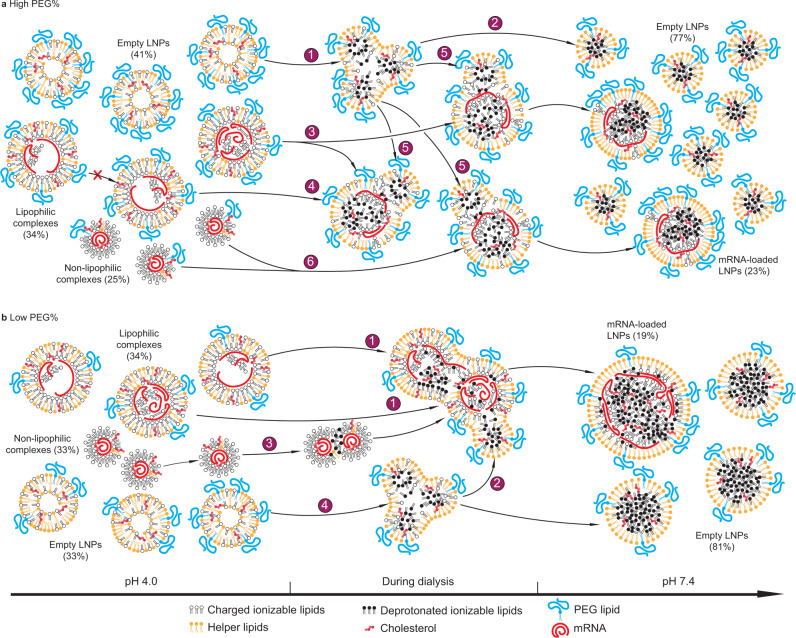
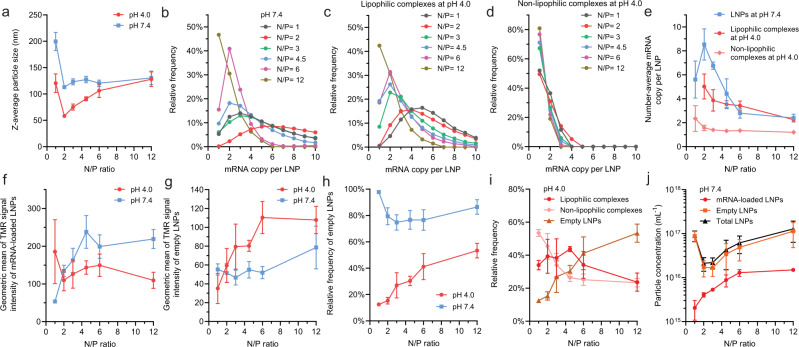
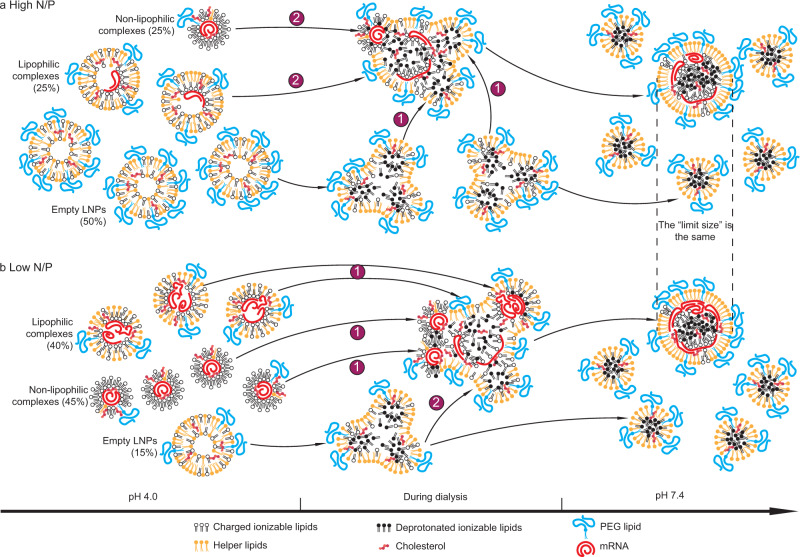
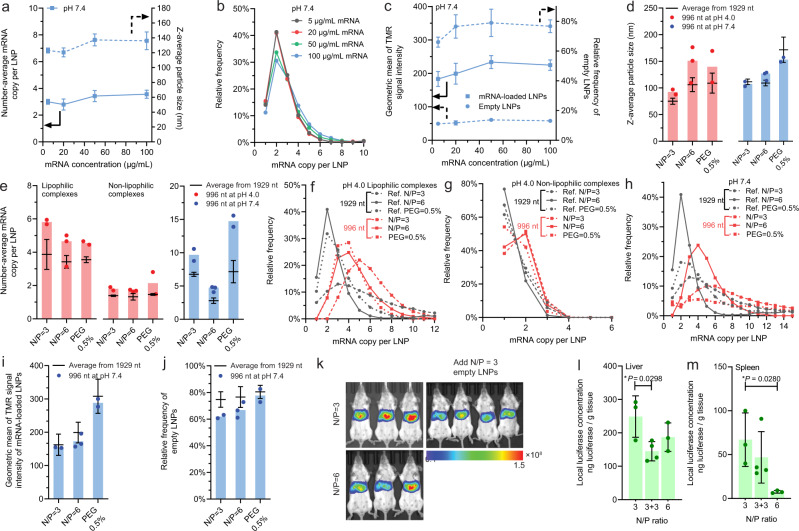
Lipid nanoparticles (LNPs) are effective vehicles to deliver mRNA vaccines and therapeutics. It has been challenging to assess mRNA packaging characteristics in LNPs, including payload distribution and capacity, which are critical to understanding structure-property-function relationships for further carrier development. Here, we report a method based on the multi-laser cylindrical illumination confocal spectroscopy (CICS) technique to examine mRNA and lipid contents in LNP formulations at the single-nanoparticle level. By differentiating unencapsulated mRNAs, empty LNPs and mRNA-loaded LNPs via coincidence analysis of fluorescent tags on different LNP components, and quantitatively resolving single-mRNA fluorescence, we reveal that a commonly referenced benchmark formulation using DLin-MC3 as the ionizable lipid contains mostly 2 mRNAs per loaded LNP with a presence of 40%-80% empty LNPs depending on the assembly conditions. Systematic analysis of different formulations with control variables reveals a kinetically controlled assembly mechanism that governs the payload distribution and capacity in LNPs. These results form the foundation for a holistic understanding of the molecular assembly of mRNA LNPs.


Conflict of interest statement

S.L., Y.H., T.-H.W., and H.-Q.M. are co-inventors of a patent application covering the technique described in this paper, filed through and managed by Johns Hopkins University Office of Technology Ventures. The remaining authors declare no competing interests.

Figures

Fig. 1
Fig. 1. Instrumentation of multi-color CICS platform, methodology for characterization of LNP formulations.
a Species of interest in LNP formulations include the mRNA-loaded LNPs, empty LNPs, and free mRNAs. Three fluorescent tags were used for the single-particle fluorescence detection and species classification: all mRNAs have Cy5 tags; 5% of the helper lipids carry a TMR tag; YOYO-1 was added into the LNP sample prior to CICS assessment to stain-free mRNAs. b Instrumental setup of three-color CICS. The lasers were first combined by a beam combiner to give a single output which allows the fluorescence coincidence detection, then expanded in one dimension by a cylindrical lens (CL) which gave an observation volume that covers the whole cross-section of the capillary. Such design allows CICS to obtain ~100% mass detection efficiency. The rectangular confocal aperture (CA) rejects the out-of-plane signal and confines the signal collection only from the center of the illumination volume, which renders highly uniform fluorescent signals. Each particle that passed through the detection volume generated a unique fluorescence signal that was recorded by single-photon counting avalanche photodiodes (APDs). c The single-particle fluorescence trace was processed with a thresholding algorithm to identify all the burst events. Based on the fluorescent coincidence across the three colors, the fluorescence was classified as: mRNA-loaded LNPs (circles, TMR-Cy5 coincident), empty LNPs (crosses, TMR only), and free mRNAs (asterisks, Cy5-YOYO-1 coincident). d The Cy5 intensity profile of single free mRNA molecules, and theoretical Cy5 intensity profiles of multiplexed mRNAs expected in LNPs, compared with the histogram obtained from an LNP sample containing a distribution of the mRNA payload shown in e. f TMR intensity profiles of LNP formulations correlate with their relative helper lipid content. gi Cryogenic transmission electron microscopy (cryo-TEM) images of mRNA LNPs of the benchmark formulation at pH 7.4, made g with non-labeled mRNA and non-labeled DSPC, h with Cy5-mRNA and 0.5% (mol% to total lipid content) TMR-PC, and i in absence of mRNA to form only empty LNPs. All scale bars = 200 nm. The images shown are representative images from two independent sample preparations and 50 TEM fields examined for each preparation, for which the findings were consistent.
Fig. 2
Fig. 2. mRNA payload behaviors of a benchmark mRNA LNP formulation (DLin-MC3-DMA: DSPC: cholesterol: DMG-PEG = 50:10:38.5:1.5).
a Example of 3-color raw signals at pH 4.0. Circles label events of lipophilic complexes; Asterisks label events of non-lipophilic complexes; crosses label events of empty LNPs. b Example of three-color raw signals upon dialysis to pH 7.4. Asterisks label events of free mRNAs in panel 1; Circles label events of mRNA-loaded LNPs in panel 2; Crosses label events of empty LNPs in panel 3. a, b The dashed lines show the threshold set for detection. c Classification of LNP species into empty LNPs (upper-left quadrant), lipophilic complexes (upper-right quadrant) and non-lipophilic complexes (lower-right quadrant) by plotting TMR signal intensity against Cy5 signal intensity at pH 4.0. 10% of 141,530 signals are shown in the figure. d Classification of LNP species into empty LNPs (upper-left quadrant), mRNA-loaded LNPs (upper-right quadrant), and free mRNAs (lower-right quadrant) detected at pH 7.4. For clarity, 10% of 195,090 signals are shown in the figure. The percentages labeled are relative to all TMR events. Free mRNA events accounted for only 4% of all events. e Identification of mRNAs that were encapsulated in LNPs thus inaccessible to YOYO-1 and unencapsulated ones at pH 7.4 by plotting YOYO-1 signal intensity to Cy5 signal intensity. For clarity, 10% of 71,320 signals are shown in this figure. The upper-left quadrant population was presumably empty LNPs non-specifically tagged by YOYO-1. The percentages labeled are relative to all Cy5 events. f Application of three-color authentication for population classification reduced the frequency of false mRNA-loaded LNP signals from two-color authentications. g TMR signal intensity profiles of LNP species at pH 4.0 or 7.4. h Cy5 signal intensity profiles of single-mRNA molecules and LNP species at pH 4.0 or 7.4. i Calculated mRNA payload distributions of this benchmark mRNA LNP formulation using deconvolution algorithm (n = 6 independent formulation experiments). Data are presented as mean values ± SD.
Fig. 3
Fig. 3. Effects of molar ratio of DMG-PEG on the payload capacity and lipid content of mRNA LNPs (DLin-MC3-DMA: DSPC: cholesterol: DMG-PEG = 50:10:40-x:x).
a The z-average particle diameter of mRNA LNPs assessed by dynamic light scattering (DLS). bd The mRNA payload distribution profiles of formulations at b pH 7.4; c pH 4.0 for lipophilic complexes; or d pH 4.0 for non-lipophilic complexes. e The number-average mRNA copy per LNP. f, g The geometric mean of TMR signals (indicator of relative helper lipid content) of f lipophilic complexes at pH 4.0 and mRNA-loaded LNPs at pH 7.4; or g empty LNPs at either pH 4.0 or 7.4. h The fraction of empty LNPs. i The absolute number concentrations of mRNA-loaded or empty LNPs at pH 7.4. j The average fold change of mRNA payload and helper lipid content from lipophilic complexes at pH 4.0 to mRNA-loaded LNPs at pH 7.4. The consistently higher fold change of helper lipid content indicated that merge of empty LNPs to lipophilic complexes occurred. a, e, fj, data are represented as mean value ± SD, derived from n = 3 independent experiments (formulating LNPs from raw materials and then applying CICS analysis), except for 1.5% DMG-PEG where n = 6.
Fig. 4
Fig. 4. Mechanisms of determination of payload capacity and distribution of mRNA LNPs by the PEG content.
a, b The hypothesized assembly processes and characteristics of LNP formulation with a high concentration of PEG mol% (a); or a low concentration of PEG mol% (b) and composition drift during dialysis from pH 4.0 (left) to pH 7.4 (right). The populational fractions labeled are real data from the formulation with PEG mol% = 1.5% (a) or 0.5% (b). a Each number label represents a populational behavior during dialysis: 1, splitting of empty LNPs; 2, stabilization of empty LNPs; 3, splitting of lipophilic complexes with an initially high mRNA payload; 4, remaining a same mRNA payload for lipophilic complexes with an initially low or intermediate payload; 5, merge of empty LNPs with mRNA complexes; 6, merge of non-lipophilic complexes. The cross mark represents the finding that the mRNA payload of lipophilic complexes does not increase during dialysis due to lack of merging under this condition. b The labels are: 1, merge between lipophilic complexes; 2, merge of empty LNPs with mRNA complexes; 3, merge of non-lipophilic complexes; 4, splitting of empty LNPs.
Fig. 5
Fig. 5. Effects of N/P ratio on the payload capacity and lipid content of mRNA LNPs.
a The z-average particle size of mRNA LNPs assessed by dynamic light scattering (DLS). bd The mRNA payload distribution profiles of formulations at pH 7.4 b; pH 4.0 for lipophilic complexes c; or pH 4.0 for non-lipophilic complexes d. e The number-average mRNA copy per LNP at either pH 4.0 or pH 7.4. f, g Geometric mean of TMR signals (indicator of relative helper lipid content) of lipophilic complexes at pH 4.0 and mRNA-loaded LNPs at pH 7.4 f, or empty LNPs at either pH 4.0 or 7.4 g. h The fraction of empty LNPs assessed at either pH 4.0 or 7.4. i The frequency of different LNP species at pH 4.0. j The absolute number concentration of LNPs at pH 7.4. a, e, fj data are represented as mean value ± SD, derived from n = 3 independent experiments (formulating LNPs from raw materials and then applying CICS analysis), except for N/P ratio = 6 where n = 6.
Fig. 6
Fig. 6. Mechanisms of determination of payload capacity and distribution of mRNA LNPs by N/P ratio.
a, b The hypothesized assembly processes and characteristics of LNP formulation with a high N/P ratio a; or a low N/P ratio b and composition drift during dialysis from pH 4.0 (left) to pH 7.4 (right). At pH 4.0, the populational fractions labeled are real data for an N/P ratio of 12 (a) or 2 (b). Labels in both a and b: 1, a kinetically favorable (major) process; 2, a kinetically unfavorable (minor) process. At pH 7.4, the mRNA-loaded LNPs presumably hold the same size because the relative ratio of PEG lipid to all lipids is the same.
Fig. 7
Fig. 7. Effects of lipid and mRNA concentrations and mRNA size on payload capacity and distribution, and effect of empty LNPs on mRNA delivery efficiency.
ac The effect of mRNA (and lipids) concentration on (a) the z-average particle size and number-average mRNA payload (n = 3, except for 20 μg/mL where n = 6); b the payload distribution; and c the relative helper lipid content in mRNA-loaded or empty LNPs, as well as the fraction of empty LNPs at pH 7.4 (n = 3, except for 20 μg/mL where n = 6). dj Effect of mRNA size (996 nt vs. 1929 nt) on d the z-average particle size, e the number-average mRNA payload, f the payload distribution at pH 4.0 for lipophilic complexes; g the payload distribution at pH 4.0 for non-lipophilic complexes; h the payload distribution at pH 7.4; i the relative helper lipid content of mRNA-loaded LNPs at pH 7.4; and j the fraction of empty LNPs at pH 7.4. km Effect of empty LNP content on mRNA delivery efficiency. The IVIS images of mice and harvested livers and spleens at 12 h post-i.v. injection of LNP formulations at an mRNA dose of 0.5 mg mRNA/kg. The harvested organs were subsequently homogenized with the local luciferase concentration measured by ex vivo bioluminescence assay, and the results are shown in i for the liver and m for the spleen. km, N/P = 3 (n = 3) or 6 (n = 3) means the LNPs were directly formulated with an N/P ratio of 3 or 6, while N/P = 3 + 3 (n = 4) means the LNPs were first formulated with an N/P ratio of 3, and then empty LNPs containing a lipid mass that equals to the mass correlating with an N/P ratio of 3 were added and mixed with the base. This N/P = 3 + 3 group contained ~2-fold of empty LNPs than the N/P = 3 group, while keeping the population of mRNA-loaded LNPs consistent. k The scale represents bioluminescence radiance with the unit of p/sec/cm2/sr. For statistically analysis in l and m, an unpaired, two-sided t test was performed between the groups of N/P = 3 and N/P = 3 + 3, or between the groups of N/P = 3 and N/P = 6. df, j n = 3 independent formulation experiments for 1929 nt, except for N/P = 6 where n = 6. Data are presented as mean value ± SD throughout this figure.

References

    1. Gillmore JD, et al. CRISPR-Cas9 in vivo gene editing for transthyretin amyloidosis. N. Engl. J. Med. 2021;385:493–502. doi: 10.1056/NEJMoa2107454. - DOI - PubMed
    1. Leung AKK, et al. Lipid nanoparticles containing siRNA synthesized by microfluidic mixing exhibit an electron-dense nanostructured core. J. Phys. Chem. C. 2012;116:18440–18450. doi: 10.1021/jp303267y. - DOI - PMC - PubMed
    1. Leung AKK, Tam YYC, Chen S, Hafez IM, Cullis PR. Microfluidic mixing: a general method for encapsulating macromolecules in lipid nanoparticle systems. J. Phys. Chem. B. 2015;119:8698–8706. doi: 10.1021/acs.jpcb.5b02891. - DOI - PubMed
    1. Kulkarni JA, et al. On the formation and morphology of lipid nanoparticles containing ionizable cationic lipids and siRNA. ACS Nano. 2018;12:4787–4795. doi: 10.1021/acsnano.8b01516. - DOI - PubMed
    1. Brader ML, et al. Encapsulation state of messenger RNA inside lipid nanoparticles. Biophys. J. 2021;120:2766–2770. doi: 10.1016/j.bpj.2021.03.012. - DOI - PMC - PubMed

Publication types