. 2022 Sep 23;12(1):15911.
doi: 10.1038/s41598-022-19842-w.

Effects of pyrroloquinoline quinone on noise-induced and age-related hearing loss in mice

Affiliations

Effects of pyrroloquinoline quinone on noise-induced and age-related hearing loss in mice

Ying Gao et al. Sci Rep. .

Abstract

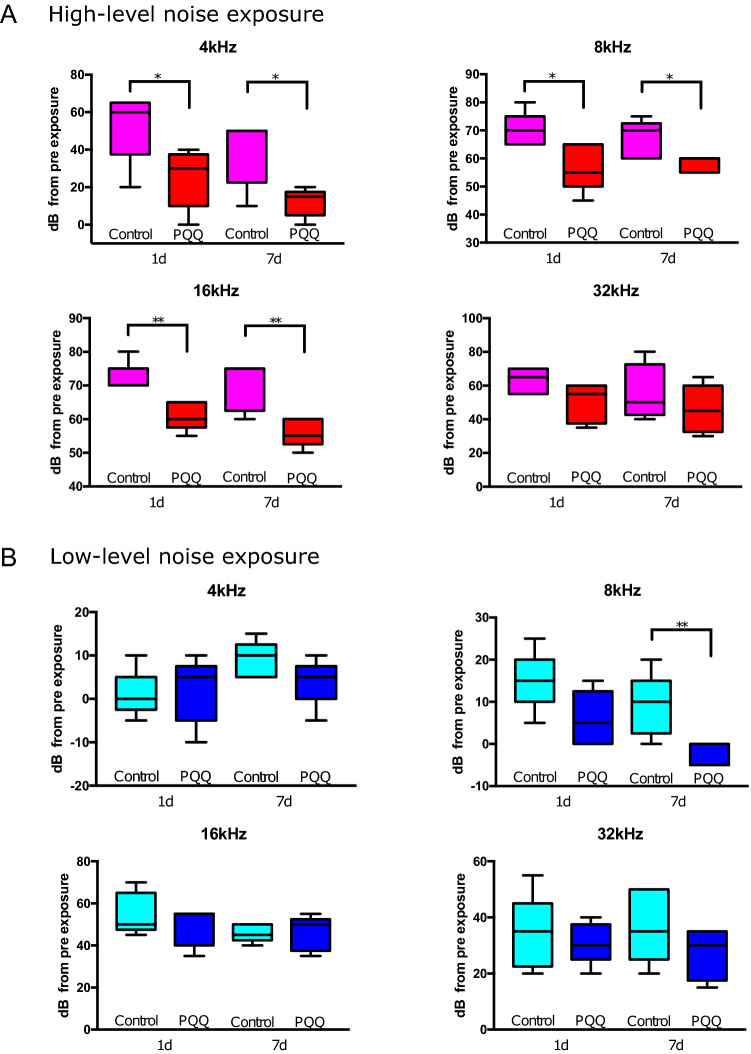
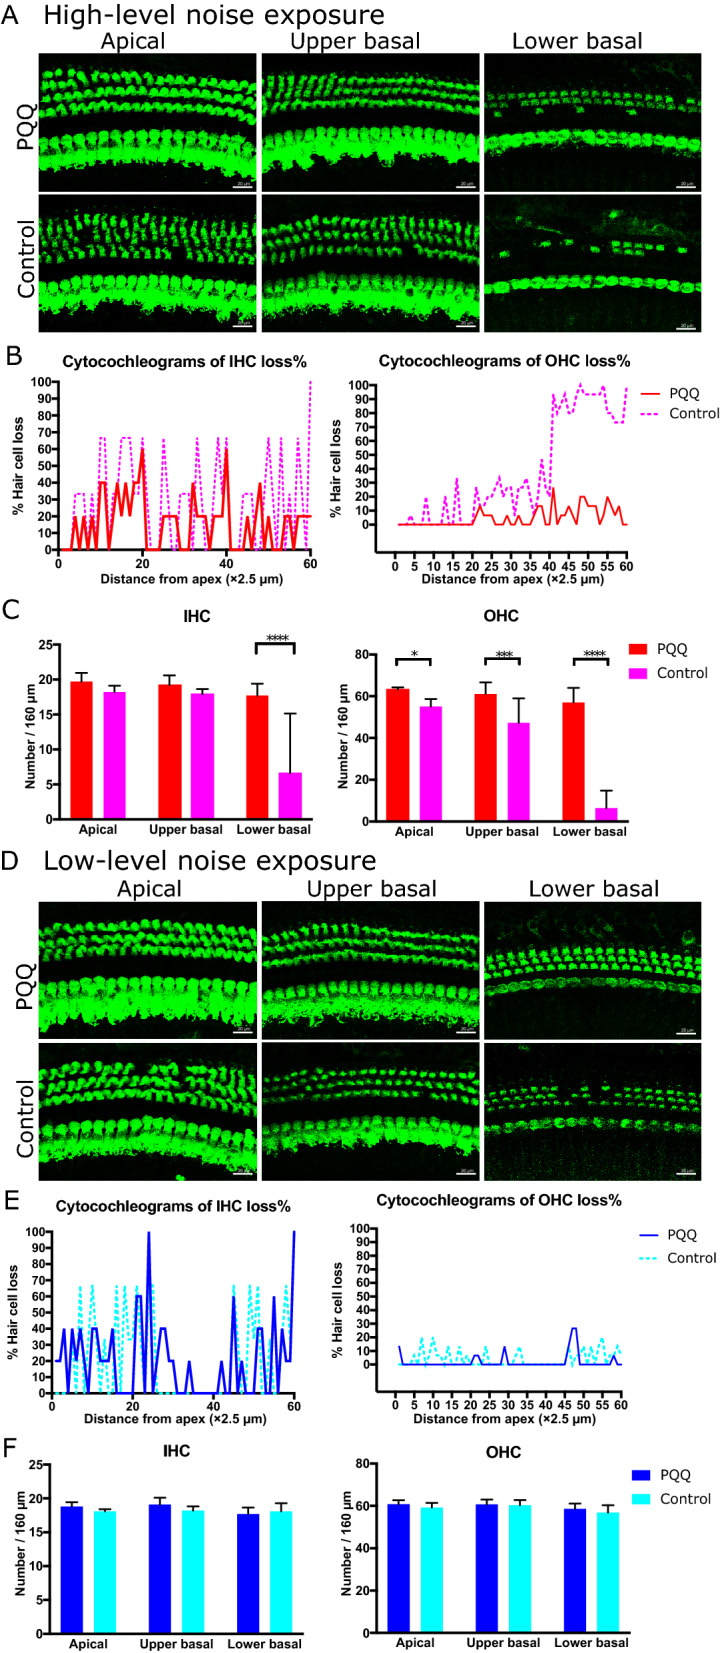
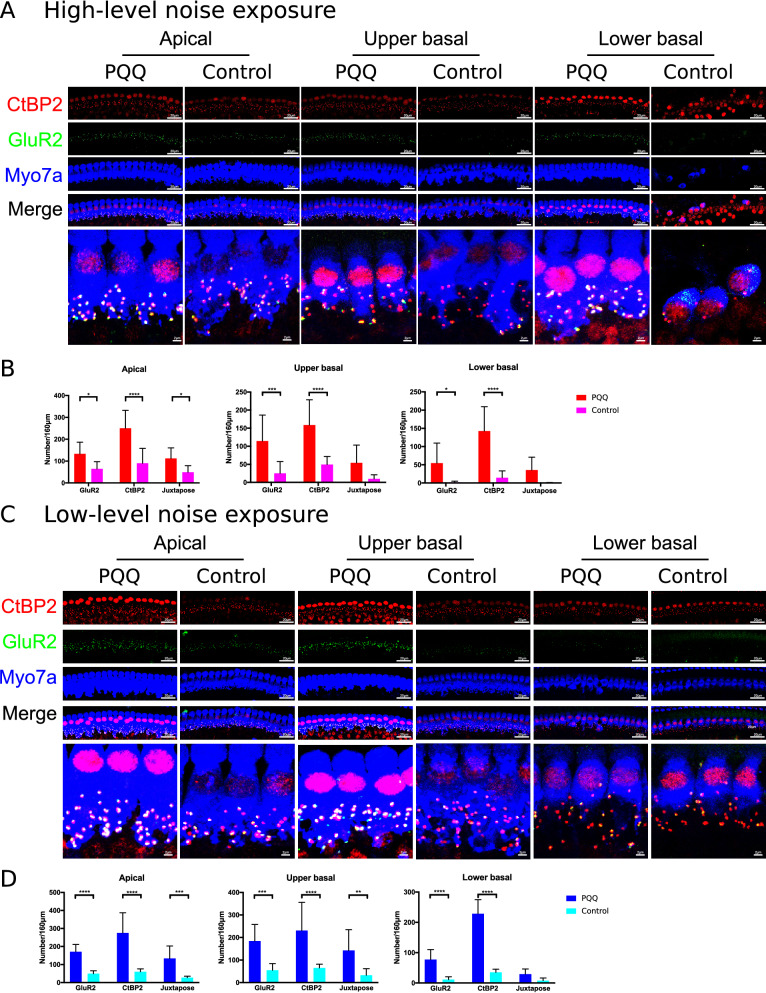
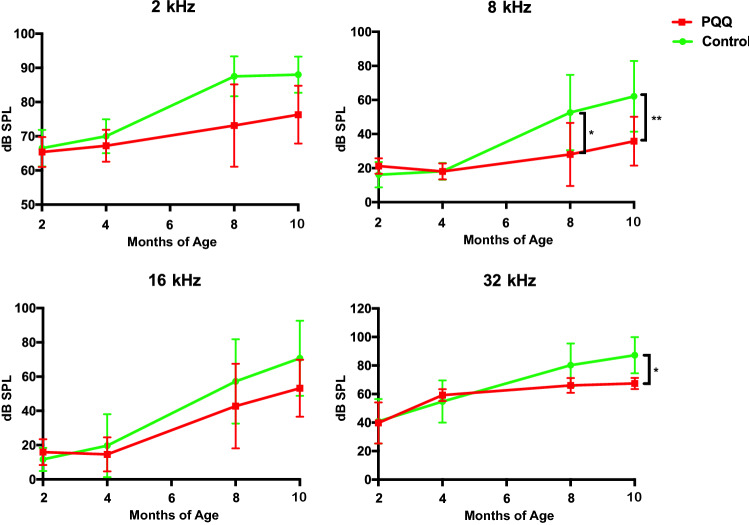
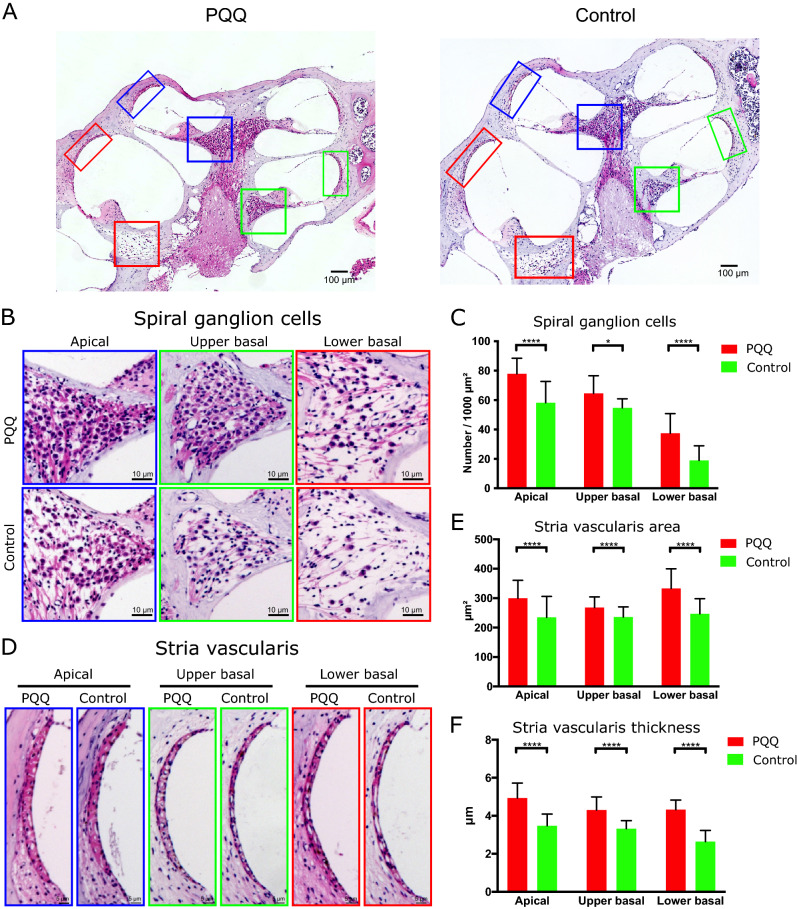
We investigated whether the oxidoreductase cofactor pyrroloquinoline quinone (PQQ) prevents noise-induced and age-related hearing loss (NIHL and ARHL) in mice. To assess NIHL, 8 week-old mice with and without PQQ administration were exposed to noise for 4 h. PQQ was orally administered for one week before and after noise exposure and subcutaneously once before noise exposure. For ARHL evaluation, mice were given drinking water with or without PQQ starting at 2 months of age. In the NIHL model, PQQ-treated mice had auditory brainstem response (ABR) thresholds of significantly reduced elevation at 8 kHz, a significantly increased number of hair cells at the basal turn, and significantly better maintained synapses beneath the inner hair cells compared to controls. In the ARHL model, PQQ significantly attenuated the age-related increase in ABR thresholds at 8 and 32 kHz at 10 months of age compared to controls. In addition, the hair cells, spiral ganglion cells, ribbon synapses, stria vascularis and nerve fibers were all significantly better maintained in PQQ-treated animals compared to controls at 10 months of age. These physiological and histological results demonstrate that PQQ protects the auditory system from NIHL and ARHL in mice.


Conflict of interest statement

This work was financially supported by ROHTO Pharmaceutical Co., Ltd. (Osaka, Japan).

Figures

Figure 1
Figure 1
ABR results in the noise-induced hearing loss model (A) ABR threshold shifts from pre-exposure thresholds 1 day and 7 days after high-level noise exposure for each frequency (4 kHz, 8 kHz, 16 kHz and 32 kHz). There were significant differences between PQQ-treated animals and the controls at 4 kHz, 8 kHz and 16 kHz. (B) ABR thresholds 1 day and 7 days after low-level noise exposure. A significant difference was observed at 8 kHz between low-level noise + PQQ group and low-level noise group. * p < 0.05, ** p < 0.01. (n = 5 per group).
Figure 2
Figure 2
The histological evaluation of hair cells in the noise-induced hearing loss model (A) Morphological changes of hair cells after exposure to high-level noise in the apical, upper basal and lower basal turns of the cochlea in the PQQ group and control group. The hair cells are stained with Myo7A (green). Bar, 20 µm. (B) The cytocochleograms of IHCs (left) and OHCs (right) for each group. The graphs show the survival rates of IHCs (left) and OHCs (right) as a function of their distance from the apex of the cochlea. (C) The numbers of IHCs and OHCs of the sensory epithelium per 160 µm for PQQ and control groups. (D), (E), (F) A, B and C above (respectively) but for low-level noise exposure. * p < 0.05, *** p < 0.001, **** p < 0.0001. (n = 5 per group).
Figure 3
Figure 3
The evaluation of ribbon synapses in the noise-induced hearing loss model (A) Confocal images of the ribbon synapses of IHCs of the cochlea in NIHL after exposure to high-level noise. The pre-synaptic marker (CtBP2, red), the post-synaptic marker (GluR2, green) and the hair cell marker (Myo7A, blue) are immunolabeled. Bar, 20 µm, 2 µm in the magnified box. (B) The number of ribbon synapses of the IHCs per 160 µm of sensory epithelium. Juxtapose is the number of juxtaposed pre-synaptic marker (CtBP2) and post-synaptic marker (GluR2). (C,D) The confocal images of ribbon synapses and the numbers of the ribbon synapses respectively after exposure to low-level noise. * p < 0.05, ** p < 0.01, *** p < 0.001, **** p < 0.0001. (n = 5 per group).
Figure 4
Figure 4
The evaluation of the spiral bundle of the spiral organ of Corti in the noise-induced hearing loss model (A) Confocal images of the spiral bundle of the spiral organ at the apical, upper basal and lower basal turns after high-level noise exposure. The hair cells were stained with anti-Myo7A (green), the peripheral axons of the spiral ganglion neurons with anti-NF200 (red), and the nuclei with DAPI (blue). Bar, 20 µm. (B) Quantitative analysis result of SGC peripheral axons with branches, junctions and lengths after high level noise exposure. The description of each parameter is in the methods section. (C, D) The spiral bundle of the spiral organ and the quantitative analysis of the bundles respectively after low-level noise exposure. ** p < 0.01, *** p < 0.001, **** p < 0.0001. (n = 5 per group).
Figure 5
Figure 5
ABR thresholds in the age-related hearing loss model ABR thresholds of each frequency (4 kHz, 8 kHz, 16 kHz and 32 kHz) at each month of age. There were significant differences between the PQQ and control groups at 8 kHz and 32 kHz at 10 months of age. * p < 0.05, ** p < 0.01. (Control group (n = 10) and PQQ group (n = 11)).
Figure 6
Figure 6
Evaluation of the hair cells and ribbon synapses in the age-related hearing loss model (A) Confocal images of the ribbon synapses of the IHCs of the cochlea in ARHL. The pre-synaptic marker (CtBP2, red), the post-synaptic marker (GluR2, green) and the hair cell marker (Myo7A, blue) are immunolabeled. (B) The number of IHCs and OHCs of the sensory epithelium per 160 µm. (C) The number of the ribbon synapses of the IHCs per 160 µm of sensory epithelium. Juxtapose is the number of juxtaposed pre-synaptic marker (CtBP2) and post-synaptic marker (GluR2). ** p < 0.01, *** p < 0.001, **** p < 0.0001. (Control group (n = 10) and PQQ group (n = 11)).
Figure 7
Figure 7
Histological evaluation of the spiral ganglion and the stria vascularis in the age-related hearing loss model (A) The histological H-E images of the cochlea in each group showing the spiral ganglion cells (SGCs) (square) and the stria vascularis (SV) (rectangle) at apical (blue), upper basal (green) and lower basal (red) turns. Bar, 100 µm. (B) SGCs. Bar, 10 µm. (C) The densities of SGCs per 1000 µm2. (D) The SV. Bar, 5 µm. (E, F) The area (E) and the thickness (F) of the SV. * p < 0.05, **** p < 0.0001. (Control group (n = 10) and PQQ group (n = 11)).

Similar articles

Cited by

References

    1. Agrup C, Gleeson M, Rudge P. The inner ear and the neurologist1. J Neurol. Neurosurg. Psychiatry. 2007;78(2):114–122. doi: 10.1136/jnnp.2006.092064. - DOI - PMC - PubMed
    1. Davis AC. Epidemiological profile of hearing impairments: The scale and nature of the problem with special reference to the elderly. Acta Otolaryngol. 1991;111(S476):23–31. doi: 10.3109/00016489109127252. - DOI - PubMed
    1. Ries PW. Prevalence and characteristics of persons with hearing trouble: United States 1990-91. Vital Health Stat. 10. 1994;188(188):1–75. - PubMed
    1. Kwan T, White PM, Segil N. Development and regeneration of the inner ear: Cell cycle control and differentiation of sensory progenitors. Ann. New York Acad. Sci. 2009;1170:28–33. doi: 10.1111/j.1749-6632.2009.04484.x. - DOI - PMC - PubMed
    1. Ding T, Yan A, Liu K. What is noise-induced hearing loss? Br. J. Hosp. Med. 2019;80(9):525–529. doi: 10.12968/hmed.2019.80.9.525. - DOI - PubMed

Publication types