. 2022 Sep 23;12(1):15864.
doi: 10.1038/s41598-022-19427-7.

Mud and burnt Roman bricks from Romula

Affiliations

Mud and burnt Roman bricks from Romula

P Badica et al. Sci Rep. .

Abstract

Sesquipedalian mud and burnt bricks (second to third century AD) were excavated from the Roman city of Romula located in the Lower Danube Region (Olt county, Romania). Along with local soils, bricks are investigated by petrographic analysis, X-ray fluorescence (XRF), X-ray diffraction (XRD), Fourier transformed infrared spectroscopy (FT-IR), electron microscopy (SEM/EDX), X-ray microtomography (XRT), thermal analysis (DTA-TG), Mӧssbauer spectroscopy, magnetometry, colorimetry, and mechanical properties assessment. The results correlate well with each other, being useful for conservation/restoration purposes and as reference data for other ceramic materials. Remarkably, our analysis and comparison with literature data indicate possible control and wise optimization by the ancient brickmakers through the recipe, design (size, shape, and micro/macrostructure), and technology of the desired physical-chemical-mechanical properties. We discuss the Roman bricks as materials that can adapt to external factors, similar, to some extent, to modern "smart" or "intelligent" materials. These features can explain their outstanding durability to changes of weather/climate and mechanical load.


Conflict of interest statement

The authors declare no competing interests.

Figures

Figure 1
Figure 1
(a,b) Maps showing the location of the Romula city, and the type of soils. (c) The provenance of the ancient mudbrick from the enclosure wall of the first (central) Roman fortifications built in the first quarter of the second century AD. (d) The burnt brick from a wall built in the last decade of the second century to first third of the third century AD. For sample notation see Table 1. Map (a) was created using Google Earth (https://www.google.com/maps/@45.5432477,22.1410097,742653m/data=!3m1!1e3) on which Roman provinces were indicated. Map (b) was generated with ArcGIS v.10.5.
Figure 2
Figure 2
(a) The as-excavated burnt brick (denoted B) from Romula. (b) Detailed optical image showing the brick B petrographic texture (cross section): note the large white inclusion of CaCO3 (see text, “Discussion”). (c) Particle-size analysis bar plot of the small depth clay soils from Table 1. For the clay soil horizon see Fig. 1b. Fractions (from right to left) are: < 0.002 mm for clay; 0.002–0.02 mm for silt; 0.02–0.05 mm, 0.05–0.1 mm, and 0.1–0.2 for fine sand; 0.2–0.5 mm, 0.5–1 mm, and 1–2 mm for coarse sand. For sample notations see Table 1.
Figure 3
Figure 3
X-ray powder diffraction patterns of burnt (B) and mud (S1–2) bricks, sand (S) and raw soils (DS1, DS2, PCT9R) from Romula. The mineral phases identified are : quartz (Q, CIF: 00-033-1161), chlorite (Ch, CIF: 01-087-2496), mica (M, CIF: 01-074-1107), K-feldspar (F, 00-010-0353), plagioclase (P, CIF: 01-079-1148), Tschermakite (T, CIF: 04-012-1305), calcite magnesian (Ca–Mg carbonate, CIF: 00-043-0697) and calcite (Ca carbonate, CIF: 04-008-0198). Note: (asterisk)—powder samples ignited at 880 °C in air with a heating rate of 200 °C/h, and a dwell time of 1 h. For details of identified minerals see Supplementary material Table 4.
Figure 4
Figure 4
FT-IR spectra of investigated samples (see Table 1 for sample notation). Note: (asterisk) powder samples ignited at 880 °C with a heating rate 200 °C/h, and for a 1 h dwell time. The notation for the mineral phases identified is the same as in Fig. 3. For details of identified minerals see Supplementary material Table 4.
Figure 5
Figure 5
Thermal analysis and mass spectroscopy curves: (a,c) DTA and TG curves for samples B and S1–2*; (b,d) DTA and TG curves for PCT9R, DS1, DS2 and S1–2; (e,f) mass spectroscopy curves with temperature (fragments and/or molecules with mass 17, 18 and 44 were ascribed to OH, H2O and CO2) for samples DS1 and DS2, respectively. Decomposition stages in DTA/TG for each sample are given in Supplementary material, Table 5).
Figure 6
Figure 6
X-ray tomography on a sample from the burnt brick (B): (a) 3D rendering showing the pores; (b,e) 2D sections; (c) 3D rendering of the largest pore identified in the sample; (d) white particles mainly ascribed to quartz phase (see text); (fh) diameter, volume and compactness distributions of the pores in the investigated sample; (ik) diameter, volume and compactness distributions of the white particles in the investigated sample. Yellow arrows indicate the pores and red ones the white particles.
Figure 7
Figure 7
Compressive strength curves taken on the burnt brick from Romula: (A) compressive curve of the samples at a scale size 1:20 of the original burnt brick; (B) compressive curve on cubic samples (standard conditions EN1926:2006). Notations are: σ1—compressive strength at the first crack (curve B); σmax—maximum compressive strength (curve B); σ11:20—compressive strength at the first crack (curve A); σ21:20—intermediate compressive strength (curve A); region 1—0–σ11:20 first crack formation (curve A); region 2—σ11:20–σ21:20 cracks development and compaction of the sample (curve A); region 3—> σ21:20 compact material almost without pores.
Figure 8
Figure 8
(a) Von Mises distribution in the first brick (from the bottom of the stack), loaded with 455 kN (about 3500 bricks). (b) Safety factor distribution in the first brick.
Figure 9
Figure 9
Thermal properties (specific heat cp, thermal diffusivity α, and thermal conductivity k) measured in air up to 500 °C on a sample cut from the burnt brick (B) from Romula.
Figure 10
Figure 10
Mӧssbauer spectra at 5, 80 and 300 K measured on samples: (a) PCRT9R; (b) S1–2; (c) S1–2*; (d) B (for sample notation see Table 1). With points are experimental data.
Figure 11
Figure 11
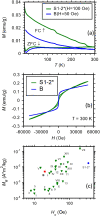
(a) Magnetization curves with temperature at a magnetic field of 100 Oe for S1–2* and 50 Oe for sample B; (b) the magnetic hysteresis curves at 300 K; (c) distribution of remnant magnetization (MR) against the coercive field (HC) of the burnt brick samples S1–2* and B from Romula in comparison with data for soils (Arabic numeral) and burnt bricks (Roman numeral) from ref..
Figure 12
Figure 12
Electron microscopy images of the burnt brick B in secondary electron (a) and backscattered mode (b) and EDS maps of selected elements.
Figure 13
Figure 13
SEM image (a) and elemental maps for: (c) Ca; (d) O; (e) C. In (b) is presented RGB image obtained by overlapping the maps for individual elements; (f) EDX spectrum taken on the Ca-rich grain; (g) SEM image at high magnification showing nanostructuring of the Ca-rich grain; (h) EDX spectra taken inside and outside a pore shown in (i).
Figure 14
Figure 14
Vickers hardness measured on burnt brick B and ceramic samples manufactured in the lab from the as-excavated soil PCT9R with low content of calcium and from the mud brick (S1–2) rich in calcium.

References

    1. Davey, N. A History of Building Materials. Chap. 3. 19–25 (Phoenix House, 1961).
    1. Wright G. Ancient building technology. Technol. Change Hist. 2005;1:111–139.
    1. Tudor D. Oltenia romană. Editura Acad. Repub. Soc. 1978;4:189.
    1. Tătulea, M. Romula-Malva. in Editura Museion. 52–53 (1994).
    1. Popilian G. Ceramica romană din Oltenia. Scrisul Romanesc. 1976;8-10:139–156.

Publication types