. 2022 Sep 23;12(1):15857.
doi: 10.1038/s41598-022-20330-4.

Fertility costs of cryptic viral infections in a model social insect

Affiliations

Fertility costs of cryptic viral infections in a model social insect

Abigail Chapman et al. Sci Rep. .

Abstract

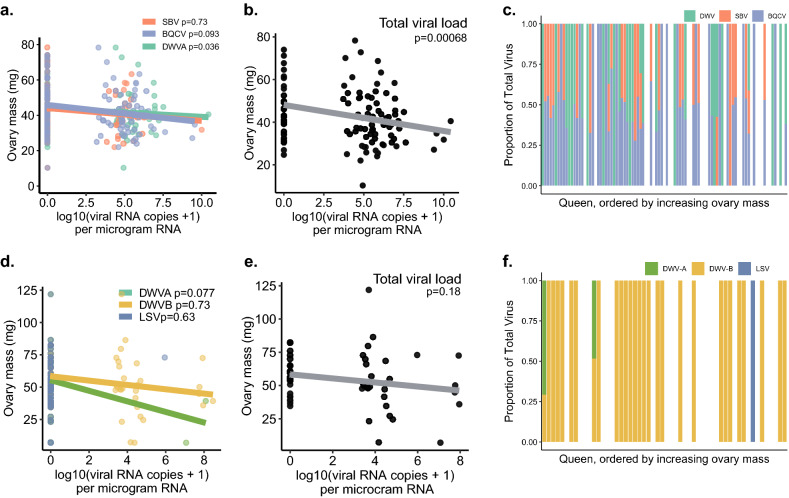
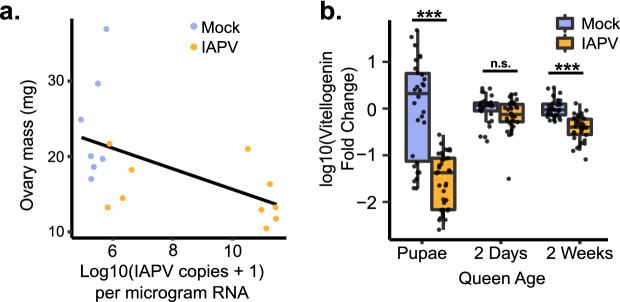
Declining insect populations emphasize the importance of understanding the drivers underlying reductions in insect fitness. Here, we investigated viruses as a threat to social insect reproduction, using honey bees as a model species. We report that in two independent surveys (N = 93 and N = 54, respectively) of honey bee (Apis mellifera) queens taken from a total of ten beekeeping operations across British Columbia, high levels of natural viral infection are associated with decreased ovary mass. Failed (poor quality) queens displayed higher levels of viral infection, reduced sperm viability, smaller ovaries, and altered ovary protein composition compared to healthy queens. We experimentally infected queens with Israeli acute paralysis virus (IAPV) and found that the ovary masses of IAPV-injected queens were significantly smaller than control queens, demonstrating a causal relationship between viral infection and ovary size. Queens injected with IAPV also had significantly lower expression of vitellogenin, the main source of nutrition deposited into developing oocytes, and higher levels of heat-shock proteins, which are part of the honey bee's antiviral response. This work together shows that viral infections occurring naturally in the field are compromising queen reproductive success.


Conflict of interest statement

The authors declare no competing interests.

Figures

Figure 1
Figure 1
Fertility metrics of failed and healthy queens. In all cases, years indicate the year the queen was reared. (a) Ovary masses of failed and healthy queens collected across three different surveys conducted in British Columbia and Pennsylvania (analyzed using a linear mixed model with status as a fixed effect and source location as a random effect). Because the average ovary size differed between surveys, data were mean-centered by survey prior to analysis to better highlight the effect of status. Boxes represent the interquartile range, bars indicate the median, and whiskers span 1.5 times the interquartile range. (b) Queens rated as ‘failed’ (spotty brood pattern, drone layer, or dwindling adult population) or (c) ‘healthy’ (contiguous worker brood patterns, medium-strong adult population) by local beekeepers in British Columbia were collected in the summer of 2020. Sperm viability and sperm counts were determined by fluorescent imaging, and wet ovary weight was measured on an analytical balance. (d) Statistical analyses on data presented in (b) and (c) were conducted using either a linear mixed model (ovary mass and sperm counts) or a generalized linear mixed model fitted by maximum likelihood (sperm viability; see Table 2 for details). In the statistical models, queen age (0, 1, or 2 years, which corresponds to queens reared in 2020, 2019, and 2018, respectively) and health status (healthy or failed) were included as fixed effects and source location was included as a random effect. Asterisks indicate statistical significance (p < 0.05), with exact p values given in panels (eg). (eg) Same data as in (d) but separated by the year in which the queen was reared (i.e., a 2018 queen was 2 years old).
Figure 2
Figure 2
Relationships between viral RNA copies and ovary mass. See Table 2 for complete statistical details. (a) Survey 1 (previously published; see Table 1 for details) included viral RNA copies for deformed-wing virus A (DWV-A), sacbrood virus (SBV), and black queen cell virus (BQCV), using head tissue samples. (b) Viral RNA copies for each virus were added to produce the variable “Total viral load” and analyzed as a fixed effect instead of individual virus copies. (c) Proportion of each virus in each queen, ordered by increasing ovary mass. (d-f) The same relationships from a validation data set (Survey 3) of n = 54 queens analyzed for 8 different viruses in the thorax using a different laboratory service. Queens were mainly infected with DWV-B (non-detected viruses not shown), with sporadic DWV-A and Lake Sinai virus (LSV). For (a) and (d) data were analyzed using a linear mixed effect model with queen source as a random effect, and the copies of each virus and health status (healthy vs. failing) as fixed effects. Regression lines shown only for viruses with > 1 non-zero point. (e) The summed total viral load was analyzed as a fixed effect instead of the individual virus copies.
Figure 3
Figure 3
Ovary mass and vitellogenin transcription are significantly decreased after IAPV injection. (a) Mated, age-matched queens were injected with IAPV or a mock (buffer only; n = 10 each). After 65 h the ovary mass of infected queens was significantly reduced. Data was modeled using a simple linear model, p = 0.024. (b) The transcript for vitellogenin is downregulated in the abdomens of queens experimentally infected with IAPV at two days before emergence and two weeks post-emergence (after CO2 ovary activation). The fold-change in gene expression was calculated using the 2−∆∆Ct method. Pairwise comparisons of gene expression were evaluated using the Wilcoxon Rank Sum test (n.s. = not significant, ***p < 0.0001).
Figure 4
Figure 4
Changes in ovary protein expression and vitellogenin. Protein abundance was measured via LC–MS/MS using label-free quantitation (LFQ). Analysis was done on proteins identified in at least 10 samples and expression is reported as log2-transformed LFQ intensity. We used limma with status (failed vs. healthy), ovary mass, and total viral counts as fixed effects for n = 88 queens (41 healthy and 47 failed) to identify the differentially expressed proteins shown in (a), (b), and (c). Exact sample sizes may differ due to missing values for some proteins. The false-discovery rate (FDR) was controlled using the Benjamini–Hochberg method (5% FDR). (a) Protein expression patterns in ovaries of healthy and failed queens. Only proteins differentially expressed and quantified in 75% of samples are shown (387 proteins). (b) Proteins associated with the antiviral response are upregulated in failed queens (sHSP (XP_001119884.1): t = 3.8, adjusted p = 0.003; sHSP (XP_001120194.1): t = 3.3, adjusted p = 0.01; DnaJ: t = 4.9, adjusted p = 0.0003). (c) Apolipophorins I/II are involved in lipid transport and are downregulated in failed queens (t =  − 2.59, adjusted p = 0.048). Apolipophorin III is an important protein for immune function and lipid transport and is upregulated in failed queens (t = 5.25, adjusted p < 0.0001).
Figure 5
Figure 5
Heat-shock proteins associated with natural and experimental viral infections. (a, b) We analyzed previously published proteomics data using limma, including health status, sperm counts, and log transformed total viral loads as fixed effects (n = 88 queens had complete proteomics with no missing values in continuous covariates). Individual virus types are shown, but only total titers were statistically analyzed. p values were corrected for multiple hypothesis testing by Benjamini–Hochberg correction (see Table 3 for statistical summaries of these and other significant proteins). (c, d) The transcripts of two heat-shock proteins found in the spermathecal fluid of naturally infected queens and previously identified in the antiviral response in workers are upregulated in the abdomens of queens experimentally infected with IAPV. The fold-change of gene expression was calculated using the 2−∆∆Ct method. Pairwise comparisons of gene expression were evaluated using the Wilcoxon Rank Sum test. ns: not significant; **p < 10−7; ***p < 10−10.

References

    1. McDermott A. News feature: To understand the plight of insects, entomologists look to the past. Proc. Natl. Acad. Sci. U. S. A. 2021 doi: 10.1073/pnas.2018499117. - DOI - PMC - PubMed
    1. Hallmann CA, et al. More than 75 percent decline over 27 years in total flying insect biomass in protected areas. PLoS ONE. 2017;12:e0185809. doi: 10.1371/journal.pone.0185809. - DOI - PMC - PubMed
    1. Møller AP. Parallel declines in abundance of insects and insectivorous birds in Denmark over 22 years. Ecol. Evol. 2019;9:6581–6587. doi: 10.1002/ece3.5236. - DOI - PMC - PubMed
    1. Bell JR, Blumgart D, Shortall CR. Are insects declining and at what rate? An analysis of standardised, systematic catches of aphid and moth abundances across Great Britain. Insect. Conserv. Divers. 2020;13:115–126. doi: 10.1111/icad.12412. - DOI - PMC - PubMed
    1. Wagner DL. Insect declines in the anthropocene. Annu. Rev. Entomol. 2020;65:457–480. doi: 10.1146/annurev-ento-011019-025151. - DOI - PubMed

Publication types