. 2022 Sep 23;12(1):15891.
doi: 10.1038/s41598-022-19047-1.

A 3D image-based modelling approach for understanding spatiotemporal processes in phosphorus fertiliser dissolution, soil buffering and uptake by plant roots

Affiliations

A 3D image-based modelling approach for understanding spatiotemporal processes in phosphorus fertiliser dissolution, soil buffering and uptake by plant roots

K A Williams et al. Sci Rep. .

Abstract

Phosphorus (P) is a key yield-limiting nutrient for crops, but the main source of P fertiliser is finite. Therefore, efficient fertilisation is crucial. Optimal P application requires understanding of the dynamic processes affecting P availability to plants, including fertiliser dissolution rate and soil buffer power. However, standard soil testing methods sample at fixed time points, preventing a mechanistic understanding of P uptake variability. We used image-based modelling to investigate the effects of fertiliser dissolution rate and soil buffer power on P uptake by wheat roots imaged using X-ray CT. We modelled uptake based on 1-day, 1-week, and 14-week dissolution of a fixed quantity of total P for two common soil buffer powers. We found rapid fertiliser dissolution increased short-term root uptake, but total uptake from 1-week matched 1-day dissolution. We quantified the large effects root system architecture had on P uptake, finding that there were trade-offs between total P uptake and uptake per unit root length, representing a carbon investment/phosphorus uptake balance. These results provide a starting point for predictive modelling of uptake from different P fertilisers in different soils. With the addition of further X-ray CT image datasets and a wider range of conditions, our simulation approach could be developed further for rapid trialling of fertiliser-soil combinations to inform field-scale trials or management.


Conflict of interest statement

The authors declare no competing interests.

Figures

Figure 1
Figure 1
Visual description of 3D image-based modelling domain and model progression. The surface boundaries representing the edge of the pot and internal artificial boundaries where we subsample the image, Γe are shown on (a); the fertiliser surface, Γf on (b); and the root surfaces, Γr on (c). (a) The initial state of the model with the roots deactivated and the fertiliser pellet primed to start dissolution; (b) In the first 6 weeks the roots remain inactive but the fertiliser pellet releases phosphorus into the soil which diffuses over this period; (c) After 6 weeks the roots reached the pellet (as calculated from the time-resolved XCT-data) and the roots are activated and take-up phosphorus from the soil. The phosphorus continues to diffuse in the soil. Purple shading is for illustrative purposes only.
Figure 2
Figure 2
Visualization and root length density measurements in the randomised sectors. (a) 3D rendering of the sample 01 root system in the randomized sector. The approximated location of the fertiliser pellet is rendered in purple and the root are coloured by their distance from the fertiliser pellet. (b) Root length per depth. (c) Root length density with distance from estimated positions of fertiliser pellets (distances are maximum distances in the chosen range i.e. 1 cm = 0–1 cm) in 14 week old spring wheat plants.
Figure 3
Figure 3
Visualisation of the root uptake rate evolution of the sample 01 root system for the 1-day and 14-week dissolution treatments. Pellet dissolution began at Day 0, root P uptake was switched on at Day 42. Day 43, 55 and 75 are selected for visualisation purposes. (ac) Show the low buffering soil with 1-day fertiliser dissolution. (df) Show the low buffering soil with 14-week fertiliser dissolution. (gi) Show the high buffering soil with 1-day fertiliser dissolution. (jl) Show the high buffering soil with 14-week fertiliser dissolution.
Figure 4
Figure 4
Simulated total phosphorus uptakes integrated over the whole experiment for different P dissolution rates averaged across 3 root systems (a,b) and total uptakes per root surface area (c,d) over the fertiliser treatments. Error bars show standard deviation, n = 3. (a) Total uptake averages in the low buffering soil. (b) Total uptake averages in the high buffering soil. (c) Total uptake per root surface area averages in the low buffering soil. (d) Total uptake per root surface area averages in the high buffering soil. For visualisation purposes, root images show uptake rate at 43 days.
Figure 5
Figure 5
Simulated uptake rate dynamics from 6 weeks until 14 weeks for both the low and high buffering soil. Root uptake was started at 6 weeks following dissolution of the fertiliser from day zero. Each soil has the same total quantity of P initially. The first column shows the low buffering case (buffer power 40) and the second shows the high buffering case (buffer power 519). Each row highlights one of the three root systems showing the 4 fertiliser dissolution cases: Zero fertiliser, 14-week dissolution, 1-week dissolution and 1-day dissolution within that soil type. (a) Low buffering soil with 01 root system. (b) High buffering soil with sample 01 root system. (c) Low buffering soil with sample 02 root system. (d) High buffering soil with sample 02 root system. (e) Low buffering soil with sample 03 root system. (f) High buffering soil with sample 03 root system. For visualisation purposes, root images show uptake rate at 43 days. The faded lines show the other root system measurements in each soil type to ease comparison between plants.
Figure 6
Figure 6
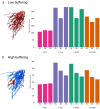
Simulated total P uptake integrated over the whole experiment in (a) low buffering soil (b) high buffering soil. Different cases represent P dissolving from a pellet over 1-day, 1-week, and 14-weeks, and a case with no added P fertiliser (zero fertiliser) for three different root systems (samples 01, 02, 03). For visualisation purposes, root images show uptake rate at 43 days.
Figure 7
Figure 7
Simulated total P uptake per root surface area integrated over the whole experiment in (a) low buffering soil (b) high buffering soil. Different cases represent P dissolving from a pellet over 1-day, 1-week, and 14 weeks, and a case with no added P fertiliser (zero fertiliser) for three different root systems (samples 01, 02, 03). For visualisation purposes, root images show uptake rate at 43 days.

References

    1. Barber SA. Soil Nutrient Bioavailability: A Mechanistic Approach. Wiley; 1995.
    1. Shen J, et al. Phosphorus dynamics: From soil to plant. Plant Physiol. 2011;156:997–1005. doi: 10.1104/pp.111.175232. - DOI - PMC - PubMed
    1. Food and Agriculture Organization of the United Nations (2019).
    1. Blackwell M, Darch T, Haslam R. Phosphorus use efficiency and fertilizers: Future opportunities for improvements. Front. Agric. Sci. Eng. 2019;6:332–340. doi: 10.15302/J-FASE-2019274. - DOI
    1. Withers, P. J., Sylvester-Bradley, R., Jones, D. L., Healey, J. R. & Talboys, P. J. Feed the Crop Not the Soil: Rethinking Phosphorus Management in the Food Chain (ACS Publications, 2014). - PubMed

Publication types